Understanding Raman Spectrometer Parameters
Special Issues
Today's Raman spectrometers are more capable than ever before. The seeds of innovation in filter, laser, and CCD technology have produced a crop of instruments that are fast, sensitive, and robust. This is good news because scientists are constantly bombarded with challenging problems that require the top performance from their instruments.
Modern Raman systems provide advanced "smart" algorithms that considerably aid in the optimization of the instrument's operating parameters. Inevitably, however, there are those who wish to understand the instrument's operation beyond its automated operation and to learn more about the interaction of various instrument settings. This article presents best practices for those who would like to better understand Raman spectrometer parameters.
Some key aspects of dispersive Raman systems will be presented and advice on best practices is provided to enable optimum results, including laser power, aperture, exposure time versus number of exposures, sample focus, and background handling. Concluding will be a discussion on cosmic ray rejection, photobleaching, alignment, and calibration.
Best Practices
Laser power: Raman signal strength is directly proportional to the power of the Raman laser (milliwatts) exciting the sample. It should be clear that the more laser power used, the larger the Raman signal will be. This is why the first best practice is to use full laser power whenever possible. One drawback to this recommendation is some samples will burn when exposed to full laser power. Usually, such samples are dark in color or have an absorption band close to the excitation wavelength. With valuable samples, dial down the laser power and check for sample damage. Increase the laser power exponentially until comfortable there is no sample damage.
Just as important is laser power density at the sample. This can be maximized through the use of what is known as a high brightness laser, which allows tighter focus and improves Raman scatter "yield" for a given laser power. Sometimes there is a fine line between maximizing signal and burning a sample. Accurate measurement and very fine control of laser power at the tenths of milliwatts level is desirable. Some of the latest Raman systems on the market measure exact laser output and allow this fine control, making them ideal for samples such as carbon nanotubes and surface-enhanced Raman spectroscopy (SERS) experiments that are very sensitive to laser power.
Aperture: Another key hardware consideration is the instrument aperture. The aperture controls how much Raman signal passes into the spectrograph and onto the detector. Its primary use is to achieve spectral resolution. In some Raman microscope systems, it also enables confocal operation. As a general rule, use the largest aperture whenever possible. For example, a 50-μm slit.
Apertures are typically slits or pinholes. They range in size from small, 10–20 μm to large, 50–100 μm. The larger the aperture, the greater the Raman signal admitted into the spectrograph and the larger the signal appears in the spectrum.
Smaller apertures (10–25 μm) yield the rated spectral resolution of an instrument. Using a larger aperture (50–100 μm) will degrade the spectral resolution slightly. However, the loss in spectral resolution is often insignificant. A quick comparison of spectra collected with each size aperture will help with the decision. The choice of aperture for the application requires some experimentation.
Figure 1 shows an acetaminophen tablet measured with 532-nm excitation. The difference in spectral resolution is minimal.
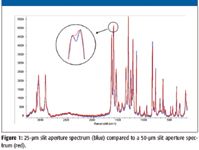
Figure 1
Pinhole apertures admit the least amount of light. Pinholes are needed only when confocal operation with the Raman microscope is required. The choice here is relatively simple: if confocal operation is not needed, use slits. With a large, bulk sample, always use slits as confocal capability is not required anyway.
One thing to keep in mind when comparing instrument specifications is the absolute size of an aperture. The size depends upon the optical design. A 10-μm aperture in one design might be equivalent to a 25-μm aperture in another. The size alone does not dictate spectral resolution.
When to use a smaller aperture: Sometimes higher resolution is needed to adequately identify samples. For example, distinguishing between different polymorphs or looking at ring breathing modes in carbon nanotubes.
The Raman spectrum of l-cystine (Figure 2) is a good example to show the benefit of high spectral resolution. l-Cystine is sometimes used to measure Raman spectrometer resolution because it has several bands that are very close together, such as the two peaks at 76.8 and 65.7 cm-1 Raman shift. There is also a shoulder on the peak at 110 cm-1 that requires high resolution to detect.
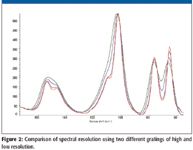
Figure 2
The main point to remember is a large aperture can provide a spectrum in cases in which the Raman signal is very weak with a minor loss of resolution. If there is adequate Raman signal, then by all means, use the smaller aperture will achieve the best spectral resolution.
Despite the perception that the higher the spectral resolution the better, again there are tradeoffs and most practical Raman analyses including identification, detecting peak shifts, and revealing fine structure can be achieved at 4 and even 8 cm-1 resolution. These resolutions provide an ideal balance between analytical information and signal to noise.
Exposure time versus number of exposures: Modern Raman instruments enable the control of data acquisition by adjusting the exposure time and the number of exposures added together for a final spectrum. For best results, start by maximizing the exposure time.
Exposure time is completely analogous to a photographic camera. Just as a longer exposure gives you a better picture in dim light, you get a better spectrum from a weak Raman scatterer.
Spectroscopy is static. As such, for scientific measurements, it is common practice to record multiple exposures and combine them. This has been done for years by astronomers, physicists and chemists.
Given the two options, longer exposure time versus more exposures, which is best? Deciding to choose a longer exposure time or use more exposures comes down to signal-to-noise ratio. Raman signals are measured in counts per second (cps). Using a longer exposure time or averaging many spectra will not increase the signal — just reduce the noise. The previous topics (laser power and aperture) explain how to increase the Raman signal. So the question comes down to which does a better job of reducing noise in the final spectrum.
It turns out the main sources of noise in modern dispersive Raman systems are read noise and shot noise (1/f noise). Read noise is the noise introduced when the charge in the CCD is digitized and converted to a spectrum. Shot noise is noise proportional to the intensity of the signal (either Raman or fluorescence). Most CCD detectors themselves are very quiet and do not contribute significantly to noise when collecting signal during exposure.
For a quiet sample, one with little shot noise, it makes sense that for a given measurement time, two long exposures produces less noise than many, short exposures. There are fewer read operations. Figure 3 is a good example of this effect.
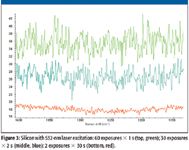
Figure 3
The sample used for Figure 3, silicon with 532-nm laser excitation, is collected for a total measurement time of 1 min. The number of exposures and exposure time are varied to produce the same total measurement time. The top trace (green) is the shortest exposure time (60 exposures × 1 s); the bottom trace (red) is the longest exposure time (2 exposures × 30 s). It is clear the longer exposure time yields lower noise.
For samples with a fluorescence background, the difference is less pronounced. The reason being the shot noise caused by the fluorescence signal now contributes more to the spectrum noise level than other sources of noise.
Figure 4 shows a Raman spectrum of sugar using a 1-min total measurement time and 532-nm excitation. One spectrum uses a long exposure time (2 × 30 s); the other uses a larger number of scans (10 × 6 s).
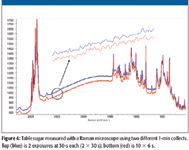
Figure 4
The inset shows an enlargement of the baseline from 2608–2484 cm-1 Raman shift. The 2 × 30 s spectrum shows a slight reduction in noise but the difference is negligible.
For samples with lots of Raman signal, it does not make a huge difference what combination of exposure time and number of exposures is selected. It is weak Raman scatterers where these guidelines really pay off.
Throughout this discussion, two exposures have been used. It is possible to use one exposure, but it is necessary to consider a main source of interference for integrating detectors like CCDs: cosmic rays.
Recently, Raman systems have become smarter and incorporate many of these guidelines in software. For example, Thermo Scientific (Madison, Wisconsin) Raman systems include an auto-exposure feature. Auto-exposure selects the optimum exposure time and number of exposures for the sample. The signal-to-noise ratio is selected along with the maximum collection time. The software determines the data collections parameters to give the best spectrum without saturating the detector.
Sample Focus
Whether using a Raman microscope or a conventional Raman sampling accessory (nonmicroscope), the sample must be placed at the correct focus. It is critical that the excitation laser focus be coincident with the Raman collection optics. There are some Raman techniques, such as spatially offset Raman spectroscopy (SORS) (1), which rely on an offset of these beam paths. For the purposes of this discussion, traditional Raman spectroscopy is assumed. Most modern instruments handle this by using a 180° sampling geometry. This uses the same optics to excite and observe the sample. Even with this design, it is still important that the laser and spectrograph be aligned optimally to the beam path.
When using visible wavelength lasers (514, 532, 633 nm), the visual focus and Raman focus are very close to being the same distance from the lens. It is sufficient to simply focus on the sample visually (microscope eyepieces or video camera) and collect data.
When using longer wavelength lasers (780 nm and longer), there is a significant difference between the visual sample focus and the focus giving best Raman signal. (IR wavelengths focus further from the lens than visual ones.) After visually focusing on the sample, it is necessary to "maximize" the Raman signal. This is best done by watching the Raman signal while adjusting the focus or, optionally, using autofocus.
Autofocus adjusts the sample position to attain the maximum Raman signal from the sample. For a Raman microscope, the sample needs to be placed on the stage and visually focused on the sample. The automated stage option is required which includes a Z-axis (focus) motor.
For conventional Raman systems (nonmicroscope), an autofocus capability is even more useful because there is no visual focus reference. The sample is placed on the sample holder and the collect started. The system will locate the position for maximum Raman signal. Some algorithms enable the modification of the autofocus behavior of the system.
Background signals sometimes interfere with autofocus, for example, when attempting to measure a sample at the bottom of a plastic well plate. The plastic material also produces a Raman signal. Depending upon the intensity of the analyte Raman signal, the plastic signal can "fool" the autofocus operation. To eliminate this problem, some systems provide the option to ignore a background interference. The software lets you identify a reference spectrum and subtract it before performing the autofocus operation.
Background Handling
The final best practice recommendation involves background correction. This is somewhat of a misnomer because Raman is a scattering experiment with, ideally, no background. The "background" is actually the dark signal from the CCD detector. Dark signal is the product of dark current and exposure time. If either of these are changed, the background changes.
Dark current involves residual electrons in the detector and depends primarily upon temperature. As the CCD cools, the dark current is reduced beneficially but the quantum efficiency, QE, is also reduced negatively. This is why most Raman systems utilize a cooled detector (CCD). Some CCD cameras are capable of operating down to liquid nitrogen temperature. This offers no significant reduction in noise for Raman because the QE is reduced at these colder temperatures.
A good way to correct for the dark signal is to store background spectra measured at different exposure times while keeping the detector temperature constant. This is a slight inconvenience because every time the exposure time is exchanged, a new background is required. Fortunately, the software in most modern systems use data caching to handle this smoothly.
OMNIC software (Thermo Scientific) measures backgrounds across a range of exposure times. A mathematical model is constructed that is used to predict the background response for any exposure time. This enables any exposure time to be used without having to collect new backgrounds.
Cosmic Ray Rejection
Cosmic rays are natural events detected by sensitive integrating detectors such as a CCD. They are random, unpredictable events. They typically show up as spikes in Raman spectra or backgrounds. They can also appear as broad singularities.
Most systems provide cosmic ray rejection as an option during data collection. It is a good idea to always use this option, particularly for long exposures lasting more than a few seconds. While cosmic rays are infrequent, it is not unusual to get one during a 30–60 s exposure.
Cosmic ray rejection requires two exposures. The two exposures are compared to detect and repair events. This is why many systems require a minimum of two exposures for each collection. Even if cosmic rays are not detected, the second exposure is advantageous because it reduces noise via signal averaging.
Photobleaching
Photobleaching exposes the sample to laser radiation for a specified amount of time before starting data collection. This laser exposure reduces fluorescence by "bleaching" impurities in the sample that cause the fluorescence.
Figure 5 is an example of the benefit of photobleaching. The sample is a Tylenol tablet measured with 532-nm laser excitation. The background signal drops in half from 12,000 cps to 6000 cps, resulting in a 40% increase in signal-to-noise ratio because of the reduction in shot noise.
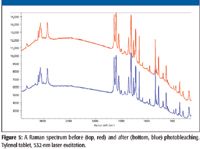
Figure 5
Alignment and Calibration
Alignment and calibration are two distinctly different operations that guarantee the best performance from an instrument.
Alignment is the process of bringing the excitation laser beam focus and spectrograph sampling point into agreement. Calibration assures the accuracy of the spectrum wavelength axis (x-axis) and intensity axis (y-axis). Alignment involves adjusting the instrument optics for optimum performance. Calibration involves measurement of standard reference materials followed by processing with mathematical algorithms.
Typically, both of these operations are done at the factory for new systems and then are checked again when the system is installed in your laboratory.
Alignment
Alignment is the process of bringing the excitation laser beam focus and spectrograph sampling point into agreement.
- The laser beam path: the laser spot defines the sampling point.
- The spectrograph path: where the spectrograph is looking.
For a Raman microscope, there is an additional constraint: the sampling point must coincide with a visual target such as crosshairs.
- The visual beam bath: the crosshairs, which direct where to place the sample.
To achieve optimum alignment, the optics inside the instrument are adjusted. Ideally, this should be a routine operation that does not require a service call. The process described below is one method to ensure all three beam paths are in agreement.
For microscope systems, an alignment accessory is placed on the sample stage and focused on its illuminated pinhole so it is at the crosshairs of the microscope objective. Spectrograph alignment adjusts the instrument beam path so the signal from the pinhole is maximized. This guarantees the spectrograph focus coincides exactly with the visual reference (crosshair).
At this point, the spectrograph and visual reference are aligned. The final step is to bring the laser into alignment.
Laser alignment adjusts the laser beam path so a Raman signal is maximized. This guarantees the laser focus coincides exactly with the spectrograph focus. This is achieved by placing a Raman sample at the microscope objective focus. Again, the optics are controlled by an algorithm to locate and record the optimum alignment automatically. The Raman signal from polystyrene is maximized when both the laser and spectrograph beam paths agree.
A well-aligned system should allow you to pinpoint a sample as small as 1 μm visually and acquire a good Raman spectrum of that sample on the first try, without further adjustment or correction.
Calibration
As mentioned earlier, calibration assures the accuracy of the spectrum wavelength axis (x-axis) and intensity axis (y-axis).
Calibration of the x-axis uses reference materials having known wavelength or Raman shift positions, for example, neon for wavelength calibration or polystyrene for Raman shift (wavenumber, cm-1) calibration.
Calibration of the y-axis attempts to correct for instrument function so Raman bands in a spectrum have the same relative intensities regardless of the excitation laser or other system components.
Intensity correction uses either a standardized white light (of known emittance) or a fluorescent glass material. NIST has a certification program for fluorescent glass materials (2,3).
As with alignment, the calibration operation should be a routine and painless task. This usually involves placing calibration samples (artifacts) at the sampling point and collecting reference spectra. From that point, the software automatically calculates the calibration parameters and applies these to subsequent data acquisitions.
If you think about it, calibration is dependent upon optical alignment of the system. Therefore, for best practices, the instrument needs to be recalibrated after the alignment is changed.
Instrument stability depends upon several factors such as the environment, the laboratory practices, and so forth. Probably the best advice is to keep records of a standard sample and let that be the indicator of when to re-calibrate. Most systems have validation or verification software which automate this process and provide a trend chart showing system performance over time.
Calibration algorithms available include single-point and multipoint methods. If one wants to demonstrate wavelength accuracy across a spectral range, a calibration using peaks spanning that range is highly recommended.
Conclusion
Advances in instrument design and technology have made using Raman spectrometers easier than ever before. In most cases, excellent results can be obtained without the need to manipulate a number of operational parameters, much like modern a camera typically gives excellent results when simply set to "Auto." However, just as cameras enable you to override automatic settings, you can manage many of operating parameters yourself. Of course, once you switch out of "Auto" mode, you will need to acquire knowledge about your spectrometer's operation. We hope this article helps in that endeavour.
Dick Wieboldt is a principal scientist with Thermo Fisher Scientific, Madison, Wisconsin.
References
(1) P. Matousek, I.P. Clark, E.R.C. Draper, M.D. Morris, A.E. Goodship, N. Everall, M. Towrie, W.F. Finney, and A.W. Parker, Appl. Spectrosc. 59(4), 393–544 (2005).
(2) S. J. Choquette, E.S. Etz, W.S. Hurst, D.H. Blackburn, and S.D. Leigh, Appl. Spectrosc. 61(2), 117–237 (2007).
(3) Relative Intensity Correction Standards for Fluorescence and Raman Spectrosopy, NIST: http://www.nist.gov/cstl/biochemical/bioassay/fluorescence_raman_intensity_standards.cfm
AI-Powered SERS Spectroscopy Breakthrough Boosts Safety of Medicinal Food Products
April 16th 2025A new deep learning-enhanced spectroscopic platform—SERSome—developed by researchers in China and Finland, identifies medicinal and edible homologs (MEHs) with 98% accuracy. This innovation could revolutionize safety and quality control in the growing MEH market.
New Raman Spectroscopy Method Enhances Real-Time Monitoring Across Fermentation Processes
April 15th 2025Researchers at Delft University of Technology have developed a novel method using single compound spectra to enhance the transferability and accuracy of Raman spectroscopy models for real-time fermentation monitoring.
Nanometer-Scale Studies Using Tip Enhanced Raman Spectroscopy
February 8th 2013Volker Deckert, the winner of the 2013 Charles Mann Award, is advancing the use of tip enhanced Raman spectroscopy (TERS) to push the lateral resolution of vibrational spectroscopy well below the Abbe limit, to achieve single-molecule sensitivity. Because the tip can be moved with sub-nanometer precision, structural information with unmatched spatial resolution can be achieved without the need of specific labels.
