Early Detection of Gastric Cancer Using Wavelet Feature Extraction and Neural Network
A new method for the early detection of gastric cancer uses a combination of feature extraction based upon continuous wavelets for Fourier transform-infrared spectroscopy (FT-IR) and classification using an artificial neural network trained with a back-propagation algorithm.

Curing cancer depends upon early diagnosis and prompt treatment (1–5). The main method for diagnosing cancer is tumor tissue pathology. However, the nonquantification pathologic diagnosis process is tedious and often is influenced by human factors. Recently, the development of technology such as endoscopy, phantom study diagnosis, and tracer diagnosis has made accurate cancer diagnosis possible. However, all of these methods still cannot satisfy the clinical requirement in many aspects. Therefore, researchers are diligently exploring a simple, practical, highly accurate, and less expensive method. Because Fourier transformation–infrared spectroscopy (FT-IR) contains rich information for complex systems such as biological tissue, cell structure, and chemical composition, many methods based upon FT-IR have been developed for cancer diagnosis (6–10). Changes in cellular and subcellular structure by malignant transformation can be detected by advanced FT-IR. In particular, the technique can be used to detect and monitor characteristic changes in molecular composition and structure when tissue is transformed from a normal state to a cancerous state (11,12). Structural changes associated with lung cancer and tuberculous cells in pleural fluid were studied using microscopic FT-IR (13–16). Prostate cancer tissues have been analyzed using FT-IR microspectroscopy and synchrotron radiation–induced X-ray emission methods (17).
The wavelet transform plays an important role in signal analysis and feature extraction. It can be used to detect the singularity of a signal and to identify a small difference between two signals. The wavelet transform can be divided into two categories: discrete wavelet transform (DWT) and continuous wavelet transform (CWT). The cost of the DWT computation is less than the cost of the CWT computation. However, CWT is better at detecting the singularity of the signal (18).
This article focuses on how to efficiently identify normal tissue, early cancer, and advanced cancer. The identification between normal tissue and early cancer is difficult because their FT-IR spectra are very similar. To improve the classification accuracy rate, some important features were extracted in the CWT domain. These features were inputted to the back-propagation neural network (BPNN) to identify the normal tissues, early cancer, and advanced cancer. Experimental results show that the new method is more efficient and much better at identification than the traditional method solely based upon FT-IR.
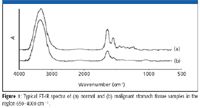
Figure 1
Theoretical
Continuous Wavelet Transform
CWT is the sum of the signal multiplied by the scaled and shifted mother wavelet function. The wavelet coefficients are a function of scale and position. Normally, wavelet decomposition consists of calculating the "resemblance coefficients" between the signal and the wavelet located at position b of scale a. If the coefficients are large, the resemblance is strong. Otherwise, it is weak. The coefficients C(a,b) are calculated as follows (19,20):

where ψ represents wavelets, s is signal, a is scale, and b is position.
Pattern Classification Based upon BPNN
The BPNN is one of the most common neural network structures because it is simple and effective. However, the back-propagation algorithm using the gradient descent method is not optimal. The modification of the weights is done according to the gradient of the error curve, which points in the direction of the local minimum near the instance. The resilient propagation (Rprop) algorithm for BPNN provides the solution to this problem.
There are four variables to be used in the Rprop algorithm: initial weight adjustment step S0, maximum weight adjustment step Smax, increasing weight adjustment step W+ , and decreasing weight adjustment step W- . The preferred values for increasing and decreasing weight adjustment step are set as W+ = 1.2, W- = 0.5, respectively. The initial weight adjustment step S0 can be set arbitrarily. Usually, S0 = 0.1, Smax = 50.0.
The number of hiding layer neurons can be estimated by following the following equation:

where Hn indicates the number of hiding layer neurons, In shows the number of input layer neurons, and On represents the number of output layer neurons. The number of hiding layer neurons is 10, according to initial computation. Based upon this, the neural network is trained and predicted by increasing or decreasing the number of the hiding layer neurons. The optimal number of hiding layer neurons can be obtained when the predicted accuracy is the highest (21,22).
Materials and Methods
Tissue Preparation
A total of 172 pairs of fresh normal and cancerous stomach tissues were collected from 172 patients. The patient group included 101 males and 71 females, aged 42–70 years old. The fresh samples were obtained from the Anatomical Pathology Laboratory at Jinhua Municipal Central Hospital (Zhejiang, China). The normal part of the stomach tissue was taken from the same stomach 5–10 cm away from the cancerous stomach tissues. Each tissue was divided into two equal parts. One was washed with aqueous sodium chloride at room temperature (between 18 °C and 22 °C), and the other was fixed with 10% formalin, embedded in paraffin, and stained with hematoxylin and eosin for pathological examination. The collected sample tissues were put in the horizontal attenuated total reflection (HATR) sampling accessory for FT-IR analysis.
Spectral Measurements
FT-IR spectra were collected in a Nicolet NEXUS 670 FT-IR spectrophotometer and a single-bounce HATR accessory (ThermoFisher, Madison, Wisconsin) equipped with a deuterated triglycine sulfate (DTGS) detector in the 4000–650 cm-1 region with fully computerized data storage. All data were processed with OMNIC 5.2 software (ThermoFisher, Madison, Wisconsin). All spectra were recorded as 64 scans with 2-cm-1 resolution. The FT-IR spectrum background was recorded before collecting the sample's FT-IR spectrum. Reference spectra were recorded using a blank HATR germanium wafer. Single-beam spectra were obtained for all samples and a ratio was calculated against the background spectra of air to present the spectra in absorbance units. The tissue sample was put on a germanium wafer and then impacted using a pressure tower. FT-IR spectra were collected according to the instrument test requirement. After each experiment, the HATR germanium wafer was washed thoroughly with distilled water and dried with nitrogen, and its spectra were examined to ensure that no residue from the previous experiment was retained on the germanium wafer surface. All of the tissue samples were dried with absorbent cotton and further dried with nitrogen. The tissue samples covered the whole area of the HATR element that contributes to the spectral measurement. All spectra were automatic baseline corrected. All experiments were repeated three times, and the averaged spectra were used for further analysis.
Results and Discussion
FT-IR Analysis
A pair of normal and malignant tissue samples from each patient were studied. The FT-IR spectra of normal and gastric cancer tissues were collected by FT-IR with HATR directly (Figure 1). The absorption band around 3500 cm-1 was attributed to –OH on stretching.
In the 1645–836 cm-1 region, the infrared spectrum of the samples can be divided into three absorption band parts. Part 1 includes absorption bands at 1645 cm-1 and 1556 cm-1 , which are the amide I and amide II vibrations of the protein, and include water bending mode at 1640 cm-1 existing in tissues (10). The protein absorption peak of the cancerous gastric tissue has a lower value than the normal tissue. Part 2 includes absorption bands in the range of 1457–1283 cm-1 . The band at 1457 cm-1 is symmetric and asymmetric CH3 bending of the methyl groups of lipid, protein, nucleic acid, and glucide matter, respectively, and the absorption band at 1339 cm-1 is the connective tissue of collagen. FT-IR spectra of normal gastric tissue had higher intensity of the absorption band in the region part 2, where the cancerous gastric tissue has no absorption. Part 3 includes absorption bands in the range of 1246–836 cm-1 , which is the absorption peak of stretching vibration of phosphodiester. The bands at 1206 and 1036 cm-1 are the connective tissue of collagen. The band at 1246 cm-1 is the asymmetric phosphate (PO2- [asym]) stretching. The band at 1084 cm-1 is the symmetry phosphate (PO2- [sym]) stretching. Glycogen is also a main contributor to the intensity of this band. The vibrations of the PO2- groups are mainly in the phosphodiester groups on nucleic acids (1). The band at 1036 cm-1 , which is found frequently in the glycogen-rich tissues, is assigned as –CH2OH vibrations and the C–O stretching coupled with C–O bending of the C–OH carbohydrates, respectively (10). The absorption peak of the cancerous tissue was reduced or disappeared altogether.
The difference between FT-IR of advanced cancer and normal issue is big, so they can be identified easily. The FT-IR spectra between early cancer tissue, normal tissue, and benign tumor tissue are similar (Figure 2), so accurate identification is difficult.
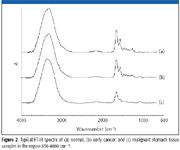
Figure 2
Figure 3 shows immunohistochemistries in the normal, early cancer, and malignant stomach tissue samples, which correspond to spectra of three kinds of tissue samples. CWT was used to extract the features of FT-IR spectra. BPNN was employed to identify normal tissue, early cancer, and advanced cancer.

Figure 3
The higher information quantities exist in the 3600–2800 cm-1 and 1800–650 cm-1 regions. The former includes the absorbability of OH and N–H stretching bands, and the character is not obvious. The latter includes the fingerprint region, which contains more molecule structure information. Thus, we selected the 1800–650 cm-1 region to extract the spectral features.
The Result of CWT
The proper wavelet base and decomposition level were decided by analyzing the signal spectra property and the comparison of decomposition results with different wavelet bases and decomposition levels (22). We chose three feature peaks in the CWT domain to extract the features of FT-IR. Morlet wavelet was selected as the analysis wavelet. The wavelet decomposition level was set as 17.
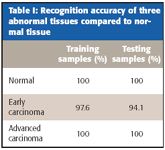
Table I: Recognition accuracy of three abnormal tissues compared to normal tissue
Figure 4 shows preprocessed FT-IR spectra of cancerous gastric tissue and its CWT coefficients, in which d1–d15 indicates detailed information after decomposition (fine to coarse).
From Figure 4, we can see that the detailed signal d1 is a high-frequency signal, while d5, d10, and d15 are more sensitive to the changes of the spectra. Because d5, d10, and d15 had strong responses to the three feature peaks of the original signal, they were used as feature vector spaces. Figure 5 shows a diagram of a divided feature space. Three feature bands were selected from each detailed signal, which corresponds to the same feature peaks. The feature vectors were defined as the average value of energy at each feature band. Thus, nine feature variances were generated from three detailed signals. To speed up the convergence of the BPNN and guarantee its stability, all feature variables for all samples were extracted and mean value and normalization were applied to ensure that the output of the BPNN was controlled between –1 and 1.
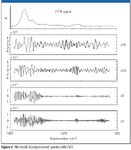
Figure 4
Classification Results with the BPNN
The BPNN consisted of three layers of nodes: one input layer, one hidden layer, and one output layer. In calibration applications, the input data were used to determine the CWT-IR values in two groups, and only one linear output node was used in the output layer. The number of hidden layer neurons is set as 20. The mean square error threshold was set as 0.005. The expected value of the output node was set as 0.3 for normal tissues and 0.7 for abnormal tissues. Three neurons were chosen in the hidden layer, and different learning speeds were studied. The results showed that the learning speed had little effect from 0.5 to 2.0, but it could affect convergence speed. After a careful analysis, we selected 1.5 as the learning speed. During the training process, the training sample and prediction sets were standardized to adjust sigmoid function. When a desired level of precision was obtained in the estimated class, the training process stopped. The most exciting aspect of this method was that the training process, which accommodated nonlinear response in normal tissues and abnormal tissues, adjusted its weights automatically. It did not need to know the mean values of normal tissues and abnormal tissues, and it could distinguish the two classes efficiently.

Figure 5
As shown in Table I, the BPNN was able to identify all but two cases correctly. The accuracy of identifying early carcinoma, advanced carcinoma, and normal tissue was 94.1%, 100%, and 100%, respectively.
From Table I, we can see that the accurate rate for normal and advanced cancer in the training data is 100%. There was only one sample that could not be identified accurately when the early cancer samples were trained by BPNN. The identification accurate rate was 100% when the test samples of the normal tissues and advanced cancer were tested by the trained BPNN. This is because the difference between normal tissues and advanced cancer is big. Three of the early cancers could not be identified accurately, because the early cancer is between normal tissue and advanced cancer and their CWT coefficients of FT-IR are also similar.
Conclusions
The pathogenesis and development of gastric carcinoma are multistep processes that are controlled by many genes and affected by many factors. FT-IR provides information about molecular structure, which makes it possible to reflect the changes of protein, nucleic acid, sugar, and fat in cells and the structure changes of space array of the molecule. Thus, the diagnosis of cancer cells could be made at the molecular level. By applying the wavelet feature extraction of the FT-IR data and BPNN classification, better results can be achieved to distinguish normal tissue from early-stage cancerous tissue and make early detection of cancer possible.
Acknowledgments
The authors would like to thank the Anatomical Pathology Laboratory of Jinhua Municipal Central Hospital, Jinhua, Zhejiang province, China, for providing the samples.
References
(1) C.G. Cheng, H.Q. Shi, X.J. Zhu, R.Q. Zheng, and S.T. Zhu, Spectrosc. Spect. Anal. 24, 1342–1344 (2004).
(2) B. Rigas and P. Wong, Cancer Res. 52, 84–88 (1992).
(3) B.S. Wiseman and Z. Werb, Science 296, 1046–1049 (2002).
(4) A.H. Wang, C.S. Sun, L.S. Li, J.Y. Huang, and Q.S. Chen, World J. Gastroenterol. 8, 49–53 (2002).
(5) H. Hen, L.D. Wang, M. Guo, S.G. Gao, H.Q. Guo, Z.M. Fan, and J.L. Li, World J. Gastroenterol. 9, 16–21 (2003).
(6) A.R. Shaw, Y.S. Low, M. Leroux, and H.H. Mantsch, Clin. Chem. 47, 1493–1495 (2000).
(7) S. Adam, J. Liquier, J.A. Taboury, and E. Taillandier, Biochemistry 25, 3220–3225 (1986).
(8) H.P. Wang, H.C. Wang, and Y.J. Huang, Sci. Total Environ. 204, 283–287 (1997).
(9) Q.B. Li, Z. Xu, Y.Z. Xu, Y.F. Zhang, N.W. Zhang, L.X. Wang, X.J. Sun, L. Zhang, F. Wang, L.M. Yang, Y. Zhao, Y. Ren, Z. Liu, S.F. Weng, W.J. Zhou, and J.G. Wu, Chem. J. Chinese U. 25, 2010–2012 (2004).
(10) Y.Z. Xu, L.M. Yang, Z. Xu, Y. Zhao, X.F. Lin, Q.B. Li, J.S. Wang, N.W. Zhang, Y.F. Zhang, and J.G. Wu, Sci. China, Ser. B. 34, 465–472 (2004).
(11) M. Huleihel, A. Salma, V. Erukhimovitch, J. Ramesh, Z. Hammody, and S.Mordechai, J. Biochem. Biophys. Methods 50, 111–121 (2002).
(12) Z.F. Cheng, L.Y. Cheng, W.Y. Jin, and C.G. Cheng, J. Harbin Engineering Univ. 27(s), 366–369 (2006).
(13) C. Paluszkiewicz and W.M. Kwiatek, J. Mol. Struct. 565–566, 329–334 (2001).
(14) J. Zhou, L.Q. Zhao, M.M. Xiong, X.Q. Wang, G.R. Yang, Z.L. Qiu, M. Wu, and Z.H. Liu, World J. Gastroenterol. 9, 9–15 (2003).
(15) M. Xu, Y. L. Jin, J. Fu, H. Huang, S.Z. Chen, P. Qu, H.M. Tian, Z.Y. Liu, and W. Zhang, World J. Gastroenterol. 8, 200–202 (2002).
(16) F.K.F. Michael, S. Mary, E. Pascale, F. Wylam, Z.M. Nadia, and T.T.W. Patrick, Gynecol. Oncol. 66, 10–15 (1997).
(17) R.G. Peter, H.S. Yang, Q.B. Li, X.F. Ling, J.S. Wang, L.M. Yang, Y.Z. Xu, S.F. Weng, and J.G. Wu, Spectrosc. Spect. Anal. 24, 1025–1027 (2004).
(18) D.T. Li, C.J. Zhang, J. Wang, and C.G..J. Cheng, Spectrosc. Spect. Anal. 26, 2024–2026 (2006).
(19) F.S. Yang, Engineering Analysis and Application of Wavelet Transform (Beijing: Science Press, 2003), 22.
(20) L.Y. Bai and H. Liu, Proc. SPIE 6001, 83–89 (2005).
(21) L.S. Anker and P.C. Jurs, Anal. Chem. 64, 1157–1164 (1992).
(22) N. Vivechana, C.T. Jagdish, K.C. Byoung, and M.K.I. Joseph, Appl. Spectrosc. 59, 1553–1561 (2005).
Cungui Cheng and Gonglei Sun are with the Zhejiang Key Laboratory for Reactive Chemistry on Solid Surfaces, Department of Chemistry, Zhejiang Normal University, Jinhua, China. E-mail Cungui Cheng at ccg@zjnu.cn
Changjiang Zhang is with the Department of Electronics Information Engineering, Zhejiang Normal University, Jinhua, China.
AI-Powered SERS Spectroscopy Breakthrough Boosts Safety of Medicinal Food Products
April 16th 2025A new deep learning-enhanced spectroscopic platform—SERSome—developed by researchers in China and Finland, identifies medicinal and edible homologs (MEHs) with 98% accuracy. This innovation could revolutionize safety and quality control in the growing MEH market.
New Raman Spectroscopy Method Enhances Real-Time Monitoring Across Fermentation Processes
April 15th 2025Researchers at Delft University of Technology have developed a novel method using single compound spectra to enhance the transferability and accuracy of Raman spectroscopy models for real-time fermentation monitoring.
Nanometer-Scale Studies Using Tip Enhanced Raman Spectroscopy
February 8th 2013Volker Deckert, the winner of the 2013 Charles Mann Award, is advancing the use of tip enhanced Raman spectroscopy (TERS) to push the lateral resolution of vibrational spectroscopy well below the Abbe limit, to achieve single-molecule sensitivity. Because the tip can be moved with sub-nanometer precision, structural information with unmatched spatial resolution can be achieved without the need of specific labels.