Liquid Matrices for Analyses by UV-MALDI Mass Spectrometry
Data are presented for a pH-adjustable liquid UV-matrix-assisted laser desorption ionization (MALDI) matrix for mass spectrometry analysis. The liquid matrix system possesses high analytical sensitivity within the same order of magnitude as that achievable by the commonly used solid UV-MALDI matrices but with improved spot homogeneity and reproducibility. The pH of the matrix has been adjusted, achieving an on-target pH range of 3.5?8.6, which has allowed for the performance of a tryptic digest within the diluted pH-optimized liquid matrix.

Matrix-assisted laser desorption ionization (MALDI) (1,2) is one of the most used ionization techniques in mass spectrometry (MS) for the analysis of large biomolecules and has been extremely successful in fields such as proteomics (3–5). In MALDI-MS, a matrix, typically a weak organic acid such as α-cyano-4-hydroxycinnamic acid (CHCA) (6) or 2,5-dihydroxybenzoic acid (DHB) (7), is used to enable the production of stable gas-phase ions of an analyte of interest, enabling its MS analysis. Most commonly, the matrix material is dissolved in a suitable solvent and mixed with the analyte either on or off the target. Loss of the solvent on the sample target through evaporation during the sample preparation step ideally results in matrix–analyte cocrystallization. As a consequence of the subsequent MALDI process that is induced by short, focused laser pulse irradiation (typically <10 ns and <108 W/cm2 ), ablation of the solid MALDI sample leads to desorption and ionization of both matrix and analyte ions. The matrix absorbs the energy without imparting excessive internal energy to the analyte, thereby limiting fragmentation. The desorption–ionization process is essentially a thermodynamic and physicochemical process, and is best described as a fast solid-state to gas-phase transition triggered by the absorption of the laser energy by the matrix (Figure 1). This is followed by a jet expansion of the resulting gas plume into the vacuum (8–10). The exact mechanism that causes the creation of the gas-phase analyte ions is not yet fully understood, and a variety of possibilities have been proposed (8–10). The most probable route for ionization of biomolecules, such as polypeptides, is that of energy pooling through singlet–singlet annihilation. This produces free radical matrix ions (11) followed in the positive ion mode by proton transfer (8,10) between the positive matrix radical ions or resulting protonated matrix ions and the analyte molecules, thereby generating the protonated analyte ions.
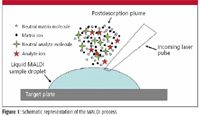
Figure 1
As expected, the matrix used in MALDI-MS has a considerable effect on the peak intensities, the relative abundance of biomolecules seen, the level of interfering ions observed, and fragmentation. Considerable work has gone into trying to define what makes a suitable matrix for MALDI. In general, however, the only steadfast rule is that the matrix molecules must absorb at the wavelength of light used and therefore absorb the energy without imparting excessive internal energy to the analyte. Other desirable qualities are vacuum stability, inertness, and the ability to generate a homologous matrix–analyte mix. In practice, most matrices cannot meet all of these requirements, so a compromise must be made based upon the application.
Compared with solid matrices, liquid matrices can have many advantages. The main advantage that a truly liquid matrix has over a solid matrix is that of homogenous sample mixing and a simple and even morphology. With a solid crystalline matrix, the analyte might not be distributed evenly throughout the crystals, the laser bores into the crystal on successive shots, or the laser desorption position needs to be changed frequently — all potentially leading to significant changes in ion signal abundances and inefficient sample consumption. Searching for "hot spots" is often required, and as each crystal is reduced in size, the distance the analyte travels increases, affecting mass resolution and accuracy. With a liquid matrix, a near-uniform surface is presented; because the liquid is self-healing and renewing, the peak abundance remains relatively stable once an equilibrium of renewal is achieved (12). This means that liquid matrices provide considerably better shot-to-shot reproducibility, as is required for quantitation (12).
Until now, one of the disadvantages of liquid matrices was the lack of sensitivity compared to traditional solid matrices, which has prevented their large-scale uptake in MALDI. In contrast to the effective crystallization process of solid matrices leading to purification and concentration of the analyte, liquid matrices are inherently disadvantaged to compete in these aspects. An attempt to counteract this, however, has been reported for a glycerol–chromophore matrix mixture (3). By diluting the matrix mixture in 50% methanol before application, a concentrating effect can be achieved as the solvents evaporate during the drying down stage on target. Liquid matrices also can be made more tolerant to contamination in biological samples without the purification effect of crystallization. With further optimization of the liquid matrix systems and their employment in MS equipment, it might be possible to alleviate these and other disadvantages even further.
Liquid matrices were first introduced in 1988 (13). Many of the early liquid matrix systems used glycerol-based suspensions (14,15) or 3-nitrobenzyl alcohol (3-NBA) as the matrix (16,17). However, mainly because of the above-mentioned disadvantage of lower sensitivity, they have been widely disregarded in favor of the crystalline matrices. Recently, liquid matrices have been reintroduced as a potential replacement for crystalline matrices. Liquid matrices basically come in one of three forms: 3-NBA, an ionic liquid, or a liquid support matrix (with a vacuum-stable support such as glycerol to either suspend or dissolve laser light-absorbing chromophores). In the last few years, research of liquid matrices for MALDI has been focused on ionic liquids that are salts with a melting point below 100 °C; are nonexplosive, nonflammable, and stable below 250 °C; and possess negligible vapor pressure (18). Ionic liquid matrices (ILMs) (19–21) usually are formed from equimolar mixtures of the commonly used organic crystalline matrices (such as DHB and CHCA) with organic bases such as aniline or amines dissolved together in an organic solvent. Removal of the solvent yields the ionic liquid. The countless combinations possible and their tunability by alteration of cation–anion content make ionic liquids well suited to the creation of tailor-made solvents. Therefore, the properties of ionic liquids make them very attractive as potential liquid matrices for MALDI. Because they are already in an ionic form, theory suggests that it should be far easier to generate ions and so increase the overall ionization of the sample. ILMs have been shown to reduce MALDI-induced fragmentation (22) and are suitable for the analysis of a variety of molecules. Furthermore, ILMs have been shown to be capable of both quantitative (22,23) and qualitative (24,25) measurements. Generally, most of the ILMs form smooth, viscous films on the target but can crystallize partially, so they do not always represent truly liquid matrices.
Other research on liquid MALDI matrices has focused on the use of a liquid, typically viscous support such as glycerol, for the creation of a potentially ionic matrix solution. This is based upon the dissolution of an acidic solid matrix in a low vapor pressure liquid through the use of an appropriate solubilization helper reagent. The solubilizing reagents tested were basic organic compounds such as 3-aminoquinoline (3-AQ), and it was shown that a 10-fold increase in the solubility of the acidic solid matrix could be achieved (26). A possible reason for the increase in solubility was thought to be ion pair formation. One of the most successful combinations found in this study was that of CHCA and 3-AQ in glycerol in a ratio of 1:4:6 (w/w/v). This matrix formulation was subsequently optimized and explored further (3,12), revealing its capability of low femtomole sensitivity, as well as stability for quantitative peptide abundance measurements and the fact that it is a truly liquid matrix (12).
In this report, we demonstrate the potential of this new generation of liquid support matrices with regard to key parameters such as analytical sensitivity, mass resolution, and accuracy, showing that these new liquid matrices are highly competitive with commonly used solid matrices. The ability to tune the pH of a liquid matrix within the range of roughly 3–9 through the addition of ammonium bicarbonate and trifluoroacetic acid without the loss of the liquid nature of the matrix or loss of analytical sensitivity is demonstrated, and we show that this pH adjustment can be used to enable the performance of a tryptic digestion within the dilute matrix solution. Because the reported liquid matrix system can be highly flexible and adaptable by dissolving appropriate additives that stay in solution homogenously, it presents a great opportunity for the tuning of physicochemical properties or, in general, the development of new applications that require a liquid rather than a solid matrix.
Experimental
All reagents unless otherwise stated were purchased from Sigma-Aldrich (Poole, UK).
Matrix Preparation
The liquid matrix was made as previously described (12). Briefly, CHCA and 3-AQ were dissolved by sonication in a 1:1 mixture of glycerol and 50% methanol–10 mM ammonium phosphate in a ratio of 1:3:5:5 (w:w:v:v). The resulting solution was then diluted 1:30 with 50% methanol–10 mM ammonium phosphate to generate the working matrix. For pH adjustment, ammonium bicarbonate (0.5 M aqueous stock solution) or trifluoroacetic acid (5% stock solution) was added to the matrix during the 1:30 dilution in replacement of some of the aqueous component to produce ammonium bicarbonate concentrations of up to 200 mM and trifluoroacetic acid concentrations of up to 0.35%.
pH Measurements
Predrying pH measurements were performed on 30 μL of the 1:30-diluted matrix stock solution using an Inlab micro pH probe (Mettler-Toledo, Leicester, UK). To emulate the usual MALDI sample preparation (drying), the volume was reduced by vacuum drying for ~4 h. Using the vacuum drying process, the volume was reduced to an approximately equal amount of the initial nondiluted matrix stock solution. Drying was deemed to be complete when vortexing no longer caused the matrix to become cloudy. A similar process can be seen with drying on target because the spot will briefly become cloudy during the drying process. The pH of this dried matrix was then taken as an approximation of the on-spot pH. This methodology could not be employed for the trifluoroacetic acid-adjusted samples because the centrifugation pressure resulted in crystallization on the leading edge. For the trifluoroacetic acid samples, the dilution was changed to 1:2.5 10% trifluoroacetic acid and 2 M ammonium phosphate so that the amounts were equal to what would have been added for the 1:30 dilution. To verify this method, the results of the unadjusted sample and a 15 mM ammonium bicarbonate sample produced by the different methods were compared.
Peptides
Table I shows the content of the stock peptide mixture used. The peptide mixture contained peptides with various masses, concentrations, and other properties. It was prepared in 0.1% trifluoroacetic acid at 10 pmol/μL with respect to Glu-fibrinopeptide b (Glu-Fib) and stored at -20 °C. For analysis, this was adjusted to 0.1% trifluoroacetic acid–0.01% octyl β-D-glucopyranoside to yield 50 fmol Glu-Fib present on target.
Enzymatic Reactions
In-matrix tryptic digestions of myoglobin were performed using a matrix solution adjusted to 60 mM ammonium bicarbonate with a pH value of ~8.4. A 20 pmol/μL-stock solution of horse heart myoglobin in 0.1% trifluoroacetic acid was used. Subsequently, a cleanup and desalting step was performed using C4 ZipTips (Millipore) following the manufacturer's guidelines. An aliquot of 100 μL of myoglobin stock solution was passed through a ZipTip and then was eluted in 10 μL of 65% acetonitrile–0.1% trifluoroacetic acid. The eluate was mixed with diluted matrix solution and the reaction was initiated with the addition of trypsin in 0.1% trifluoroacetic acid at an enzyme:protein substrate ratio of 1:20. Various dilutions with the diluted matrix solution were tested for tryptic digestion, leading to a final myoglobin concentration of 7.5, 5, and 1 pmol/μL, respectively. Aliquots of 1 μL of each reaction solution were plated out after 2.25 h for MS analysis.

Figure 2
MS Data Acquisition and Analysis
For MALDI–time of flight (TOF) MS analysis, 0.5 μL of diluted peptide standard was placed on a 400-μm AnchorChip target plate (Bruker Daltonik, Bremen, Germany) and mixed with 0.5 μL of liquid matrix solution. Initial solvent evaporation was undertaken outside the mass spectrometer at room temperature with a slight airflow until no further reduction in droplet size was observable. MS data were gathered using an Ultraflex Tof/Tof mass spectrometer (Bruker Daltonik). The instrument was calibrated between analyses using the peptide mixture at a dilution of 200 fmol/μL with the appropriate matrix under investigation. For the analysis of the effect of pH, three matrix stock solution replicates were made and diluted, as described, to generate three sets of pH-adjusted matrix solutions. Four MALDI sample spot replicates were plated out for each analyte–matrix sample as described earlier. Data were collected from the center of the spot without changing position, with a laser repetition rate between 25 and 50 Hz and a pulsed ion extraction delay of 40 ns. The first 200 shots were discarded because of the reported surface concentration effect (12). The next 500 shots were used to generate the spectrum for further analysis. Data analysis was performed using FlexAnalysis version 2.4 software (Bruker Daltonik). Peak picking was performed automatically using the SNAP algorithm.

Table I: Ratio and properties of peptides in stock solution
Results and Discussion
Analytical Sensitivity, Mass Resolution, and Mass Accuracy
In recent years, liquid MALDI matrices have been shown to be capable of high sensitivity and mass resolution comparable to that of crystalline matrices such as DHB. Figure 2 shows the high sensitivity of the liquid matrix used in this study. Ion signals resulting from an on-target loading of 3 fmol of angiotensin I and 1 fmol of Glu-Fib can be recorded easily.

Figure 3
Figure 3 shows a typical liquid MALDI mass spectrum of a standard peptide mixture (100 fmol with respect to Glu-Fib, see Experimental for details). The MS parameters were optimized for the region of m/z 1000–3000. High resolution can be observed in particular for the ACTH (II) clip 18-39 with a resolving power of more than 13,000. The resolution achievable is as expected, based upon the general performance of the instrument used. Mass accuracy is 84 ppm; again, within the expected range for measurements using external calibration.

Table II: Mascot search results for in-matrix tryptic digestions of myoglobin (2.25 h incubation)
Adjustment of Matrix pH
The liquid nature of the matrix used in this study makes the adjustment of physicochemical properties of the analyte–matrix environment possible. Here we show that this novel liquid matrix system can be adjusted within the pH range of 3–8.75 when diluted, leading to a pH range of 3.5–8.6 when dried on target without losing its liquid nature and high analytical sensitivity. The pH of the diluted matrix without pH adjustment is ~5.0 (5.7 when solvents are evaporated). Several bases and buffers have been investigated to assess their ability to alter the pH of the matrix while maintaining sensitivity and liquidity. In many cases, crystallization occurred before a significant pH increase was observed; in others, low solubility in the dried (that is, solvent-evaporated) matrix caused the formation of a two-phase liquid in which the matrix components separated during solvent evaporation, generating two distinct overlapping droplets of differing color. So far, the best buffer found as tolerable additive and effectively changing the pH is ammonium bicarbonate. A pH of 8.6 is achievable on target with an ammonium bicarbonate concentration of 200 mM in the nondried diluted matrix solution without any signs of crystallization. Crystallization has been observed at 300 mM. However, there is no significant pH increase due to the buffering nature of the ammonium bicarbonate. The pH begins to reach a plateau at 50 mM (pH 8.3). To lower the pH, trifluoracetic acid was added. A pH of 3.9 (0.3% trifluoracetic acid) has been achieved on target without any crystallization. At 0.35% trifluoracetic acid (pH 2.8 diluted matrix, 3.5 dried), some very minor crystallization was observed, but this did not appear to affect the matrix performance. As the trifluoracetic acid was increased further, more crystallization was observed, now severely reducing the matrix performance. Total crystallization was obtained at 0.5% trifluoracetic acid. The current pH range achievable for the diluted and dried matrix can be seen in Figure 4.
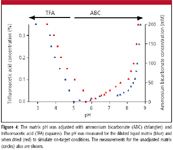
Figure 4
Peptides are zwitterionic, and the charge of a peptide in solution is determined by the pH of the solution. The solution pH at which the peptide as a whole has no charge is called isoelectric point, or pI. The peptides in the analyte mixture used have a range of pI values from 4.0 to 11.7. In Figure 5, the signal-to-noise ratios (S/N) of three of the peptides with a wide range of pI values but similar masses have been compared (bradykinin with pI 9.7, angiotensin I with pI 6.9, and Glu-Fib with pI 4.0). A graph similar to the one in Figure 5 was obtained for intensities. To compare the peptides, which are present in varying concentrations, the values have been normalized against the mean value for the unadjusted matrix at pH 5. It can be seen from Figure 5 that the pI does not significantly affect the ionization of peptides across a wide pH range with similar values for each of the peptides across the entire range. Figure 6 shows the overall performance of the matrix across the pH range. The normalized values for all six peptide peaks were averaged for the intensity and S/N achievable. Despite some minor fluctuations, the majority of values fall on the 100% line. Although the pH of the matrix does not appear to affect the ionization of these peptides, it might be important for other classes of peptides or biomolecules such as phosphopeptides or DNA and, in general, for acid- or base-labile compounds. These classes of compounds will be investigated in the future.
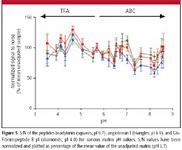
Figure 5
Tryptic In-Matrix Proteolysis
Previously, enzymatic reactions have been carried out successfully in a diluted ILM (22). Proteolytic reactions have been used as models to demonstrate the possible use of ILMs in enzyme rate and inhibition/substrate screening (25). Proteolytic reactions also form a key component in protein identification and characterization. The ability to perform tryptic digestions within the diluted liquid matrix was therefore explored. Trypsin is optimally active in the range of pH 7–9. Figure 7 shows the mass spectra gained from a 2.25-h incubation of myoglobin with trypsin in the diluted liquid matrix at 60 mM ammonium bicarbonate (pH ~8.4) at a concentration of 7.5, 5, and 1 pmol/μL myoglobin. Table II shows the results of Mascot searches of peak lists obtained from the spectra in Figure 7. At concentrations of 7.5 pmol/μL and 5 pmol/μL, 100% sequence coverage was achieved after 2.25 h and all identifications were significant. Without pH adjustment (no addition of ammonium bicarbonate), only one myoglobin peak was identified. These results clearly show that proteolysis is possible within these liquid MALDI matrix systems and that the matrix pH can be adjusted and optimized for effective enzymatic reactions.

Figure 6
Conclusion
Liquid MALDI matrices constitute a new class of potentially powerful matrices with novel properties and advantages when compared to the classic solid MALDI matrices. One of these advantages is the possible matrix pH adjustment as presented here. The pH range of 3–8.75 for the diluted matrix, resulting in an on-target pH range of 3.5–8.6, is easily achievable without the loss of the liquid nature of the MALDI sample or a significant reduction in analytical sensitivity. The pI of a peptide does not seem to exert a significant effect on its ionization across a pH range of 3–9 when analyzed in a heterogeneous peptide mixture. Tryptic digests within the liquid matrix were possible only as a result of the adjustment of pH, demonstrating the importance of pH adjustment. The presented liquid matrix system is compatible with enzymatic reactions, and we are hopeful that other reactions also will prove possible with the potential for rate calculations and substrate/inhibitor screening.
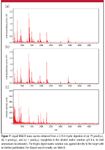
Figure 7
References
(1) M. Karas and F. Hillenkamp, Anal. Chem. 60, 2299–2301 (1988).
(2) R. Cramer and K. Dreisewerd, in The Encyclopedia of Mass Spectrometry, M.L. Gross and R.M. Caprioli, Eds. (Elsevier, Amsterdam, 2007), pp. 646–661.
(3) R. Cramer and S. Corless, Proteomics 5, 360–370 (2005).
(4) R. Cramer, J. Gobom, and E. Nordhoff, Expert Rev. Proteom. 2, 407–420 (2005).
(5) R. Aebersold and M. Mann, Nature 422, 198–207 (2003).
(6) R.C. Beavis, T. Chaudhary, and B.T. Chait, Organic Mass Spectrom. 27, 156–158 (1992).
(7) K. Strupat, M. Karas and F. Hillenkamp, Int. J. Mass Spectrom. IonProcesses 111, 89–102 (1991).
(8) R. Knochenmuss and R. Zenobi, Chem. Rev. 103, 441–452 (2003).
(9) M. Karas, M. Glückmann, and J. Schafer, J. Mass Spectrom. 35, 1–12 (2000).
(10) M. Mormann, S. Bashir, P.J. Derrick, and D. Kuck, J. ASMS 11, 544–552 (2000).
(11) H.C. Lüdemann, R.W. Redmond and F. Hillenkamp, Rapid Commun. Mass Spectrom. 16, 1287–1294 (2002).
(12) M. Palmblad and R. Cramer, J. Am. Soc. Mass Spectrom. 18, 693–697 (2007).
(13) K. Tanaka, H. Waki, Y. Ido, S. Akita, and Y. Yoshida, Rapid Commun. Mass Spectrom. 2, 151–153 (1988).
(14) J. Sunner, E. Dratz, and Y.C. Chen, Anal. Chem. 67, 4335–4342 (1995).
(15) M.J. Dale, R. Knochenmuss, and R. Zenobi, Anal. Chem. 68, 3321–3329 (1996).
(16) S. Zhao, K.V. Somayajula, A.G. Sharkey, D.M. Hercules, F. Hillenkamp, M. Karas, and A. Ingendoh, Anal. Chem. 63, 450–453 (1991).
(17) L. Li, A.P.L. Wang, and L.D. Coulson, Anal. Chem. 65, 493–495 (1993).
(18) P. Wasserscheid and W. Keim, Angewandte Chemie-International Edition 39, 3773–3789 (2000).
(19) D.W. Armstrong, L.K. Zhang, L.F. He, and M.L. Gross, Anal. Chem. 73, 3679–3686 (2001).
(20) M. Zabet-Moghaddam, E. Heinzle, and A. Tholey, Rapid Commun. Mass Spectrom. 18, 141–148 (2004).
(21) M. Zabet-Moghaddam, R. Kruger, E. Heinzle, and A. Tholey, J. Mass Spectrom. 39, 1494–1505 (2004).
(22) M. Mank, B. Stahl, and G. Boehm, Anal. Chem. 76, 2938–2950 (2004).
(23) L.S. Santos, R. Haddad, N.F. Hoehr, R.A. Pilli and M.N. Eberlin, Anal. Chem. 76, 2144–2147 (2004).
(24) Y.L. Li and M.L. Gross, J. ASMS 15, 1833–1837 (2004).
(25) A. Tholey, M. Zabet-Moghaddam, and E. Heinzle, Anal. Chem. 78, 291–297 (2006).
(26) E.T.P. Sze, T.W.D. Chan, and G. Wang, J. ASMS 9, 166–174 (1998).
Mark Towers and Rainer Cramer are with The BioCentre and Department of Chemistry, The University of Reading, Whiteknights, UK. Address all correspondence to r.k.cramer@reading.ac.uk

Smarter Sensors, Cleaner Earth Using AI and IoT for Pollution Monitoring
April 22nd 2025A global research team has detailed how smart sensors, artificial intelligence (AI), machine learning, and Internet of Things (IoT) technologies are transforming the detection and management of environmental pollutants. Their comprehensive review highlights how spectroscopy and sensor networks are now key tools in real-time pollution tracking.
AI Shakes Up Spectroscopy as New Tools Reveal the Secret Life of Molecules
April 14th 2025A leading-edge review led by researchers at Oak Ridge National Laboratory and MIT explores how artificial intelligence is revolutionizing the study of molecular vibrations and phonon dynamics. From infrared and Raman spectroscopy to neutron and X-ray scattering, AI is transforming how scientists interpret vibrational spectra and predict material behaviors.
Real-Time Battery Health Tracking Using Fiber-Optic Sensors
April 9th 2025A new study by researchers from Palo Alto Research Center (PARC, a Xerox Company) and LG Chem Power presents a novel method for real-time battery monitoring using embedded fiber-optic sensors. This approach enhances state-of-charge (SOC) and state-of-health (SOH) estimations, potentially improving the efficiency and lifespan of lithium-ion batteries in electric vehicles (xEVs).