Exoscan FT-IR Instrument System Can Easily be Used in the Lab or Taken to the Field for Routine Analysis
Infrared spectroscopy has long been recognized as a selective and sensitive technique for analysis and characterization of surfaces. From material identification to quantitative analysis, infrared analyses can establish if a surface is composed of the correct material, has the proper coating thickness, is free of contaminants, is properly cured, or has the correct properties for the next step in a manufacturing process.
Infrared spectroscopy has long been recognized as a selective and sensitive technique for analysis and characterization of surfaces. From material identification to quantitative analysis, infrared analyses can establish if a surface is composed of the correct material, has the proper coating thickness, is free of contaminants, is properly cured, or has the correct properties for the next step in a manufacturing process. With these analytical abilities, infrared spectroscopy could easily be used for qualification of materials and surfaces on very large objects. However, with current bench top infrared spectrometers, it is often necessary to remove a sample from a large object and bring the small piece to the spectrometer located in the laboratory. Thus, a potentially non-destructive methodology for large objects becomes a destructive one due to the necessity of small sample size coupled with the location of the FT-IR system.
Times have changed, though. Now portable, handheld FT-IR spectrometers are available which can be used for true non-destructive analysis of large surfaces. An example of this type of instrument is A2 Technologies' Exoscan™ , which can conduct non-destructive surface measurements on a variety of samples. Though size and portability is important for these applications, equally important is overall spectroscopic performance since surface measurements can be very demanding. Exoscan has a performance envelope equivalent or better than analytical bench top systems. The recent addition of interchangeable sample interfaces and a docking station provides a system that can easily be used for experimental methods and procedures in the lab, then taken to the field for routine analysis when needed.
Sample Interfaces
The Exoscan (see Figure 2a) can measure surface samples with three different techniques: attenuated total reflectance (ATR), specular reflectance (reflectance) and grazing angle reflectance (grazing angle). The three interchangeable sample interfaces are shown in Figure 1. The three techniques provide a wide variety of options for many different sample types.
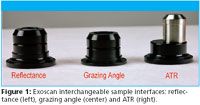
Figure 1
The ATR interface is ideal for the analysis of solids, liquids, pastes and gels. The interface is comprised of a diamond window, which makes it impervious to corrosion and scratching. The sample is brought into contact with the diamond window. A pressure device allows compression of the sample to ensure optimum contact for analysis. ATR is a surface technique and only the top 2–3 microns are analyzed.
The specular reflectance interface allows the analysis of films and coatings on reflective metal surfaces such as aluminum or steel. The angle of incidence is 45°. The infrared energy either passes completely through the sample before being reflected by the substrate, or the energy is reflected off the front surface of a smooth sample. One particularly useful application of the reflectance technique is determining the thickness of coatings on metal surfaces.
The grazing angle reflectance interface is similar in concept to the specular reflectance interface. It differs in the angle of incidence. The Exoscan grazing angle has a nominal angle of 82°. The high throughput optic system yields over 80% throughput, producing excellent signal to noise even on short measurements. In addition to the increased path length, grazing angle reflectance shows additional sensitivity compared to a typical specular reflectance measurement. The increase in sensitivity is due to enhancement of the electric field of the p-polarized light at the surface. The grazing angle is ideal for the analysis of very thin (sub-micron) films, such as trace contamination on reflective metal surfaces.
Exoscan Docking Station
In addition to the multiple sample interfaces available, a docking station is also available for the Exoscan. The docking station converts the hand held Exoscan into a bench top instrument as well as providing facility for battery charging and data retrieval. The docking station, shown in Figure 2b, allows development of methods by collecting data on representative samples before taking the instrument out to the field. Collection of the calibration data on the same instrument produces the best quality calibration. Furthermore, it allows one instrument to be used for both method development and in field analysis or troubleshooting.
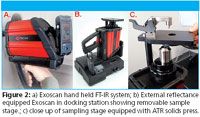
Figure 2
Measurement of Contaminants Using the Exoscan
Adhesive bonding provides strong, reliable attachment between similar and dissimilar materials; however, the ultimate strength is often determined by the cleanliness of the two surfaces which are being bonded. To guarantee strong bonding, surfaces should be analytically tested to confirm their cleanliness before application of adhesives. The testing technique should be sensitive to many types of contamination at very low levels. Infrared spectroscopy with a grazing angle sample interface provides a sensitive, universal technique for measuring contamination on metal surfaces; the Exoscan with the grazing angle sample interface allows measurement of large bonding surfaces, making it a truly non-destructive technique.
All infrared spectrometers, including the Exoscan, are sensitive to many different organic and inorganic contaminants. Figure 3 shows spectra obtained with the Exoscan of a thin layer of hydrocarbon oil and a thin layer of silicone, each on an aluminum surface. As can be seen from the spectra, the Exoscan can easily distinguish different types of contaminants, allowing the user to select the proper cleaning procedure to remove the contaminant.
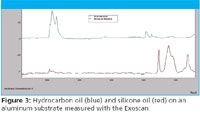
Figure 3
In addition to detecting multiple samples, determination of bond area cleanliness also requires very sensitive detection. Bonding issues are often seen contamination as low as 1 μg/cm2 . Furthermore, the amount of contamination present is important to determine the extent of further cleaning required.
A quantitative calibration to measure the concentration of a silicone contaminant (Frekote™ Mold Release) on aluminum plates was developed. Concentrations from 1.6 to 8.8 μg/cm2 of the silicone on aluminum plates were prepared by spray coating, and then measured with the grazing angle Exoscan. The spectra were collected at 8 cm–1 resolution, collecting 32 scans for a total collection time of 10 seconds. The spectra and a calibration curve using the Si-O band at 1265 cm–1 are shown in Figure 4. The limit of detection for this method was estimated using the band area equivalent to three times (3X) the baseline noise; the LOD was found to be 0.17 μg/cm2 . The LOD could be further increased by using longer measurement times.
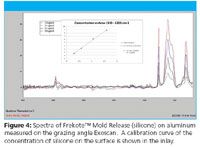
Figure 4
The Exoscan was designed to provide easy to understand answers for both skilled and unskilled users. The spectra shown above and are informative for a skilled user to determine the amount and type of signal present, but the successful use of the Exoscan in field applications requires that the results be presented in a simplified form. The calibration curve developed above was entered into the Exoscan's Microlab Mobile software along with predetermined limits allowing the results to be color coded (red, yellow or green). Thus an operator can visually quickly determine whether a particular analyses is within specification. Figure 5 shows an example of this simplified readout which can be used for field use.
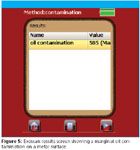
Figure 5
Conclusion
High performance, hand-held, portable FT-IR spectrometer provides true non-destructive surface analysis for a wide range of large objects. The Exoscan uses a variety of interchangeable sampling interfaces to accommodate many different sample types; its versatility provides value in both the laboratory and field settings. The system using the grazing angle sample interface has been shown to be effective for determining low concentrations of contaminants on bonding surfaces.
A2 Technologies
14 Commerce Drive, Danbury, CT 06810
Tel. (203) 312-1100, Fax (203) 312-1058

Thermo Fisher Scientists Highlight the Latest Advances in Process Monitoring with Raman Spectroscopy
April 1st 2025In this exclusive Spectroscopy interview, John Richmond and Tom Dearing of Thermo Fisher Scientific discuss the company’s Raman technology and the latest trends for process monitoring across various applications.
A Seamless Trace Elemental Analysis Prescription for Quality Pharmaceuticals
March 31st 2025Quality assurance and quality control (QA/QC) are essential in pharmaceutical manufacturing to ensure compliance with standards like United States Pharmacopoeia <232> and ICH Q3D, as well as FDA regulations. Reliable and user-friendly testing solutions help QA/QC labs deliver precise trace elemental analyses while meeting throughput demands and data security requirements.