A Fast, Accurate, Speciation-Capable, Automated, and Green Gas-Phase Chemiluminescence Approach for Analyzing Waterborne Arsenic
Special Issues
This cost-effective approach has a limit of detection well below 1µg As/L and a linear range that extends to >100 µg As/L.
This article describes a cost-effective and sensitive approach for quantifying waterborne arsenic based on gas-phase chemiluminescence. The approach centers on the use of photometric instruments-one configured for laboratory use and one field-deployable version-that can quantify total arsenic as well as individually measure As(III) and As(V). The regulatory limit for arsenic in drinking water is 10 μg/L. The limits of detection of the gas-phase chemiluminescence instruments are well below 1 μg As/L and the linear range extends to >100 μg As/L. Total arsenic analysis using this approach requires 3 min.
Arsenic in drinking water is a serious issue in many parts of the world (1). Arsenic is a Class A human carcinogen, and it can lead to skin, bladder, lung, and prostate cancer (2). It has also been linked with respiratory, reproductive, developmental, immunological, and neurological defects (2).
The maximum permissible level of arsenic in drinking water, according to the World Health Organization as well as the United States Environmental Protection Agency (US EPA), is 10 μg/L. However, such a standard is presently too stringent to be met in many places in the world; in India, Bangladesh, Taiwan, China, and Vietnam, the current limit is 50 μg/L (3). Arsenic is the 20th most abundant crustal element; the presence of arsenic in groundwater is common. The Trace Elements National Synthesis Project of the United States Geological Survey has created a map of groundwater arsenic distribution in the United States (4); high (50 μg/L) levels of arsenic in groundwater exist in many locations. A recent publication has also reported increased occurrence of elevated arsenic levels in groundwater after local hydraulic fracturing activities in the Barnett Shale area of Texas (5).
Present US EPA-approved detection methods are all based on atomic spectrometry, and “approved” methods must be used for regulatory reporting. For non-regulatory testing, any method may be used, but it is beneficial if the method or instrument performance has been verified by the US EPA Environmental Technology Verification program. One stripping voltammetric analyzer has undergone such verification, but electrochemical analyzers often suffer from electrode fouling, making standard addition a necessity; even traces of copper present can be a problem (6). Other reports have indicated the high degree of expertise needed to obtain reliable results with electrochemical analyzers (7). On the other hand, atomic spectrometry–based instruments are bulky, expensive and require large amounts of pure gas in addition to expensive consumables. Moreover, such instruments cannot be used in the field.
Field analysis is extremely important considering the temporal changes in arsenic concentrations at various sampling sites and the uncertainty that always surrounds the integrity of a sample preserved in the field. Currently commercially available field assays are based on the Gutzeit method (8), which involves generation of arsine (AsH3), filtering through lead acetate paper to trap any hydrogen sulfide formed, and capturing the arsine on a mercuric bromide-soaked paper to induce a yellow coloration. Arsine that is produced can escape from the device, thus posing a health hazard (9). The less expensive instruments use comparison with a color chart for stepwise quantification; color degradation in sunlight and operator judgment can be factors (10). Undesirable aspects of methods involving those instruments include the use of large sample volumes, a corresponding amount of acid, and lead and mercury compounds that generate toxic waste.
A field-usable instrument must be robust and easy to operate. Other important factors are reproducibility, capital and consumable cost, the ability to differentiate inorganic As(III) and As(V) (which differ considerably in their ease of removal and acute toxicity), and environmental friendliness. In the past, work in our laboratory demonstrated the principles of a gas-phase chemiluminescence-based arsenic analyzer (11). This article describes the use of prototype laboratory-based and field-deployable gas-phase chemiluminescence analyzers developed in our laboratory to perform simple, fast, environment-friendly, and fully automated analysis of waterborne arsenic. The instruments measure total arsenic or As(III) (with As(V) by difference), or As(III) and As(V) sequentially. Other configurations currently in development in our laboratory include in-line continuous process instruments and remotely deployed autonomous instruments.
ExperimentalExperimental Reagents
Standard 1000-mg/L stock solutions of As(III) and As(V) were prepared using arsenic trioxide and sodium arsenate heptahydrate, respectively. Working solutions were prepared by serial dilution with deionized water (18 MΩ cm-1) generally immediately before use. For hydride generation, 4.8% (w/v) sodium borohydride (NaBH4) (98%) was prepared in 0.5 M sodium hydroxide and 1 mM disodium ethylenediamine tetraacetate (Na2EDTA). For sequential analysis of As(III) and As(V), citrate buffer (pH 4.5) was used. Citrate buffer (pH 4.5) was prepared by adding sodium hydroxide pellets to 1 M citric acid and then making fine adjustments with 2 M sodium hydroxide. In this approach, 1 mL of citrate buffer is added to the sample followed by 0.5 mL of the sodium borohydride reagent. For the subsequent As(V) measurement, another 0.5 mL aliquot of sodium borohydride is added, followed by 1 mL of 6.0 M sulfuric acid (H2SO4).
Instrumentation
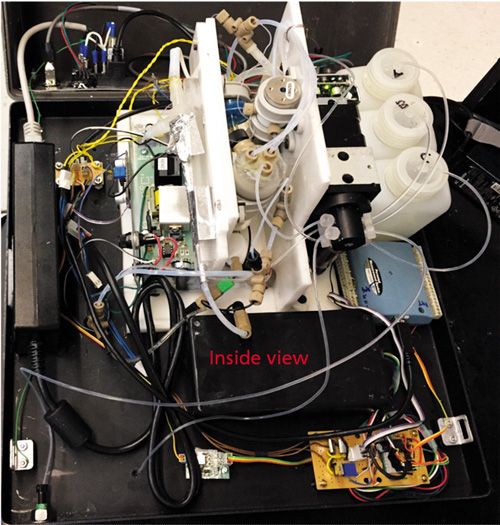
A basic schematic of the instrument is shown in Figure 1. Figure 2 shows an inside view of the laboratory instrument. The laboratory and field-deployable instruments both are fully automated. All liquid handling is conducted by a syringe pump (designated as “SP” in Figure 1) connected to a multiport distribution valve (DV). The laboratory setup has an eight-port distribution valve, and the portable instrument has a six-port distribution valve. The distribution valve ports are respectively connected to a sample container, a waste bottle, a reaction chamber (RC), and reservoirs respectively containing solutions of sodium borohydride, sulfuric acid, citrate buffer, and water. One port of the distribution valve in the laboratory instrument is left unused and vented to the atmosphere. With the field instrument, one of the ports of the six-port distribution valve is connected to the common port of a three-way solenoid valve to effectively create a seven-position valve. The normally open and normally closed ends of the solenoid valve are connected to reservoirs containing solutions of sulfuric acid and citrate buffer, respectively. The temporal operational sequence, aspiration-dispense volumes, and aspiration-dispense velocities are programmable. The reaction chamber (RC) is a 20-mL cylindrical chamber made of poly(methyl methacrylate) (PMMA), the bottom of which is connected to a tube that drains to waste via a normally closed solenoid valve (SV1). Three fluid lines enter through the top of the reaction chamber. One of the tubes reaches the bottom of the reaction chamber and carries all the liquid delivered by the syringe pump. A second line reaches to a point inside the reaction chamber that is just above the maximum fill volume of the reaction chamber in operation such that the headspace can be swept. It forms an air delivery line that comes from a three-way solenoid valve (SV2), and passes through a flow restriction tube (R2) (PTFE, 0.30 mm i.d., 68 cm long). The third fluid line entering the reaction chamber is a gas exit line and terminates at the top. It goes to a third solenoid valve (SV3), identical to SV2. The flow restrictors, R1 and R2, join at a tee (T), which splits the output of an air pump. The other side of the tee goes through restrictor tube R1 (PTFE, 0.30-mm i.d., 34 cm long) and through an ozone generator. The ozone generator consists of two concentric glass tubes placed inside a polypropylene tee. The inner glass tube (0.7 mm i.d., 2 mm o.d., 16 cm long) is sealed at both ends and contains a nichrome wire (0.5 mm thick, 16.5 cm long) that serves as the high-voltage anode. The outer surface of the other glass tube (4 mm i.d., 6.2 mm o.d., 10 cm long) is wrapped with aluminum foil, and it serves as a cathode. The optimized flow rates were 60 mL/min through ozone generator and 30 mL/min for the headspace flush flow. The output of the ozone generator and the output line of the reaction chamber from the third solenoid valve (SV3) terminate in a polypropylene tee on top of the chemiluminescence chamber (CC). The chemiluminescence chamber is fabricated from the bottom ~5-cm portion of a 12-mm i.d. glass test tube. It is silvered on the exterior with a commercial silvering solution and then painted black repeatedly with black epoxy-based paint.
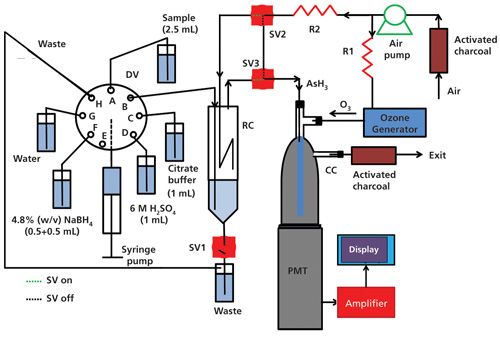
The bottom of the test tube is closed by covering it with a 0.15-mm-thick, 25-mm-square microscope cover glass. A hole (3 mm) is drilled into the top of the dome. The tee assembly is then cemented using epoxy adhesive. The tee assembly has a glass tube (1.7 mm i.d., 3.0 mm o.d., 4.6 cm long) attached to it at the bottom, and it carries both ozone and arsine to the bottom of the chemiluminescence chamber so that they have sufficient time to react and produce chemiluminescence. The length of the PTFE tube carrying arsine inside the chemiluminescence chamber can be changed by either pulling it out or pushing it inside the glass tube. Another hole (1 mm) is drilled near the top to serve as the gas exit and it leads to a vent cartridge containing granular activated charcoal to catalytically destroy any excess ozone in the exit stream. The volume of the chemiluminescence cell is ~5.5 cm3. All the conduits leaving and entering the chemiluminescence chamber were opaque black PTFE tubes (1.1-mm i.d.). The chemiluminescence chamber is mounted on top of a miniature photomultiplier tube (PMT). The PMT along with the chemiluminescence chamber is placed in a plastic opaque black box so that there is no interference from room light. The output of the PMT was further amplified using a secondary two-stage operational amplifier. The overall gain is 1000 × with a time constant of 1 s.
For the laboratory instrument, the data were acquired on a 12-bit USB data acquisition card using LabVIEW (National Instruments)-based software developed in-house. The LabVIEW program also triggers the operational sequence of the syringe pump and the opening of the of the solenoid valves through the digital outputs of the same data acquisition card. The final results are displayed on a laptop computer. The operational sequence of the portable instrument was controlled by a microcontroller and the results were displayed on a color multitouch liquid crystal display panel.
Operational Sequence
The typical operational sequence for total arsenic estimation for both instruments is similar, as follows:
1. Aspirate 2.5 mL of sample and dispense it to the reaction chamber.
2. Aspirate 0.5 mL of sulfuric acid and dispense it to the reaction chamber.
3. Aspirate 1 mL of water and dispense it to the waste reservoir. Repeat this step four times to rinse and clean the syringe.
4 Aspirate 0.5 mL of sodium borohydride solution and dispense all of it to the reaction chamber.
5. Wait for 30 s to allow the arsine gas to accumulate at the headspace of the reaction chamber.
6. Open the solenoid valve SV3.
7. After 2 s, open the solenoid valve SV2 and record the signal height for 60 s. This step allows the air to purge all the arsine gas out of the reaction chamber.
8. Close solenoid valve SV3 and open solenoid valve SV1 to allow the contents of the reaction chamber to drain off.
9. Close solenoid valves SV1 and SV2.
10. Aspirate 2.5 mL of water and dispense it to the reaction chamber. Repeat this step one more time so that the reaction chamber is flushed with 5 mL of water.
11. Open solenoid valves SV1 and SV2 so that the contents are drained out.
12 Close solenoid valves SV1 and SV2.
The software converts the recorded signal height into the amount of the total arsenic using a calibration curve and displays it on-screen. The complete cycle takes ~3 min. For the laboratory setup, the operational protocol for the sequential analysis of As(III) and As(V) is as follows:
1. Aspirate 2.5 mL of sample and dispense it to the reaction chamber.
2. Aspirate 1 mL of citrate buffer and dispense it to the reaction chamber.
3. Aspirate 1 mL of water and dispense it to the waste reservoir. Repeat this step four times to rinse and clean the syringe.
4. Aspirate 0.5 mL of sodium borohydride solution and dispense all to the reaction chamber.
5. Wait for 30 s to allow the arsine gas to accumulate at the headspace of the reaction chamber.
6. Open the solenoid valve SV3.
7. After 2 s, open the solenoid valve SV2 and record the signal height for 60 s. This measurement gives the signal height for As(III) species.
8. Aspirate 1 mL of water and dispense to the waste. Repeat this step four times to rinse the syringe.
9. Aspirate 1 mL of sulfuric acid and dispense to the reaction chamber.
10. Aspirate 1 mL of water and dispense it to the waste. Repeat this step four times.
11. Aspirate 0.5 mL of sodium borohydride solution and dispense all to the reaction chamber.
12. Wait for 30 s to allow the arsine gas to accumulate.
13. Open solenoid valve SV3.
14. After 2 s open solenoid valve SV2 and record the signal height for 60 s. This measurement gives the signal height for the As(V) species.
15. Close solenoid valve SV3 and open solenoid valve SV1 to allow the contents of the reaction chamber to drain off.
16. Close solenoid valves SV1 and SV2.
17. Aspirate 2.5 mL of water and dispense to the reaction chamber. Repeat this step one more time so that the reaction chamber is flushed with 5 mL of water.
18. Open solenoid valves SV1 and SV2 so that the contents are drained out.
19. Close solenoid valves SV1 and SV2.
As mentioned before, in the case of the portable field instrument the syringe pump is connected to a six-port distribution valve and one of the ports of the six-port distribution valve is connected to the common port three-way solenoid valve. While working in the sequential analysis mode, this valve should be energized before step 1, so that the citrate buffer is connected to the distribution valve and de-energized after step 4. The signal heights for As(III) and As(V) are then fed into the corresponding calibration curves to obtain the amount of the respective As species. The time required for one complete sequential analysis is about 6 min.
Results and Discussion Parametric Optimization Ozone Flow Rate. The air flow rate through the ozone generator was optimized at 60 mL/min, and the ozone produced at this flow rate was measured iodometrically to be 0.25% v/v. At lower flow rates the ozone concentration decreased, and at increased flow rates the amount of ozone produced was diluted. The ozone generator was operated at a duty cycle of about 30%. Increasing the duty cycle resulted in excessive heat generation, which reduced the ozone concentration.
Prereaction. The chemiluminescence from the arsine-ozone reaction is not instantaneous and needs some finite amount of time to reach a maximum. Hence, the chemiluminescence signal intensity was optimized by varying the length of the black PTFE tube carrying arsine inside the chemiluminescence chamber. The chemiluminescence signal intensities are at a maximum when the PTFE tube has been withdrawn 4.1 cm from the tip of the glass tube, so that only 0.5 cm of it is inside the glass tube.
Air purge flow rate. With addition of sodium borohydride in the reaction chamber, about 50 mL of hydrogen is also evolved along with arsine, and this hydrogen can be used to purge the reaction chamber. However, when the reaction chamber was purged with air at a flow rate of 30 mL/min, the signal intensities reached their maximum. Increasing the flow rate further decreased the signal intensity by diluting the arsine. The same air purge also helps to drain out the contents of the reaction chamber quickly.
Accumulation time. Reduction of As(V) to arsine was observed to be slower than the reduction of As(III). This difference in reduction rate resulted in a significant difference in chemiluminescence signal heights of the two species. To overcome this signal height difference, the solenoid valves SV2 and SV3 were kept closed for 30 s after the addition of sodium borohydride, and arsine gas was allowed to accumulate and then was released into the chemiluminescence chamber as a pulse. With an accumulation time > 30 s, the signal intensities for As(V) and As(III) became essentially equal.
Total Arsenic Determination
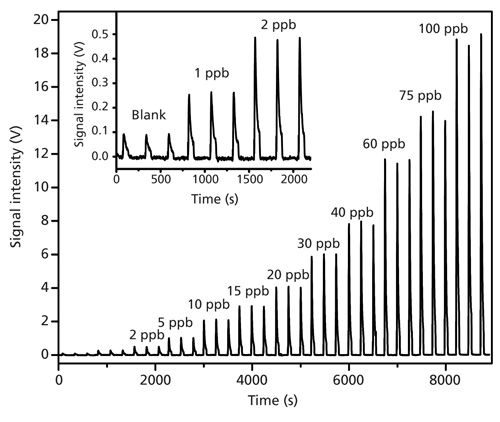
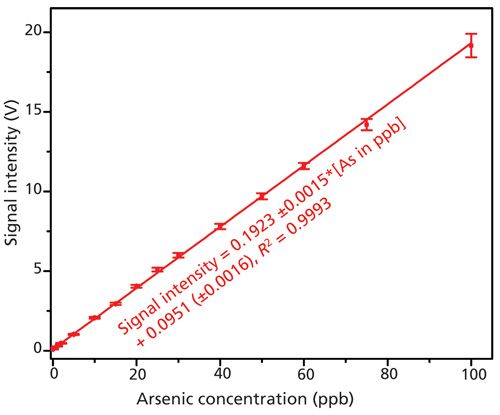
The results with As(III) standards in the concentration range 1–100 μg/L are shown in Figure 3. The inset figure shows the comparison of the blank readings with 1 and 2 μg/L of total arsenic. The blank readings show a chemiluminescence signal intensity of 0.067 ± 0.001 V, which resulted from the As present as an impurity in the sulfuric acid. As mentioned above, under strongly acidic conditions (pH ≥ 1), both As(III) and As(V) are very efficiently converted to arsine. With an accumulation time of 30 s, the As(III) and As(V) chemiluminescence signals are indistinguishable. Hence, either As(III) or As(V) standards can be used as calibrant for total As assays. The peak height and the peak area both produce a linear response in the range of interest (1–100 μg/L). For ease and simplicity, peak height has been plotted to obtain the following calibration curve:
Peak height, V = 0.1923(±0.0015),
total As (μg/L) + 0.0675(±0.0016) [1]
r2 = 0.9992
The corresponding calibration data for total arsenic measurement are shown in Figure 4. For a 2.5-mL sample, the limit of detection (LOD) (for S/N = 3) based on the standard deviation of the blank is estimated to be 0.03 μg/L.
Sequential Arsenic Analysis
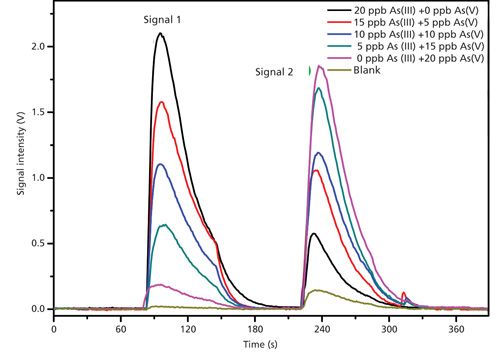
Both the laboratory instrument and the field instrument can measure As(III) and As(V) separately. Operating first at pH 4.5, the response is mostly from As(III) with a small response from As(V). Subsequent strong acid measurement of this sample results in a response that is predominantly from As(V) with a small response from residual unreacted As(III). The software then solves the relevant bivariate calibration equation to produce the final results. The actual response data from different mixtures of As(III) and As(V) are shown in Figure 5. The relevant bivariate equations (signal representing peak height) are as follows:
As(III), μg/L = 9.74*signal 1,
volts - 0.887*signal 2, volts [2]
As(V), μg/L = -1.35*signal 1,
volts + 10.6*signal 2, volts [3]
Interference Studies
It is well known that ozone produces chemiluminescence with many volatile gases. However, compared to the chemiluminescence from arsine, most of the volatile gases produce weak chemiluminescence. Idowu and colleagues (11) have previously shown that under the above test conditions this approach does not suffer from significant interferences from other common waterborne species, including bicarbonate, nitrate, sulfate, and, notably, sulfide. They also tested various tap water samples and other samples and carried out a blind intercomparison with the U. S. Geological Survey. Results from the gas-phase chemiluminescence technique were in very good agreement with those obtained with benchmark techniques, notably graphite furnace atomic absorption spectrometry (GFAAS) and liquid chromatography–ion chromatography–inductively coupled plasma–mass spectrometry (LC–IC–ICP-MS).
Conclusion and Future Scope
Arsenic-contaminated drinking water is a serious issue, not only in developing countries but also in industrialized nations. The widespread use of hydraulic fracturing is only likely to exacerbate this problem. Globally about 140 million people are affected by arsenic poisoning. The need to develop better, cost-effective, field-deployable instruments for speciated arsenic analysis is a real societal issue in places that can least afford expensive instrumentation. We have described here the use of a fully automated, extremely sensitive instrument that can be assembled at modest cost and thus can potentially replace test kits that use toxic mercury and lead compounds. It will provide regulatory bodies with more elaborate data and a better understanding of arsenic levels to make better informed and accurate decisions.
Visible luminescence from the arsine–ozone reaction is highly selective and sensitive, and has been known for a long time (12,13). If all the automated fluid handling were omitted and the instrument could still provide accurate quantification near the regulatory limit of 10 μg/L as has already been proven (14), one would have an even more affordable instrument for measuring arsenic in the field and could do so more rapidly and more accurately than possible with currently available technologies. Future work involves development of an instrument that can be used for industrial purposes based on continuous electrochemical reduction of arsenic to arsine, which would help monitor arsenic levels in large-scale continuous-flow operations.
Acknowledgment
This work was supported by the National Science Foundation grant PFI: AIR-TT IIP-1414383. We thank Scott Evans of Lumion Laboratories, Inc., for market research.
References
(1) M.K. Sengupta, A. Mukherjee, M.A. Hossain, S. Ahmed, M.M. Rahman, D. Lodh, U.K. Chowdhury, B.K. Biswas, B. Nayak, B. Das, K. C. Saha, D. Chakraborti, S. C. Mukherjee, G. Chatterjee, S. Pati, R. N. Dutta, and Q. Quamuzzaman, Arch. Environ. Health58, 701–702 (2003).
(2) M.M. Karim, Water Res.34, 304–310 (2000).
(3) J. Nriagu, P. Bhattacharya, A. Mukherjee, J. Bundschuh, R. Zevenhoven, and R. Loeppert (Eds.), Arsenic in Soil and Groundwater Environment (Elsevier, Amsterdam, 2007), pp. 3–60.
(4) United States Geological Survey. National Water Quality Assessment. http://water.usgs.gov/nawqa/trace/arsenic.
(5) B.E. Fontenot, L.R. Hunt, Z.L. Hildenbrand, D.D. Carlton Jr., H. Oka, J.L. Walton, D. Hopkins, A. Osorio, B. Bjorndal, Q.H. Hu, and K.A. Schug, Environ. Sci. Technol. 47, 10032–10040 (2013).
(6) J.A. Gomesa, D. Cocke, S. Varma, H. Morenoa, and E. Peterson, ECS Trans.2(14), 57–70 (2007).
(7) J. Feldmann, Rev. Environ. Contam. Toxicol.197, 61–76 (2008).
(8) H. Gutzeit, Pharmaz. Zeitung.24, 263 (1879).
(9) A. Hussam, M. Alauddin, A.H. Khan, S.B. Rasul, and A.K. Munir, Environ. Sci. Technol.33, 3686–3688 (1999).
(10) D.G. Kinniburgh, and W. Kosmus, Talanta8, 165–180 (2002).
(11) A.D. Idowu, P.K. Dasgupta, Z. Genfa, and K. Toda, Anal. Chem.78, 7088–7097 (2006).
(12) K. Fujiwara, Y. Watanabe, K. Fuwa, and J.D. Winefordner, Anal. Chem.54, 125–128 (1982).
(13) M.E. Fraser, D.H. Stedman, and M.J. Henderson, Anal. Chem.54, 1200–1201 (1982).
(14) M.K. Sengupta, Z.A. Hossain, S.I. Ohira, and P.K. Dasgupta, Environ. Pollut. 252–257(2010).
Purnendu K. Dasgupta and Arup K. Ghosh are with the Department of Chemistry and Biochemistry at the University of Texas at Arlington in Arlington, Texas. Aditya N. Das is with the University of Texas at Arlington Research Institute in Fort Worth, Texas. Please direct correspondence to: dasgupta@uta.edu

New Study Reveals Insights into Phenol’s Behavior in Ice
April 16th 2025A new study published in Spectrochimica Acta Part A by Dominik Heger and colleagues at Masaryk University reveals that phenol's photophysical properties change significantly when frozen, potentially enabling its breakdown by sunlight in icy environments.