Fourier-Transform Molecular Rotational Resonance Spectroscopy: Bridging the Gap Between Spectroscopy and Chromatography for VOC Analysis
Special Issues
This study demonstrates the strengths of FT-MMR for simple, direct analysis of VOCs and other toxic industrial chemicals.
The connection of a quantum spectral fingerprint to molecular structure makes spectroscopy ideal for chemical detection. Even with the broad utility of chromatography and mass spectrometry, there is still a rigor to expand the applicability of high-resolution spectroscopy by miniaturizing Fourier transform nuclear magnetic resonance (FT-NMR) spectroscopy and enhancing the performance of mid-infrared (IR) techniques. While IR instrumentation experts have been incorporating the latest diode lasers, molecular rotational resonance (MRR) spectroscopists have designed a digital, solid-state approach to reach sub-terahertz (millimeter-submillimeter-wave) molecular spectroscopy from the radio regime. Recent innovations for FT-MRR techniques have finally brought millimeter–wave spectroscopy into the modern age. FT-MRR spectroscopy is applied here to gas analyses, air analysis, and headspace analysis for sensitive, chemically specific detection of volative organic compounds (VOCs) without the need for lasers, chemometrics, or chromatography.
Acting under federal acts for pollution control (1–4), the United States Environmental Protection Agency (US EPA) sets standards for the United States environmental footprint based on health risk assessments (5) that have increased the need to monitor more chemicals at lower levels. Although the EPA publishes compendiums of reliable methods for chemical analysis to measure trace-level toxins (6,7), they are not necessarily cost effective or compatible with the expertise available to meet the reporting demand. Since the public is the primary stakeholder of the EPA, the level of involvement of the commercial industry in setting regulatory standards has traditionally been limited. However, the EPA has made strides to collaborate with public and industrial stakeholders recognizing the need to modernize the method specific approach to standardization that is too slow to keep up with new technology (8–10). These efforts lay a path to ease the analytical burden and increase the data gathering potential. In this article, we demonstrate the performance of a new high-resolution spectroscopy technique to add to the environmental analysis suite at the benchtop or in the field: Fourier transform molecular rotational resonance (FT-MRR) spectroscopy.
To achieve accurate results, the current EPA methods for volatile organic compound (VOC) analysis detail extensive sample preparation and separation strategies that require hours of turnaround time, creating both a throughput challenge and the need for expert level operation. Statements about the requirement of “expert judgment” (11) and restriction to “analysts experienced in the use of . . .” and “skilled in the interpretation of” (12) can be found throughout the compendia. At detection levels of nanogram per liter in water or parts per trillion in air, it is a challenge to make an interference-free composition analysis. In addition to naming specific background or matrix chemicals that interfere (for example, water, isomeric pairs, methylene chloride, sulfur dioxide, and carbonyls), there is a specific call in each of the methods to pay careful attention to chemical carryover effects. Most methods for air, water, and soil analysis necessitate purge and trap, preconcentration on sorbents, and cryotrapping. As a result, washing-bake-out routines and multiple analyses on blank samples are required to establish an interference-free baseline (subtraction of blank values is not permitted). In addition, practically all of the methods require high-purity carrier gases, which provide an additional source of interference and may require preconditioning with a chemical scrubber.
The pressure falls on analytical chemists in contract laboratories and the chemical manufacturing industry to adopt and validate higher performance analytical instrumentation that can detect trace levels of a broad range of toxins. Expensive instruments that remove the need for specialized separation methods can pay for themselves in labor relief alone (13). Where applicable, direct spectroscopy techniques are desired for their simple operation, lack of sample preparation requirements, and continuous monitoring capabilities to meet the needs for field analysis. Mid-infrared (IR) spectroscopy has become popular for environmental monitoring since the introduction of diode-based lasers (14,15). These technologies show promise for sensitivity, but limitations in chemical selectivity. As an example, an acrolein-specific method based on a quantum cascade laser (QCL) direct absorption spectroscopy requires a chemical scrubber to select for acrolein and remove chemicals that have incident spectral overlap, particularly ethylene (16). Mid-IR spectroscopy in the manufacturing industry is typically reserved for clean sample matrices.
QCLs are one approach to reaching the so-called terahertz gap, a region between microwave and infrared that has historically been underutilized for spectroscopy and communications because of the lack of high-power radiation sources and detectors (17). QCLs can operate down to 0.95 THz with a fundamental limitation to how large of a photon (long wavelength) these diodes can produce (18). There is also a limitation in tuning range that restricts the chemical coverage of any one spectrometer. Lower frequency terahertz lasers are still looking for a commercial kick-off market in imaging applications. What has been altogether unaddressed by instrumentation companies today is the application of sub-terahertz spectroscopy for molecular rotational resonance (MRR) spectroscopy, an active research tool dating back to the 1940s (19). However, the only major analytical application has been for astrochemistry studies. In a field where the chemical mixtures are measured from light years away, it is understandable that astrochemists have been the champions and advocates for advancing MRR technology, what is perhaps the most chemically specific spectroscopy.
A molecule’s pure rotational spectrum is described very accurately by a Hamiltonian that is closely related to the molecule’s three-dimensional (3D) mass distribution through the three directional moment of inertia tensor (20,21). Any difference in mass distribution between two molecules leads to distinct rotational spectra. Isomers, conformers, and isotopologues can all be resolved in a mixture. Using a Kraitchman substitution analysis, physical chemists use the site-specific isotopologue spectra to calculate the atomic distribution and render a 3D image of the molecule (22). The ability to resolve site-specific isotopologue spectra has significant implications for using isotopic ratios as a signature to trace chemical pathways (23). In addition to the structure connection, the Doppler-limited FT-MRR spectra (in the 1–100 mTorr range) are so well resolved that complex mixtures can be analyzed without chromatography or chemometrics. For example, millimeter or submillimeter telescopes have been used to catalogue the chemical inventory of molecular clouds that can contain more than 50 different chemical species (24).
The technology leading to the recent development of millimeter-wave FT-MRR includes high-power (>20 mW), broadband (10–12% of center frequency) frequency multiplier sources (25–27). The 260–290 GHz FT-MRR spectrometer used in this study has sufficient bandwidth to cover the repeating spectral patterns of hundreds of organic volatiles. At room temperature, the Boltzmann distribution places the peak population for small molecules (<120 amu) at rotational energy levels where resonances are best measured in the millimeter or submillimeter spectrum. For the analysis of trace-level VOCs and other gaseous toxins with a dipole moment (>0.1 D), the chemical specificity of high-resolution millimeter-wave FT-MRR greatly exceeds that of mid-IR spectra and reduces the interference challenges. In this study, we demonstrate the spectral resolution of FT-MRR by applying it to a headspace VOC mixture, and we show the sensitivity for several other gaseous toxins that fall in the chemical niche of millimeter-wave spectroscopy.
Experimental
The millimeter-wave FT-MRR spectrometer operates at 260–290 GHz and is described in more detail elsewhere (28,29). It consists of a high-speed arbitrary waveform generator that is the fundamental light source for both the sample excitation and heterodyne receiver local oscillator. A millimeter-wave active multiplier chain (AMC) is driven by microwave input to generate short (0.2–1 µs), phase-coherent excitation pulses from 260 to 290 GHz that are broadcast into a 65-cm, single pass, stainless steel sample cell (~1 L in volume) treated with an inert coating, kept at 40 °C, and maintained under vacuum via a turbomolecular pump. When empty, the sample cell vacuum is maintained at 1–10 µTorr; when loaded with a gaseous sample, the optimal pressure is 1–100 mTorr (standard temperature and pressure [STP] gas and number of moles). The vacuum drives the sample transfer, as opposed to a carrier-gas flow.
An excitation pulse that is resonant with a populated rotational transition induces a macroscopic polarization of those rotating molecules and a coherence coupling of the upper and lower angular moment state. After the excitation pulse, the phase coherent, free induction decay (FID) is detected against zero background for up to 2 µs and propagates into the heterodyne receiver for down conversion and subsequent sampling of the time domain emission on a digitizer. The receiver local oscillator is also driven by microwave input to an AMC. One excitation-detection cycle is a total of 2–3 µs depending on the excitation pulse duration. The sensitivity is enhanced by real-time phase-coherent signal averaging in the time domain. After the accumulated time domain data is transferred out of the digitizer field programmable gate array (FPGA) memory, an apodization function is applied and the spectrum is generated by fast Fourier transform. For calibration and correction of the spectrum intensity, the frequency dependent spectrometer response is captured by a calibration scheme by broadcasting a reduced power waveform through the spectrometer. In broadband mode, a series of many narrow bandwidth spectral segments are concatenated for a full spectrum. In targeted mode, a single frequency π/2 pulse is applied in repetition and only one signal averaged spectrum is generated at a time. The FT-MRR spectrometer is also capable of a selective excitation mode based on double resonance modulation described in more detail elsewhere (29).
Static Headspace Sampling
For FT-MRR, any pressure balancing or sample transfer via a carrier gas would only serve to dilute the concentration of the headspace analytes and limit the fractional makeup of analytes in the 1–100 mTorr spectrometer sample cell. We remove the requirement for carrier gas altogether and use the vacuum to drive the sample path. Before injection of the analyte solution, a standard 27-mL headspace vial is sealed with a rubber septum and evacuated of air through a sampling needle connected to the spectrometer (2 min for sufficient evacuation). Next, approximately 1 mL of solution is injected via syringe. As the solution is injected into vacuum the volatiles boil out, so the vapor-phase equilibration is fast. In the absence of air (removed in the vial evacuation step), the minimum total pressure is that of the diluent vapor pressure. After a minute of room-temperature equilibration, an aliquot of headspace is transferred through the sampling needle and into the spectrometer cell by manual control of a needle valve to reach a total pressure of 10 mTorr and the FT-MRR spectrum is measured on the static gas sample. No method development for salt treatment or heating is applied for the broadband data set presented in the results section. However, a heated control, valve-loop sampling mechanism has been published separately (29). The sample for analysis is a Supelco EPA VOC Mix 6 standard composed of chloromethane, dichlorodifluoromethane, choroethane, bromomethane, trichlorofluoromethane, and vinyl chloride dissolved in methanol at 2000 µg/mL.
Gas Flow Sampling
For measurement of gas samples (from Summa canisters, compressed gas containers, or Aldrich Sure/Pac containers) a steady flow of approximately 5 SCCM (standard cubic centimeters per minute) is regulated by a mass flow controller attached directly to the spectrometer measurement cell under constant evacuation by the turbomolecular pump. To minimize chemical carryover in the sample transfer lines, the mass flow controller connected to the sample cell picks off its flow from a higher flow, flushing line. After a steady flow is achieved it can be adjusted to achieve an optimal flow pressure inside the sample cell to maximize signal strength until pressure broadening starts offsetting the signal gains. For trace analysis of known analytes, targeted mode is used where 10 million signal averages can be acquired in 40 s. A zero gas measurement is also performed with scrubbed, industrial grade, nitrogen gas to determine any background interference. The samples used for analysis were calibrated gas standards prepared at 50 ppm in nitrogen and acquired from SpecGas, Inc.
Air Analysis with Cryotrapping
In this method, approximately 1 L of gas is processed through a liquid nitrogen cold trap consisting of a 25-cm-long, coiled 1/8-in. o.d. stainless steel tube at a flow rate of 0.1 L/min for 10 min. It is then warmed, and the vaporized volatiles are released into the spectrometer sample cell to a total pressure of 10 mTorr.
Results and Discussion
The EPA VOC Mix 6 mixture comprises the six rapidly eluted gases out of the 75 volatiles in the EPA methods for VOC analysis (see experimental section). We diluted the mixture 10:1 by volume with water to release the volatiles and better represent performance for a water matrix. Five volatiles were detected, including methanol. Trichlorofluoromethane and dichlorodifluoromethane were not detected because they partition poorly out of water, have lower dipole moments, and are much heavier compared to the rest of the analytes. Although water is the most abundant portion of the vapor and a favorable analyte for FT-MRR, it is not detected in this bandwidth because there are no transitions in the 260–290 GHz band. Because the total pressure in the measurement cell is 10 mTorr, it is under ideal gas conditions. The only effect of the presence of water is dilution since there is an upper limit to the ideal pressure that can be transferred to the spectrometer measurement cell.
The broadband mixture spectrum in Figure 1 illustrates many of the key features of FT-MRR spectroscopy. First, it is clear that these six gases are well resolved from each other; chromatographic separation and chemometric analysis is not necessary. For a typical FT-MRR spectrum, the full width at half maximum (FWHM) line width is approximately 2 MHz out of 30,000 MHz of bandwidth and line centers are determined to within 100 kHz (better than 0.1 ppm of center frequency). The line shapes are controlled by the apodization function to maximize baseline resolution for enhanced dynamic range, an important advantage that reduces Lorentzian pressure broadening and extends the optimal pressure range compared to direct absorption spectroscopy. For quantitation, the intensity at line center is used rather than the area under the curve, which means complete resolution is not required for composition analysis. The information contained in 30,000 independent data channels (where 1 MHz separation is considered resolved) is difficult to capture in the fullband spectrum at the top of Figure 1. The insets better illustrate the spectrum structure and the space available in the band. With a noise level of 2× 10⁻⁴ mV indicated in the figure, and a maximum signal level of 0.4 mV (emitted by chloromethane), this 10-min spectrum demonstrates a dynamic range of three orders of magnitude. However, the receiver can tolerate signals up to 100 mV without compression for a dynamic range of 105. The practical limitation for signal averaging in this full-band high dynamic range mode is 100,000 shots because of the time required to reach any more significant drop in the noise floor, which falls proportionally to N1/2. For targeted excitation of a single spectral transition, the noise floor will fall appropriately out to 100 million shots achievable in under 7 min. The ultimate dynamic range feasible is very near 107.
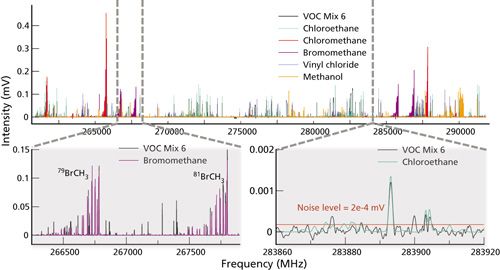
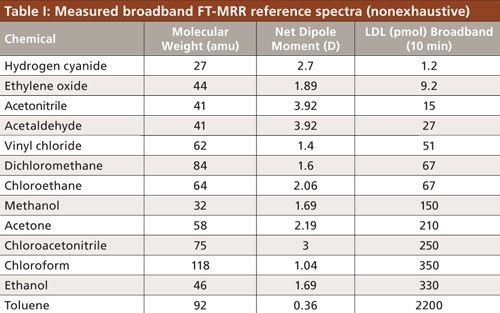
Another notable feature is the characteristic structure of the spectral intensity profile and the appearance of repeating patterns, representative of increasing values of the total angular momentum state for a particular molecule. In combination with the high resolution, the spectral structure in both frequency and intensity add to the parameters for high confidence, automated composition analysis by broadband library matching-a straightforward algorithm that involves least squares scaling of a pure reference spectrum at known pressure to the mixture spectrum. The result is a partial pressure measurement of each gas, and a direct measure of the number of moles of gas in the 1-L sample cell. With a comprehensive library archive that stores the partial pressure and calibration metadata, chemical standards are not required. Several reference spectra have been measured and sensitivity calculations are listed in Table I. Typical detection limits in FT-MRR spectroscopy are in the 0.1–10 pmol range. Table I reflects the fact that FT-MRR is most sensitive to low-molecular-weight, rigid, polar molecules.
Also of note in Figure 1, are the resolved isotopologue patterns illustrated clearly for 79Br and 81Br bromomethane, approximately equal in natural abundance and therefore of comparable intensity. These two spectra are similar in their spectral pattern, and shifted in frequency, dependent upon how the change in mass affects the principle moments of inertia (I = MR2). For atoms further away from the center of mass and lighter in mass, isotopic substitutions cause a greater shift. Since the angular momentum is conserved (L = Iω), a decrease in the moment of inertia is accommodated with a higher frequency of rotation for each angular momentum state causing a higher frequency spread in the spectrum. The direct relationship between the change in the moment of inertia and the spectral shift is how site specific isotopologues can be identified and molecular structure can be accurately calculated. Current methods for isotopic ratio analysis based on mass spectrometry (MS) destroy all of the structural information because the molecule is converted (for example, to CO2) for ionization and detection (23). Chlorinated molecules are important environmental analysis targets for isotopic ratio analysis (37Cl/35Cl), but chlorine chemical conversion and detection by MS is a challenge (30). For FT-MRR, halogenated molecules have the potential to set up a strong dipole moment, making for a very sensitive measurement for capturing (37Cl/35Cl). The 3:1 relative abundance ratio is well represented in the relative intensity of the 35Cl-chloromethane spectrum and 37Cl-chloromethane spectrum in Figure 1 as well. Mid-IR spectroscopy is also used for isotopic ratio analysis, but it is generally not selective enough for organic molecules with multiple carbon atoms.
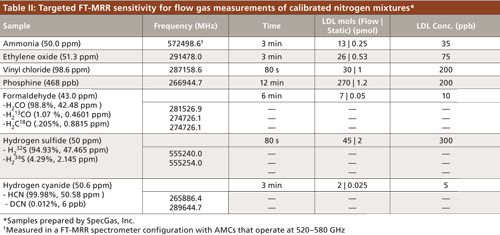
Detection limits for several toxic gases are summarized in Table II. These detection limits are for targeted analyses where only a small frequency region around a line of interest is measured, driving up sensitivity by approximately a factor of 10. Since FT-MRR spectroscopy is performed at low flow rates, less than 20 mL of STP gas is required for direct analysis. The isotopologue spectra scale in natural abundance and further support the detection limits as indicated in Table II with 34S-hydrogen sulfide, D-hydrogen cyanide, 13C-formaldehyde, and 18O-formaldehyde. EPA methods for formaldehyde analysis follow the commonplace technique of dinitrophenylhydrazine (DNPH) derivatization (31). In general, all of the molecules in Table II pose challenges for analysis by conventional methods because they are either reactive or poorly detected without derivatization. It is important to note that at millimeter wavelengths, precision optics are not required. In the single, 65-cm pass configuration used here, the chemical sample does not come into contact with any mirrors.
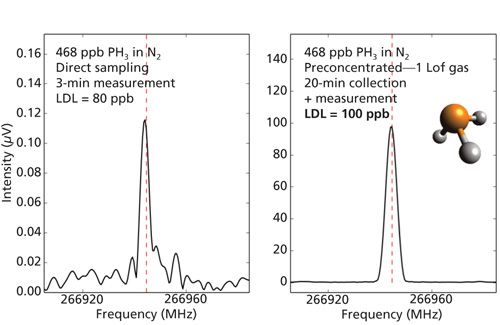
For air analysis, we have also implemented a simple cryotrapping method that can yield almost a 1000-fold decrease in detection limits for VOCs. Figure 2 shows a side-by-side comparison of the direct gas flow measurement and cryotrapped preconcentration measurement of a 500 ppb phosphine sample in nitrogen. The phosphine signal after preconcentration is 800 times stronger. In a real air sample, consideration must be given to the removal of water to realize a 1000-fold sensitivity gain. To test a temperature controlled release of volatiles at -10 °C, and retain the water in the cryotrap, we prepared a mixture of four VOCs (acetaldehyde, acetone, ethanol, and methanol) diluted to approximately 20 ppm with air. The 10 mTorr spectra yield approximate detection limits of 1–2 ppb where direct, targeted FT-MRR detection limits determined from experimental reference measurements were on the order of 1 ppm.
For all the results presented, very minimal method development was required to show how the FT-MRR spectrometer can be used for simple, highly selective, sensitive analytical chemistry. Methods that push the detection limits of current technology generally require a detailed sample preparation procedure that can introduce user variability. The precision of the FT-MRR detector has been assessed by consecutive measurements to yield a short term deviation in spectral intensity of 0.5% across the 260–290 GHz band of operation. Performance validation will predominantly depend on the reproducibility of a vacuum sample transfer method. A previously published FT-MRR headspace analysis sampling method shows promise for acceptable linearity and precision (29). Reliable, automated FT-MRR sampling methods would provide a benefit for both EPA and Food and Drug Administration (FDA) initiatives that require stringent monitoring of toxic chemicals. The long method development cycle times for detecting trace level mutagenic impurities during drug development process research and development (R&D) and the ensuing process and quality control measures mirror the data throughput challenge across the environmental monitoring industry. As a concluding note to the implications of FT-MRR spectroscopy, the recent advances applying phase-sensitive microwave detection for the distinction of enantiomeric pairs (32) provides a transformative tool for environmental analyses concerning the enantioselective toxicity of chiral pesticides to biochemistry (33)-a need equally applicable to the production of enantiopure medicines.
Conclusions
Both the EPA and the FDA realize the importance of streamlining a way to regulate and keep pace with technology. FT-MRR spectroscopy is a timely introduction that draws on innovation at the intersection of telecommunications, computational chemistry, and Fourier transform millimeter-wave spectroscopy to add new capabilities for high performance analytical chemistry. In this study, we presented the strengths of FT-MRR for simple, direct analysis of VOCs and other toxic industrial chemicals by applying it for gas analysis, static headspace analysis, and air analysis with minimal method development. The results demonstrate highly specific detection for small (<120 amu) polar (>0.1 D) gases and volatiles toward parts-per-billion detection limits with pmol of sample-all without lasers, chemometrics, chromatography, or magnets. The performance benchmarks for specificity, dynamic range, and sensitivity are reported to set the stage for more in-depth FT-MRR analytical studies and robust sample transfer development that will greatly reduce interference challenges for trace-level analysis of hazardous chemicals.
References
(1) Code of Federal Regulations (CFR), Title 40 Part 136, “Clean Water Act,” (U.S. Government Printing Office, Washington, D.C, 2011), pp. 5–363.
(2) Code of Federal Regulations (CFR), Title 40 Part 141, “Safe Drinking Water Act,” U.S. Government Printing Office, Washington, D.C, 1998), pp. 367–637.
(3) Code of Federal Regulations (CFR), Title 40 Part 239–282, “Resource Conservation and Recovery Act,” (U.S. Government Printing Office, Washington, D.C, 2003), pp. 309–594.
(4) Code of Federal Regulations (CFR), Title 40 Part 50–97, “Clean Air Act Title III,” (U.S. Government Printing Office, Washington, D.C, 2011), pp. 5–358.
(5) J.R. Sobus, Y.M. Tan, J.D. Pleil, and L.S. Sheldon, Sci. Total Environ.409(22), 4875–4884 (2011).
(6) Test Methods for Evaluating Solid Waste, Physical/Chemical Methods, (U.S. Environmental Protection Agency, Washington, D.C., EPA Report SW-846, Office of Solid Waste, 2007).
(7) Compendium of Methods for the Determination of Toxic Organic Compounds in Ambient Air, (U.S. Environmental Protection Agency, Office of Research and Development, Center for Environmental Research Information, Cincinnati Ohio, 1999).
(8) US EPA, Technology Verification Program Fact Sheet, (U.S. Environmental Protection Agency, Office of Research and Development, National Risk Management Research Laboratory, Revised 2013). Available at: http://archive.epa.gov/nrmrl/archive-etv/web/pdf/p1002ccd.pdf.
(9) B. Erickson, Anal. Chem.69(23), 716A (1997).
(10) Hazardous Waste SW-846 Process Streamlined, (U.S. Environmental Protection Agency, Washington, D.C.). Available at: http://www.epa.gov/epawaste/hazard/testmethods/sw846/pdfs/mir-final-fs3.pdf.
(11) Code of Federal Regulations (CFR), Title 40 Part 439, “Measurement of Purgeable Organic Compounds in Water by Capillary Column Gas Chromatograph/Mass Spectrometry, Method 524.2,” (Office of Research and Development, Environmental Monitoring Systems Laboratory, Cincinnati, Ohio, 1992).
(12) SW-846: Test Methods for Evaluating Solid Waste, Physical/Chemical Methods, Method 8260B, (U.S. Environmental Protection Agency, Office of Solid Waste, Washington D. C., 1996).
(13) J.M. Perkel, Biocompare, “GC-MS: The yin to LC-MS’s yang” June 6, 2013. Retreived from http://www.biocompare.com/Editorial-Articles/138483-GC-MS-The-yin-to-LC-MS-s-yang/.
(14) Spectroscopy, “Mid-IR Technologies Help EPA Monitor Environmental Stressors,” March 19, 2012. Retreived on August 14, 2015 from http://www.spectroscopyonline.com/mid-ir-technologies-help-epa-monitor-environmental-stressors.
(15) ETV Joint Verification Statement. (U.S. Environmental Protection Agency, Advanced Monitoring Systems Center & National Risk Management Research Laboratory, 2011). Available at: http://nepis.epa.gov/Adobe/PDF/P100DOXS.pdf.
(16) J.H. Shorter, Small Business Innovation and Research Grant Phase II Final Report: Acrolein Monitor Using Quantum Cascade Laser Infrared Adsorption. (U.S. Environmental Protection Agency and Aerodyne Research, Inc., Washington, D.C., 2009). Available at: http://cfpub.epa.gov/ncer_abstracts/index.cfm/fuseaction/display.highlight/abstract/8382.
(17) R. Köhler, A. Tredicucci, F. Beltram, H.E. Beere, E.H. Linfield, A. Giles Davies, D.A. Ritchie, R.C. Iotti, and F. Rossi, Nature417, 156–159 (2002).
(18) G. Scalari, C. Walther, M. Fischer, R. Terazzi, H. Beere, D. Ritchie, and J. Faist. Laser & Photon. Rev. DOI 10.1002/lpor.200810030 (2008).
(19) R.H. Hughes and E.B. Wilson, Phys. Rev.71, 562 (1947).
(20) W. Gordy and R.L. Cook, Microwave Molecular Spectra (John Wiley and Sons, Hoboken, New Jersey, 1984).
(21) C. Townes and A. Schawlow, Microwave Spectroscopy (Dover, Mineola, New York, 1975).
(22) J. Kraitchman, Amer. J. Phys.21, 17 (1953).
(23) A Guide For Assessing Biodegradation and Source Identification of Organic Ground Water Contaminants Using Compound Specific Isotopic Ratio Analysis, (U.S. Environmental Protection Agency, Office of Research and Development, National Risk Management Research Laboratory, Ada, Oklahoma, 2008).
(24) A. Belloche, C. Comito, C. Hieret, K.M. Menten, H.S.P Mueller, and P. Schilke, “The Search for Complex Molecules in the ISM: A Complete 3mm Line Survey of Sgr B2-N and -M” presented at Molecules in Space & Laboratory, Paris, France, 2007.
(25) T. Crowe, W. Bishop, D. Porterfield, J. Hesler, and R. Weikle, IEEE J. Solid-State Circuits40(10), 2104–2110, (2005).
(26) A.L. Steber, B.J. Harris, J.L. Neill, and B.H. Pate, J. Mol. Spec.280, 3 (2012).
(27) J.L. Niell, B.J. Harris, A.L. Steber, K.O. Douglas, D.F. Plusquellic, and B.H. Pate, Opt. Expres.21, 19743 (2013).
(28) J.L. Neill, B.J. Harris, R.L. Pulliam, M.T. Muckle, R. Reynolds, D. McDaniel, and B.H. Pate, “Pure Rotational Spectrometers for Trace-Level VOC Detection and Chemical Sensing,” Proc. SPIE 9101, Next-Generation Spectroscopic Technologies VII, 91010B, Baltimore, Maryland, 2014.
(29) B.J. Harris, R.L. Pulliam, J.L. Neill, M.T. Muckle, R. Reynolds, and B.H. Pate, “Fourier Transform Molecular Rotational Resonance Spectroscopy for Reprogrammable Chemical Sensing,” Proc. SPIE 9362, Terahertz, RF, Millimeter, and Submillimeter-Wave Technology and Applications VIII, 936215, February 2015.
(30) T. Kuder and P. Philp, Environ. Sci. Technol. 47, 1461 (2013).
(31) USEPA. Determination of Formaldehyde in Ambient Air Using Adsorbent Cartridge Followed by High Performance Liquid Chromatography (HPLC), Compendium Method TO-11A, Center for Environmental Research Information, Cincinnati, OH, USA, 1999.
(32) D. Patterson, M. Schnell, and J.M. Doyle, Nature 497, 475–477 (2013).
(33) A.W. Garrison et al., in Chiral Pesticides: Stereoselectivity and Its Consequences (ACS Symposium Series, American Chemical Society, Washington DC, 2011), Chapter 1.
Brent H. Harris, Justin L. Neill, Robin L. Pulliam, and Matthew T. Muckle are with BrightSpec, Inc., in Charlottesville, Virginia. Please direct correspondence to: brent.harris@brightspec.com

New Study Reveals Insights into Phenol’s Behavior in Ice
April 16th 2025A new study published in Spectrochimica Acta Part A by Dominik Heger and colleagues at Masaryk University reveals that phenol's photophysical properties change significantly when frozen, potentially enabling its breakdown by sunlight in icy environments.