FT-IR Contaminant Identification Using OMNIC? Specta Software
Application Notebook
Identifying contaminants in materials is a common troubleshooting need for which FT-IR spectroscopy is ideally suited. Thermo Scientific OMNIC Specta software provides a unique and powerful tool to assist the analyst to quickly identify unexpected constituents. The OMNIC? Specta? Contaminant Search feature allows for rapid investigations that can save time and minimize the impact of product issues.
Identifying contaminants in materials is a common troubleshooting need for which FT-IR spectroscopy is ideally suited. Thermo Scientific OMNIC Specta software provides a unique and powerful tool to assist the analyst to quickly identify unexpected constituents. The OMNIC™ Specta™ Contaminant Search feature allows for rapid investigations that can save time and minimize the impact of product issues.
The traditional process for performing IR contaminant analysis is spectral subtraction. While this technique is useful, the presence of totally absorbing peaks that distort spectral features coupled with user-to-user variability complicates the interpretation of constituent identity in samples. OMNIC Specta software contains a Contaminant Search function that complements the break-through Multi-Component Search capability, allowing automated comparative analysis of unknown constituents in a sample against known components. Here we describe how OMNIC Specta Contaminant Search can be used for the identification of unknown components in a sample.
Experimental Conditions
Samples were obtained from various sources. Spectra were collected using a Thermo Scientific Nicolet iS10 FT-IR spectrometer equipped with a Smart iTR™ diamond attenuated total reflectance (ATR) accessory. IR spectra of pure reference materials (polyvinylchloride, phthalate, ethylene vinyl acetate) were collected and stored for use in searching. Prior to searching against commercial libraries based on spectra collected using transmission sampling, the OMNIC Specta Advanced ATR Correction was applied to permit direct comparison. Collection of spectra from reference materials is discussed in the Results. Various commercial libraries related to the study were accessed, due to the unknown character of the contaminants.
Results
Three problem-solving scenarios are presented using OMNIC Specta Contaminant Search to identify unexpected components. The Contaminant Search routine removes the contribution of the known component spectrum from the unknown. This residual spectrum is then compared to the library spectra that best match the unknown. In the first example below, two contaminants were found, and in the other two examples, only one was identified. The search routine can identify up to four contaminants in a single step with no user intervention.

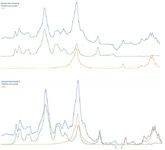
Figure 1: Contaminant found on the stuck beverage can.
The Case of the Stuck Aluminum Can
A beverage company was accused by a customer of damaging their furniture. The beverage container left an indelible ring on their table top. A sample, obtained by scraping some residue off the base of the can, was placed on the diamond ATR, and the resulting spectrum is seen at the top of Figure 1. Spectral searching indicated the main ingredient was similar to linseed oil, which was easily explained as arising from oils used in furniture polish. However, there were clearly other components present. OMNIC Specta Contaminant Search was then applied with linseed oil being selected as the "known component". The Contaminant Search result is shown in the lower portion of Figure 1, with excellent agreement between the unknown spectrum and those spectra found in the library. Talc was one of the items identified, a common household material used in foot and baby powders. However, the story was completed by the third identified component: cyanoacrylate, the key ingredient in super glue. Apparently, the customer was the focus of a practical joke. Someone had glued the can to the table, but the oil allowed the can to be released from the surface. In less than two minutes, the problem was resolved — from obtaining the beverage container to getting the correct answer.
Plasticizers in PVC
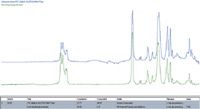
Phthalate additives are commonly used in PVC (polyvinylchloride) plastics to provide flexibility. The concentration depends upon the flexibility desired, but can be quite high. Recent regulatory requirements have made the presence of phthalates a concern to importers, especially of children's toys. In fact, certain phthalates have been banned from use in toys due to their strong effect on developing children. For this study pure samples of PVC were obtained along with key phthalate additives. Spectra were collected and grouped for use as a reference library. Using Contaminant Search with a pure PVC spectrum as the known component, the search yielded the result shown in Figure 2. Clearly, OMNIC Specta was able to pull out the specific phthalate, not just the general class of material, in one simple step.

Figure 2: Plasticizers in PVC.
Contamination in EVA Production
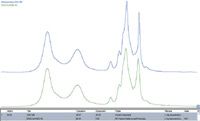
A polymer production line was scheduled to make (poly)ethylene vinyl acetate (EVA) with 18% EVA. The production requirements were very strict, so a quality check using the OMNIC QCheck™ feature was performed with a high threshold. The material narrowly failed with 18% EVA being the closest match. Based on the failed result, OMNIC Specta Contaminant Search was done using 18% EVA as the known component. The contaminant was identified as erucylamide (erucamide), a slip agent commonly placed on plastic bags (Figure 3). It was discovered that residual slip agent, not part of the EVA formulation, remained on the film rollers from a previous material production run. The search also showed that this contaminant was at a very low content level — later verified to be approximately 0.8% — demonstrating the sensitivity of the Contaminant Search algorithm.

Figure 3: Comparison verifying erucamide in failed EVA polymer film.
Conclusion
OMNIC Specta software provides an incisive tool for identification of contaminations in materials. Combining its powerful patented Multi-Component Search algorithm and an extensive collection of Thermo Scientific infrared spectral libraries makes spectra comparison meaningful for QC, analytical service, and material analysis laboratories. The software performs a concerted search analysis on the sample material, using a known spectrum as one input and a set of potential contaminants as the second. This provides a consistent method, with no variation between users, permitting procedures to be simplified and expedited. The comprehensive data visualization options give the user the evidence they need to support their findings and build a compelling case.
Visit www.thermoscientific.com/spectroscopy for more information.
Thermo Fisher Scientific, Molecular Spectroscopy
5225 Verona Rd. Madison, WI 53711
tel. (608) 276-6100, fax (608) 276-5046

Thermo Fisher Scientists Highlight the Latest Advances in Process Monitoring with Raman Spectroscopy
April 1st 2025In this exclusive Spectroscopy interview, John Richmond and Tom Dearing of Thermo Fisher Scientific discuss the company’s Raman technology and the latest trends for process monitoring across various applications.
A Seamless Trace Elemental Analysis Prescription for Quality Pharmaceuticals
March 31st 2025Quality assurance and quality control (QA/QC) are essential in pharmaceutical manufacturing to ensure compliance with standards like United States Pharmacopoeia <232> and ICH Q3D, as well as FDA regulations. Reliable and user-friendly testing solutions help QA/QC labs deliver precise trace elemental analyses while meeting throughput demands and data security requirements.