FT-IR–Raman Combination: The Perfect Analytical Solution for Vibrational Spectroscopists
The authors discuss the combined use of Raman and FT-IR spectroscopy in fields such as forensic science, biomedical science, catalysis, and polymers.
The combination of FT-IR and Raman spectroscopy provides synergistic information that gives answers to complex materials problems. Rather than combining spectroscopy with a separation method, the two spectroscopic measurements of Raman and IR on the microscopic scale provide more complete vibrational characterization of solid and liquid materials, without destruction or any modification. Its application in fields as diverse as forensic science, biomedical science, catalysis, and polymers will be discussed.
Due to the rapid evolution of Raman instruments, which was initiated in the late 1980s and 1990 with the introduction of charge-coupled devices (CCDs) and the holographic notch filter, Raman spectroscopy has become easy to use and more effective in solving problems. Over the last 10 years, the successes have generated huge interest in incorporating the technique in many new situations.
Hyphenated Raman systems that have been demonstrated include atomic force microscopy (AFM)-Raman (1–3), scanning electron microscopy (SEM)-Raman (4), micro-photoluminescence–Raman, and epifluorescence–Raman (5). Unlike hyphenated techniques (instruments that provide two or more measurements) that combine spectroscopy with some separation technique, with the combination of Fourier-transform infrared (FT-IR) and Raman spectroscopy, the sample is intact after both measurements. The principle is to correlate microscopic information on archivable samples with complete vibrational spectroscopic characterization. This article will review some of the applications and developments of the powerful combination of FT-IR and Raman spectroscopy.
Instrumentation Concept
Both the Raman and the FT-IR microscope take advantage of the infinity focus optics on the optical microscope. Because of this property, it is easy to engineer new devices onto the microscope by stacking them above the objectives. In implementing the combination, the interferometer is mounted above the same microscope as is used in the Raman system.
Because all of the optics involved in the laser and Raman spectrometer coupling are behind the microscope, there is no optical interference. While this concept is straightforward, it was only possible to implement it with a compact interferometer. This instrument was designed to take infrared spectroscopy out of the laboratory. The largest dimension of the interferometer is less than 6 in. By making the calculation that condensed phase materials rarely have spectral linewidths narrower than 4 cm-1 , it became possible to reduce the mirror travel. In addition, the size of the mirrors and beamsplitters was reduced to match the aperture of the microscope. One of its primary applications is for field forensics.
The optics used for Raman microscopy are standard visible refractive optics available in many varieties (long working distance, corrected to look at samples through a glass plate, immersion, and so forth). However, IR optics require extended capabilities. Figure 1 shows the objectives used for collection of IR spectra. The all-reflecting objective (ARO) is used when it is not possible to come into direct contact with the sample. The attenuated total reflection (ATR) objective is the default objective that is used when touching the sample is not a problem. It produces results immediately, and is rather immune to the problems introduced by the optical properties of the sample. That means that when reflection measurements are made with the ARO, the transformed interferogram must be further treated with a Kramers–Koenig transformation if the sample has a specular surface, or a Kubelka–Monk transformation if the sample is diffusely scattering. However, if the optical properties are in between specularly reflecting and diffusely scattering, it is virtually impossible to recover the real absorption spectrum. But with the ATR objective, these problems are avoided. However, there is another issue with the ATR objective, and that is that the penetration of the beam is wavelength dependent, and this affects the relative intensities of the bands in the spectrum. But there is normally a software algorithm to correct for the wavelength dependence of the penetration of light.
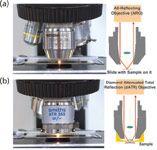
Figure 1: Photograph (left) and schematic (right) of the (a) ARO and (b) ATR objectives for the FT-IR microscope.
The concave mirrors in both of these objectives shown in Figure 1 are paraboloids. Collimated light enters one side of the objective and is focused by the paraboloid at the sample, and the reflected light exits the opposite side of the objective and is directed to the mercury-cadmium-telluride (MCT) detector. The difference between the ARO and ATR is that the ATR objective has a tiny hemisphere of diamond mounted just above the sample point. The light is focused onto the bottom surface of the diamond and then the evanescent wave has the possibility to be absorbed by any material in contact with the diamond.
The figures also show small lenses mounted on the axis of the paraboloids. These lenses provide visualization of the sample to select the region of interest in the sample. Because the sample can be visualized at the same time that the IR beam is illuminating the sample, the exact region of analysis is known.
On combination instruments in which one software controls both the FT-IR and Raman, there is, in addition, the possibility to record Raman and IR maps from the same region of the sample.
Applications
The interest in being able to record both Raman and FT-IR spectra is to take advantage of the complementarity of the measurements. There is a selection rule for highly symmetric materials that says that if a vibration is IR-active, it will not be Raman-active, and vice versa. In reality, even when a molecule is not highly symmetric, bands that are strong in one measurement tend to be weak in the other. Figure 2 shows IR and Raman spectra of silicone (polydimethylsiloxane) and shows this complementarity. In addition, the FT-IR spectrum starts at 650 cm-1 , whereas the Raman spectrum starts at some value between 50 and 150 cm-1 , depending upon the quality of and the manner in which the filter is being used. Clearly, the two spectra are sensitive to different spectral features, and the Raman spectrum has better access to the important region below 650 cm-1 , where the bands of many metal oxides are observed.
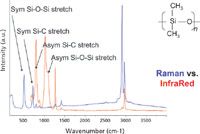
Figure 2: Raman (top) and FT-IR (bottom) spectra of polydimethylsiloxane.
Figure 3 shows an example of a real-world polymer where FT-IR and Raman provide complementary information. Both the IR and Raman spectra show evidence for a polyamide — the Amide I band near 1650 cm-1 and the NH stretch near 3300 cm-1 appear in both spectra. The Amide II near 1550 cm-1 appears only in the IR. The CH stretches (between 2700 and 3100 cm-1 ) are more pronounced in the Raman than the IR, but the unsaturated CH near 3160 cm-1 is better defined in the IR. The most interesting part is the low-frequency region, which is absent in the FT-IR; the three little bands between 350 and 700 cm-1 are indicators for the presence of TiO2 in the anatase form. TiO2 is often used as a whitener, so its presence is not surprising.
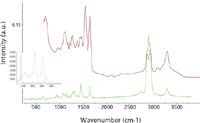
Figure 3: FT-IR (top) and Raman spectra (bottom) of Hydrofil, a nylon 6âPEG (polyethylene glycol) block copolymer with TiO2 filler. The inset shows the spectra of anatase (bottom) and rutile (top) polymorphs of TiO2.
Forensic Science
Combination Raman–FT-IR instruments are being used extensively in forensic science and homeland security. There are instruments at the FDA's Forensic Chemistry Center and the Canadian Border Services Agency, and several are deployed in Iraq. These instruments are used to study fibers, pharmaceutical products, and explosives. Often it is enough to determine that a sample from a crime scene matches a sample from a suspect's environment. But in addition, the systems can be used for more sophisticated studies. For instance, in a collaboration between HORIBA Scientific and the FDA Forensic Chemistry Center, maps of seized tablets were created and it was shown that by comparing the excipients' identity, and the components' distributions to those of legitimate samples, the tablets were deemed counterfeit. Figure 4 shows the result of one such study.
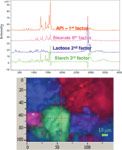
Figure 4: Raman image (bottom) of a counterfeit tablet showing the distribution of API (red), magnesium stearate (pink), lactose (blue), and starch (green). The map was produced by reducing the hyperspectral cube to factors that well approximated the species noted. The factor loadings shown at the top of the figure are quite good approximations to the spectra of the species noted.
Catalysis
There are areas where vibrational analysis is being used for more than identification purposes. Catalysis is one of these areas. The interesting thing about the IR–Raman combination is that they really do provide complementary information. IR spectroscopy is most sensitive to the organic reactants and products, whereas Raman spectroscopy is most informative about the state of the catalytic surface. Professor Israel Wachs at Lehigh University (Bethlehem, Pennsylvania), Professor Edmond Payen at the Technical University of Lille (Lille, France), Professor Miguel Banares at the University of Madrid (Madrid, Spain), and others are making measurements under "Operando" conditions (conditions in which the catalysis is controlling reactions). By controlling the temperature and pressure of the reactant gases and monitoring the products of the reaction by mass spectrometry, it is possible to totally understand the catalytic process and to intelligently engineer the catalyst. Figure 5 shows FT-IR results from Professor Payen's laboratory, where he is monitoring the conversion of methanol on a 20% Mo on Al2O3 catalyst; the compounds involved are dimethyl ether, dimethoxymethane, formaldehyde, formic acid, and water. Band assignments for the various types of CH stretches are indicated in the figure; clearly, the evolution of the various species can be followed.
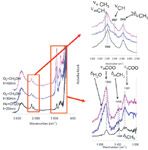
Figure 5: FT-IR spectra recorded during the conversion of methanol under Operando conditions. The spectra were recorded in a Linkam Operando cell and treated with the KubelkaâMonk algorithm in LabSpec.
Bioclinical Studies
Because the spatial resolution of any microscope is close to the wavelength of the light, the spatial resolution in the IR is typically 5–20 µm, so IR maps will not be effective in measuring much detail inside of biological cells. However, histological maps of tissue morphologies are accessible to IR maps. Figure 6 shows an IR bone map with features identified as mineral and matrix. The mineral is carbonated hydroxyapatite (a calcium phosphate) and the matrix is organic. Correlations between FT-IR and Raman maps will add insight into our understanding of metabolic conditions and diseases.
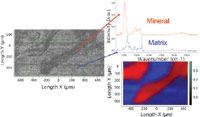
Figure 6: Left: optical micrograph of bone section. Upper right: FT-IR spectrum of the mineral phase versus the FT-IR spectrum of the organic matrix. Bottom right: FT-IR image of the two phases detected in this bone section.
Summary
General considerations in the design of a combination FT-IR Raman microscope were reviewed. Some new applications in which the combination of measurements has enhanced potential have been described.
Andrew Whitley, Emmanuel Leroy, and Fran Adar are with HORIBA Scientific, Edison, New Jersey.
References
(1) R. Zenobi and V. Deckert, Angew. Chem., Int. Ed. Engl. 39, 1746–1756 (2000).
(2) M.S. Anderson, Locally Enhanced Raman Spectroscopy with an Atomic Force Microscope, APL 2000 76, 3130-3133.
(3) R.M. Stockle, Y.D. Suh, V. Decker, and R. Zenobi, Chem. Phys. Lett. 318, 131–136 (2000).
(4) M. Truchet and M. Delhaye, Transmission Electron Microscope with Castaing's Electron S-ray and Laser Raman Probes for Simultaneous Elemental and Molecular Analysis at Submicrometric Scale, in Microbeam Analysis (San Francisco Press, 1987), pp. 163–164.
(5) W.E. Huang, K. Stoecker, R. Griffiths, L. Newbold, H. Daims, A.S. Whiteley, and. M. Wagner, Raman-FISH: Combining Stable-Isotope Raman Spectroscopy and Fluorescence in situ Hybridization for the Single Cell Analysis of Identity and Function, Environ. Microbiology 2007.

Ancient Meteorite Reveals Space Weathering Secrets Through Cutting-Edge Spectroscopy
Published: May 27th 2025 | Updated: May 27th 2025Researchers in Rome used advanced spectroscopic techniques to probe the mineralogy of the CM2 carbonaceous chondrite NWA 12184. This revealed the effects of space weathering and provided insights into C-type asteroid evolution.
Multi-Analytical Study Reveals Complex History Behind Ancient Snake Motif in Argentine Rock Art
May 22nd 2025A recent study published in the Journal of Archaeological Science: Reports reveals that a multi-headed snake motif at Argentina's La Candelaria rock shelter was created through multiple painting events over time.

.png&w=3840&q=75)

.png&w=3840&q=75)


.png&w=3840&q=75)


.png&w=3840&q=75)


