Handheld Near-Infrared Spectrometers: Reality and Empty Promises
Spectroscopy
In celebration of Spectroscopy’s 35th Anniversary, leading experts discuss important issues and challenges in analytical spectroscopy.
This communication attempts to separate the wheat from the chaff regarding the bid of commercially available handheld near-infrared (NIR) spectrometers and tries to answer the question of whether this technique is already mature for applications in a non-expert user community.
Taking into account its chemical specificity and the simplicity of sample presentation for a broad range of materials, near-infrared (NIR) spectroscopy is by far the most advanced vibrational spectroscopy technique in terms of hardware miniaturization. This development is additionally fueled by market-research companies that predict a considerable growth rate for this segment of instrumentation within the next few years. With the further reduction of costs by high-volume manufacturability, this technique will also come into reach of a new–non-expert–user community and widespread adoption of such spectrometers for in-the-field testing and on-site measurements in everyday-life applications is forecast. However, these optimistic prospects have, unfortunately, also led to negative commercial developments such as the exaggerated claims of some direct-to-consumer companies regarding the performance of their “NIR scanners” with “cloud evaluation of big data.” Apart from making unrealistic promises with reference to, for example, the determination of the type and accuracy of nutritional parameters (1,2), determination of the freshness of fruit or the identification of stains on textiles (3), most of the advertising videos oversimplify the measurement procedure to a “point-and-shoot” action with any deficiencies in sample presentation and sample representativeness being taken care of by the cloud evaluation. These “garbage in–garbage–out” measurements inevitably lead to unfulfilled expectations of the users, and as a consequence of such failures, to a misjudgment of the real potential of NIR spectroscopy.
Therefore, in this article the instrumental principles and performance parameters of those instruments that are not only available on the market, but whose performance parameters are also easily traceable in specification sheets or have been verified by the scientific community in test measurements, are summarized. Apart from a couple of exemplary applications, the basic requirements for qualitative and quantitative applications are outlined to provide the interested reader some guidelines for selecting the appropriate hardware for a specific analytical problem . Finally, the maturity of handheld NIR spectroscopy for introduction to a new non-expert user community is briefly discussed from the authors’ perspective.
Instrumentation
The recent progress in NIR spectrometer miniaturization has taken advantage of new micro-technologies such as micro-electro-mechanical systems (MEMS), micro-opto-electro-mechanical systems (MOEMS), micro-mirror arrays, and linear variable filters (LVFs) and has led to a drastic reduction of spectrometer-size and weight (<100 g). Although some companies and research institutions are working on the implementation of miniaturized NIR systems in mobile phones (4,5), such devices are not yet commercially available.
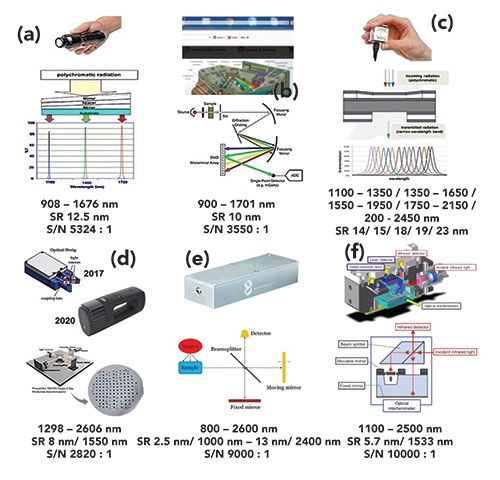
In Figure 1 the state-of-the-art of miniaturized and commercially available NIR spectrometers is illustrated. Only the most important spectroscopic parameters (spectral range, spectral resolution, and signal-to-noise ratio, or S/N) are included in the figure. While the instruments in the top row are based on (a) an LVF with an InGaAs detector array, (b) a micro-mirror array with a single-element InGaAs detector, and (c) a Fabry-Perot interferometer with a single-element InGaAs detector, the spectrometers in the bottom row (d–f) are exclusively based on Michelson interferometers. The values of the S/N for (a), (b), and (d) have been determined for the available wavelength ranges in our laboratory, while the S/N values of the other systems have been taken from the datasheets in the corresponding websites. Additionally, it is noteworthy that the last-mentioned two systems (e) and (f) only became commercially available since the beginning of 2020.
FIGURE 1: The optical schemes of handheld NIR spectrometers, based on different monochromator principles: (a) VIAVI MicroNIR 1700, LVF; (b) DLP NIRscan Nano EVM, Texas Instruments DMD; (c) Spectral Engines NIR spectrometer, tunable Fabry-Perot interferometer; (d) Si-Ware Systems, MEMSbased FT-NIR spectrometer; (e) SouthNest Technology, MEMS-based FTNIR spectrometer; (f) Hamamatsu Photonics C15511-01, MEMS-based FT-NIR spectrometer (SR: spectral resolution; S/N: signal/noise ratio).

Applications
Generally, these spectrometers can be applied to qualitative identification, such as in the context of fighting fraud (1,6,8) or for the quantitative determination of specific components in a broad range of materials ranging from active ingredients in pharmaceutical formulations to nutritional parameters in food (2,7,8). Two examples illustrate the everyday life applicability of the discussed instruments.
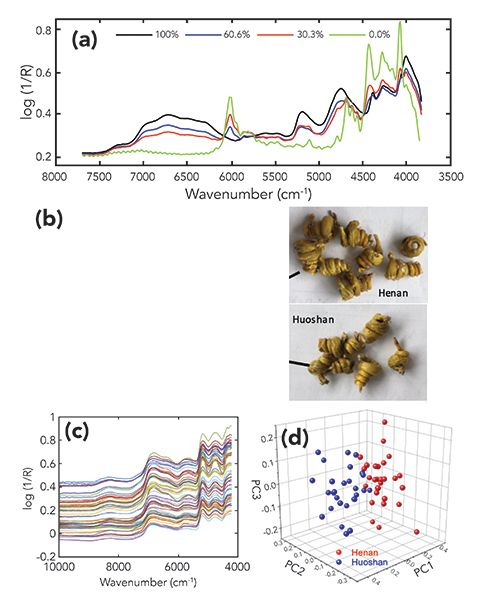
Textiles are extremely important materials for everyday life with a broad range of applications and properties. Given the increasing quality and price consciousness of customers, the availability of a simple tool for a rapid test of a purchased textile would be a significant progress in customer protection. Although textiles manufactured from pure natural materials (silk, cotton, wool) are generally preferred due to their higher wearing comfort, synthetic polymers are often admixed to modify their tribological properties. In Figure 2a, the diffuse-reflection NIR spectra of different cotton–polyester blends are shown. The wide wavelength range and measurement speed (scan time was only 8 s) of the adopted instrument (Figure 1d) make this spectrometer a powerful tool to quickly estimate the blend composition of the textile under inspection. Apart from many differences in the spectra of pure cotton (black spectrum) and pure polyester (green spectrum) specifically the absorption bands of the 2xν(OH) (6200–7200 cm-1) and 2xν(CH)ar (6100 cm-1) overtones of cotton and polyester, respectively, can be used to verify the composition. For public use by non-experts, however, a chemometric partial least squares (PLS) analysis (including spectral pretreatment procedures) had to be embedded in an app to facilitate rapid evaluation of the textile composition.
FIGURE 2: Results of spectra analysis of two applications: (a) FT-NIR spectra of cotton/polyester textiles recorded by the Si-Systems spectrometer; (b) two kinds of fengdou samples; (c) FT-NIR spectra of the two species of fengdous recorded by the SouthNest technology spectrometer; (d) 3D score plot of the two kinds of fengdous.

As a result of increasing criminal activities in the pharmaceutical market, another important prospective everyday life application of handheld NIR spectroscopy is the authentication of pharmaceutical formulations. One of the most widespread attempts of deception is by internet sale of tablets to treat erectile dysfunction. The straightforward discrimination of fake tablets from genuine ones with the handheld LVF NIR spectrometer of Figure 1a was shown several years ago (8). Here, the use of one of the three most up-to-date instruments (Figure 1e) for the identification of traditional Chinese medicines shall serve as a case study.
Dendrobium huoshanense C.Z. Tang et S.J. Cheng is a rare and endangered medicinal plant (orchid) that occurs only in the northern mountain regions of the Yangtze River. Given its excellent therapeutic merits, D. huoshanense (huoshan) has been recorded to nourish the stomach, enhance immunity, resist cancer, prolong life, relieve throat inflammation, and improve eyesight. The stems of huoshan are processed into fengdou, shown in Figure 2b, which is very expensive due to its high medicinal value and supply shortage. Therefore, it would be desirable to discriminate authentic fengdou from product based on D. henanense (henan), which looks very similar, as shown in Figure 2b, but has much lower efficacy and correspondingly a much lower (1/10) price. Because the discrimination is not possible by visual inspection only, a nanoFT-NIR spectrometer was used to measure the diffuse-reflection spectra of 28 huoshan and 28 henan fengdou samples by clamping them between the light fiber tip and the base plate, as seen in Figure 2b and averaging 16 scans (0.2 s/scan). For further processing, the raw spectra measured in the wavenumber range 9990–4200 cm-1 (Figure 2c) were truncated to the wavenumber range 6005–4980 cm-1 and pretreated by a standard normal variate (SNV) algorithm to correct for scattering effects. In the final principal component analysis (PCA) the first three principal components (PCs) contributed 55.9%, 17.2%, and 12.3% variance, respectively, and the corresponding 3D score plot illustrated in Figure 2d proves that the spectra of huoshan and henan cluster in two classes, thereby providing a suitable data basis for the discrimination of the superior huoshan fengdou samples from the henan species. Comparative evaluations with spectra of short-wavelength portions (9985–6054 cm-1) did not provide successful discrimination results. Here too, for the non-expert user, a much simpler sample presentation in combination with an easy-to-use evaluation routine had to be developed.
Conclusions
State-of-the-art miniaturized NIR spectrometers provide suitable instrumental tools to solve qualitative as well as quantitative analytical problems by on-site and in-the-field measurements with a sufficient performance level. In a multiplicity of qualitative and quantitative investigations with the purpose to rank different handheld NIR spectrometers (6,7,9) the following performance features have been derived: First, for qualitative tasks including authentication, discrimination, and identification, the availability of a broad wavelength range in general and the long-wavelength range specifically had priority over S/N. Second, irrespective of a narrower wavelength range, instruments with a high S/N ratio yielded better calibration parameters in the quantitative multivariate analysis compared to instruments with a larger spectral range but inferior S/N.
However, in spite of suggestions by several direct-to-consumer companies in advertisements and videos, the technique has not yet reached the necessary maturity for operation by non-experts, not to mention data interpretation. On the one hand, to achieve these goals, clear guidelines regarding sample presentation and sample-dependent settings of measurement parameters (such as to compensate for sample heterogeneity) have to be provided by the vendors. On the other hand, the spectra pretreatment and evaluation algorithms have to be embedded in interactive apps with simple yes/caution/no (“traffic light”) answers for qualitative identification or discrimination problems or component-specific concentration specifications for quantitative investigations.
Nevertheless, we believe that in the near future these miniature handheld NIR spectrometers will not only enable non-expert users in new measurement environments to gain important benefits, but that these spectrometers-stand-alone or integrated into mobile phones-and equipped with elaborate operation and evaluation software, will be broadly adopted by the public.
Acknowledgment
The authors gratefully acknowledge the measurement of the fengdou spectra by SouthNest Technologies Co, Ltd., Hefei, China.
References
1. N. O’Brien, C.A. Hulse, F. Pfeifer, and H.W. Siesler, J. Near Infrared Spectrosc. 21, 299–305 (2013).
2. M.D. Neves, R.J. Poppi, and H.W. Siesler, Molecules 24, 2029 (2019).
3. H. Yan and H.W. Siesler, Spectroscopy 33, 6–16 (2018).
4. T. Pügner, J. Knobbe, and H. Grüger, Appl. Spectrosc. 70, 734–745 (2016).
5. https://trinamix.de/nir-spectroscopy/mobile-spectroscopy-solution; accessed 04/01/2020.
6. H. Yan and H.W. Siesler, J. Near Infrared Spectrosc. 26(s11), 311–321 (2018).
7. H. Yan and H.W. Siesler, Pharm. Biomed. Anal. 160, 179–86 (2018).
8. M. Alcalà, M. Blanco, D. Moyano, N. Broad, N. O’Brien, D. Friedrich, F. Pfeifer, and H.W. Siesler, J. Near Infrared Spectrosc. 21, 445–457 (2013).
9. H. Yan and H.W. Siesler, Appl. Spectrosc. 72, 1362–1370 (2018).

Hui Yan is a professor with the School of Biotechnology at the Jiangsu University of Science and Technology in Zhenjiang, China. Bangxing Han is a professor with the College of Biological and Pharmaceutical Engineering at West Anhui University, in Lu’an, China. Heinz W. Siesler is a professor with the Department of Chemistry at the University of Duisburg-Essen in Essen, Germany. Direct correspondence to: yanh1006@163.com or hw.siesler@uni-due.de

AI-Powered SERS Spectroscopy Breakthrough Boosts Safety of Medicinal Food Products
April 16th 2025A new deep learning-enhanced spectroscopic platform—SERSome—developed by researchers in China and Finland, identifies medicinal and edible homologs (MEHs) with 98% accuracy. This innovation could revolutionize safety and quality control in the growing MEH market.
New Raman Spectroscopy Method Enhances Real-Time Monitoring Across Fermentation Processes
April 15th 2025Researchers at Delft University of Technology have developed a novel method using single compound spectra to enhance the transferability and accuracy of Raman spectroscopy models for real-time fermentation monitoring.
Nanometer-Scale Studies Using Tip Enhanced Raman Spectroscopy
February 8th 2013Volker Deckert, the winner of the 2013 Charles Mann Award, is advancing the use of tip enhanced Raman spectroscopy (TERS) to push the lateral resolution of vibrational spectroscopy well below the Abbe limit, to achieve single-molecule sensitivity. Because the tip can be moved with sub-nanometer precision, structural information with unmatched spatial resolution can be achieved without the need of specific labels.