Raman Spectroscopy is Solving the Perpetual Problem of CSI: The Time of a Crime
Spectroscopy
In celebration of Spectroscopy’s 35th Anniversary, leading experts discuss important issues and challenges in analytical spectroscopy.
Crime scenes are the starting point of many investigations. This is where evidence is collected to provide investigative leads. Blood traces are commonly found at crime scenes and can provide substantial information about the event and individuals involved. Bloodstains are a primary source of DNA evidence and can be used to conclusively identify the donor of the blood. The pattern of a blood spatter can indicate the type of the violent action. Moreover, determining the time since deposition (TSD) of bloodstains is of significant value for two reasons. First, TSD could help to estimate the time of the crime. Second, if crime scenes contain multiple sets of bloodstains, the TSD should allow for the selection of bloodstains relevant to the crime, and therefore reduce the number of samples that should be collected, documented, and processed. The latter is of special importance because every crime laboratory in the United States has a significant backlog of DNA evidence.
Raman spectroscopy has proven to be a rapid, nondestructive, and specific technique that is capable of identifying and analyzing bloodstains down to a single red blood cell (1). We have combined Raman spectroscopy with chemometrics to discriminate bloodstains from other body fluid traces (2–4), perform species identification (5–8), and determine phenotypic traits of human donors such as sex (9), race (10), age group (11). It is of special importance for practical forensic purposes that the Raman spectroscopic method for bloodstain identification is confirmatory and “immune” from environmental false positives (12). The availability of portable and handheld Raman instruments makes bloodstain analysis within the first minutes of the crime scene discovery a reality.
The near infrared (NIR) Raman spectra of blood, when excited at 785 nm, are dominated by a contribution from hemoglobin. When blood exits the body, it is red in appearance, but as it dries, bloodstains darken. This red-to-brown color change occurs as a result of the autoxidation of hemoglobin into oxyhemoglobin (oxyHb). As the bloodstain aging process continues, oxyHb is converted into methemoglobin (metHb). Once in this state, the hemoglobin molecule is no longer able to bind oxygen. Finally, when blood is outside the body for an extended period of time, metHb will form aggregates of hemichrome. Raman spectroscopy detects these changes in hemoglobin over time and provides the basis for determining the TSD of bloodstains. In our initial study, we developed an accurate regression model for bloodstain aging for the first week since the deposition (13). Doty and associates were able to monitor the autoxidation process of hemoglobin by following the intensity changes of the Raman bands at 377 and 420 cm-1. These bands are markers for metHb and oxyHb, respectively. Changes to these two bands began after one hour of deposition, with a relative increase in the 377 cm-1 peak and a decrease in the 420 cm-1 peaks. Using partial least squares regression (PLSR), the TSD of bloodstains was predicted with an accuracy rate of 0.99 and when cross-validated the accuracy rate was 0.97 for up to one week.
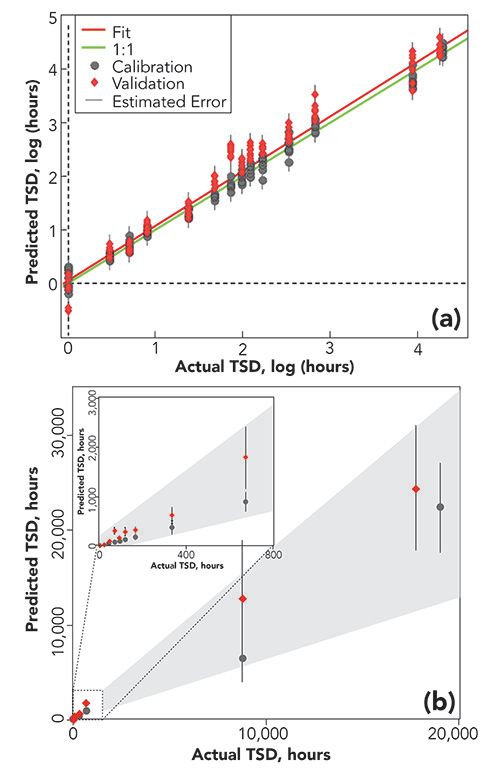
To ascertain the full capabilities of the method, we continued to monitor the Raman spectra that allowed for building a regression model to determine the TSD for up to two years (Figure 1) (14). There were evident changes to Raman spectra even after two years of aging. As a result of heme aggregation during aging, the fluorescence interference continuously decreased the quality of the Raman spectra. This is because of the changes in the electronic structure of heme as it ages (15). The intensity of the Raman bands decreased, and the peaks broadened after a prolonged (about a year or longer) TSD. These changes were tentatively attributed to the advanced degradation of hemoglobin. Using the PLSR model, Doty and associates were able to predict the TSD of bloodstains up to two years with 70% accuracy. Some might speculate that this error is too large for practical application, but the method definitively differentiates between bloodstains that were present at crime scene for a few hours, a few days, a few weeks, a few months or over a year. Just as Raman spectroscopy has proven to be a valuable tool for discriminating between body fluids, this technique has the potential to be a one-step analysis method to both identify a biological stain as blood and approximate its TSD.
Figure 1: PLSR plots on (a) logarithmic scale and (b) normal time scale for TSD predictions vs. measured (actual) TSD of bloodstains aged up to two years showing both calibration (male, grey circles) and validation (female, red diamonds) datasets. The red and green lines in panel (a) represent the actual and ideal 1:1 fit, respectively. The inset in panel (b) shows the predictions up to one month more clearly. Reprinted from reference (11) Copyright 2017, with permission from Elsevier.

Despite the promising progress made toward creating an easy-to-use method for determining the TSD of bloodstains, there is still more work that needs to be done. Doty and associates reported on bloodstains that were aged in a laboratory environment at ambient conditions. There are infinite varieties of potential conditions and environments in which forensic biological evidence can be discovered that can affect the blood aging process. Developing regression models for Raman spectroscopic signatures of bloodstains aging at various “extreme” environments appears to be the next logical step moving forward. The combination of the accumulated data into a single universal model applicable for all common environments would be ideal for practical application. The capability to create this universal model has yet to be demonstrated. This is problematic because of a combined complexity of 1) gathering more comprehensive spectral characteristics of bloodstains exposed to various “extreme” environments, and 2) the statistical analysis allowing for an accurate accounting of a specific environmental effect on the bloodstain aging. Overcoming these problems would allow for the building of a comprehensive (universal) model for predicting TSD of bloodstains found in any common environment. Such a development would be a great step forward in solving the perpetual problem of determining the TSD of a bloodstain for forensic purposes.
Acknowledgment and Disclaimer
This project was supported by Award No. 2017-DN-BX-0135 awarded by the National Institute of Justice, Office of Justice Programs, U.S. Department of Justice. The opinions, findings, and conclusions or recommendations expressed in this publication are those of the authors and do not necessarily reflect those of the U.S. Department of Justice.
References
- C.K. Muro and I.K. Lednev, Anal. Bioanal. Chem. 409(1), 287–293 (2017).
- V. Sikirzhytski, A. Sikirzhytskaya, and I.K. Lednev, Forensic Sci. Int. 222(1–3): 259–265 (2012) .
- A. Sikirzhytskaya, V. Sikirzhytski, and I.K. Lednev, J. Biophotonics 7(1-2), 59–67 (2014).
- C.K. Muro, et al., Forensic Chem. 1, 31–38 (2016).
- K. Virkler and I.K. Lednev, Anal. Chem. 81(18), 7773–7777 (2009).
- G. McLaughlin, K.C. Doty, and I.K. Lednev, Anal. Chem. 86(23), 11628–11633 (2014).
- G. McLaughlin, K.C. Doty, and I.K. Lednev, Forensic Sci. Int. 238, 91–95 (2014).
- K.C. Doty, and I.K. Lednev, Forensic Sci. Int. 282, 204–210 (2018).
- A. Sikirzhytskaya, V. Sikirzhytski, and I.K. Lednev, Anal. Chem. 89(3), 1486–1492 (2017).
- E. Mistek, et al., Anal. Chem. 88(15), 7453–7456 (2016) .
- K.C. Doty and I.K. Lednev, ACS Central Sci. 4(7), 862–867 (2018).
- R. Rosenblatt, et al., Forensic Chem. 16, 100175 (2019).
- K.C. Doty, G. McLaughlin, and I.K. Lednev, Anal. Bioanal. Chem. 408(15), 3993–4001 (2016).
- K.C. Doty, C.K. Muro, and I.K. Lednev, Forensic Chem. 5, 1–7 (2017).
- P. Lemler, et al., Anal. Bioanal. Chem. 406(1), 193–200 (2014).
Alexis Weber is a PhD student in the Chemistry Department at the University at Albany, State University of New York (SUNY).

Igor K. Lednev is a professor of chemistry at the University at Albany, SUNY. Direct correspondence about this article to ilednev@albany.edu

Exoplanet Discovery Using Spectroscopy
March 26th 2025Recent advancements in exoplanet detection, including high-resolution spectroscopy, adaptive optics, and artificial intelligence (AI)-driven data analysis, are significantly improving our ability to identify and study distant planets. These developments mark a turning point in the search for habitable worlds beyond our solar system.
New Telescope Technique Expands Exoplanet Atmosphere Spectroscopic Studies
March 24th 2025Astronomers have made a significant leap in the study of exoplanet atmospheres with a new ground-based spectroscopic technique that rivals space-based observations in precision. Using the Exoplanet Transmission Spectroscopy Imager (ETSI) at McDonald Observatory in Texas, researchers have analyzed 21 exoplanet atmospheres, demonstrating that ground-based telescopes can now provide cost-effective reconnaissance for future high-precision studies with facilities like the James Webb Space Telescope (JWST) (1-3).