A Heated ATR Single Reflection Diamond ATR Study of an Aqueous Sugar Slurry
Application Notebook
ATR is the most widely used FT-IR sampling technique, and is frequently used for quantitative, qualitative, and kinetic studies. New high-throughput accessories are expanding the scope of experiments by providing improved signal-to-noise performance. This application note demonstrates the potential of using a new high-throughput single-reflection diamond ATR accessory to study reaction kinetics by examining the heating of an aqueous sugar slurry.
Experimental
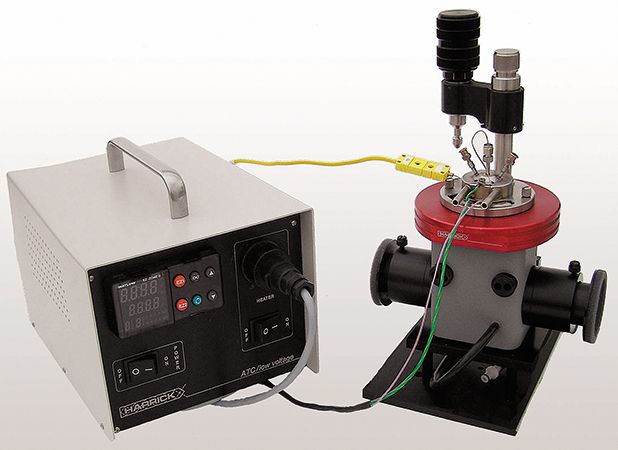
Infrared spectra were collected on an FT-IR spectrometer equipped with the Harrick DiaMaxATR™ single-reflection diamond ATR accessory with its Temperature Controlled Liquid Cell (Figure 1), Temperature Controller, and TempLink Software. The system was purged to remove water vapor and CO2. Spectra were collected at 8 cm-1 resolution and signal-averaged over 32 scans. A background spectrum was collected at ambient temperature. Confectioner's sugar was mixed with a small amount of water to generate a slurry and injected into the liquid cell. A sample spectrum was collected at ambient temperature. Then the cell was heated to 100 °C and additional sample spectra were collected at 2 min intervals.

Figure 1: The DiaMaxATR™ with its Temperature Controlled Liquid Cell and associated Temperature Controller.
Results and Discussion
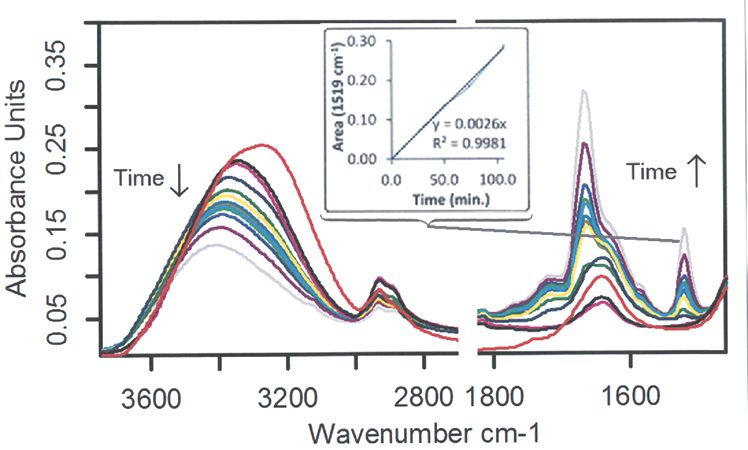
Figure 2 shows the resulting spectra. Initially, there is a broad band centered around 3276 cm-1 and another at 1640 cm-1, both of which are attributable primarily to water with a smaller component from the O-H stretches in confectioner's sugar, which is mainly sucrose. There are also bands in the 900–1150 cm-1 region from the C-O and C-C stretches and bands in the 1400–1200 cm- 1 region due to the O-C-H, C-C-H, and C-O-H bends in the sugars, as expected.

Figure 2: ATR spectra of sugar slurry over time at 100 °C, including plot of peak area versus time at 1519 cm-1.
Upon heating, the bands attributable to the O-H stretch and H-O-H bend both change shape, as the water evaporates and the primary contribution comes from the bound hydroxyl groups. The bands in the 900–1200 cm-1 region also change, as the sucrose breaks down into glucose and fructose which in turn react to become small aromatic compounds and a brown-colored polymer.
The band at 1519 cm-1 is attributed to aromatic compounds and grows as a function of time. The rate of formation of the aromatic compounds can be determined by plotting the peak area over time. Fitting the curve gives a linear relationship, where the peak area = 0.0026 x (time in minutes) with an R2 of 0.9981. Given the complexity of the reaction, it is somewhat surprising that the data could be fit easily with a linear curve but this may be due to the time scale and temperature used for the measurements.
Conclusion
As seen herein, high-throughput, single-reflection ATR is valuable for examining thermally induced changes in materials. In the case of the heating an aqueous sugar slurry, it can be used to extract information about the kinetics of the reaction. Further analysis is possible to obtain more rigorous identification of the heat-induced structural changes.

Harrick Scientific Products, Inc.
141 Tompkins Ave., Box 277, Pleasantville, NY 10570
tel. (914) 747-7202, fax (914) 747-7409
email: info@harricksci.com, Website: www.harricksci.com
