Pharmaceutical Ingredient Uniformity Determination Using LIBS
Application Notebook
The uniform blending of active pharmaceutical ingredients (API) and excipients is critical to product quality. The homogeneity of ingredients within a batch or tablet must often be rapidly determined with minimal sample modification.
In this experiment, laser-induced breakdown spectroscopy (LIBS) analysis was used to rapidly monitor batch powder and tablet homogeneity. The distribution of pharmaceutical ingredients as a function of mixing time was monitored using the percent relative standard deviation (%RSD) of LIBS spectra. In addition, drug distribution within a non-uniformly blended tablet was assessed using LIBS spatial mapping.
Samples
Magnesium stearate, which acts as a lubricant, and croscarmellose sodium, a disintegrant, were used as pharmaceutical additives. Chlorpheniramine maleate, a pharmaceutical with antihistamine activities, was used as the API.
The API and excipients were mixed using a rotary blender, and analyzed using LIBS.
Results
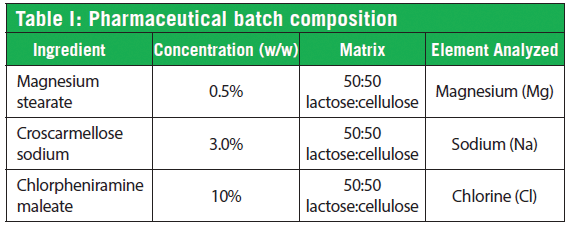
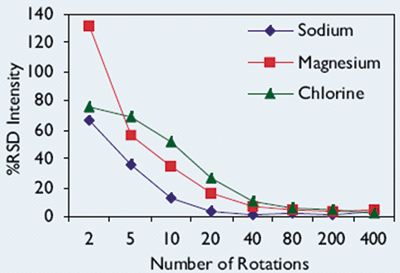
In Figure 1, samples (Table I) were mixed in a low shear blender at 38 rpm. After a specific number of rotations, five samples were collected from different locations of the batch and analyzed with LIBS.
The results from Figure 1 show that the percent relative standard deviation (% RSD) of spectral signal is a useful indicator of sample uniformity. Prior to about 80 rotations, it can be seen that there is still some non-uniformity in the blend, whereas more than 80 rotations showed %RSDs which stabilized-indicating uniformity.

Table I: Pharmaceutical batch composition
Several factors impact blend uniformity, including particle size and shape, electrostatic interactions, moisture content and particle surface characteristics. Uniformity analyses should be conducted routinely on blends to ensure quality-and with LIBS, this is rapidly and easily accomplished.
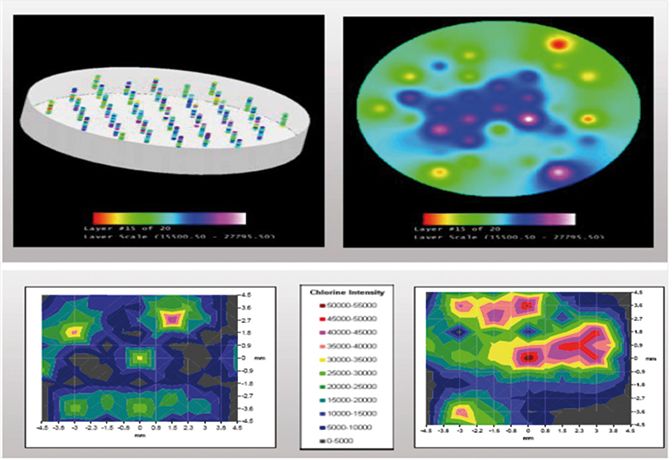
In Figure 2, Chlorpheniramine maleate (Cl) was analyzed throughout two non-uniformly blended tablets by monitoring 43 separate locations. A surface plot of chlorine intensity collected after 13 pulses is displayed in the XY plane to show the degree of ingredient variation within a tablet.

Figure 1: LIBS analysis of pharmaceutical blend uniformity.
The results in Figure 2 demonstrate the ease with which final tablets can be monitored with LIBS to show API spatial uniformity.

Figure 2: LIBS analysis of drug distribution in non-uniformly blended tablets.
Conclusions
LIBS was shown to readily determine the minimum rotations or blend time required to produce a homogenous batch, and hence can improve production efficiency for pharmaceutical blending. Monitoring % RSD of LIBS spectra can also be used for quality assurance and blend control, as a RSD value below 5% indicates homogenous blends. Analysis of drug distribution on a tablet could also be determined using LIBS, which is useful for end-of-line product quality assurance checks.
References
(1) Y. Mouget, M. Tourigny, P. Gosselin, and S. Bechard, "Three Dimensional Representation of Tablet Content Uniformity by LIBS," presented at Pittcon, 2002.
(2) Y. Mouget, M. Tourigny, P. Gosselin, and S. Bechard, Eastern Analytical Symposium, (2001).
TSI, Inc.
500 Cardigan Rd., Shoreview, MN 55126
tel. (800) 874-2811
Website: www.tsi.com
