ICP-MS with Autodilution and Autocalibration for Implementing the New USP Chapters on Elemental Impurities
Special Issues
This article describes the use of an in-line, autodilution, and autocalibration sample delivery system coupled to an inductively coupled plasma–mass spectrometry system to analyze a group of over-the-counter pharmaceutical products.
This article describes the use of an in-line, autodilution, and autocalibration sample delivery system coupled to an inductively coupled plasma–mass spectrometry system to analyze a group of over-the-counter pharmaceutical products. The study will follow the method protocol outlined in the recently approved USP Chapters <232> and <233> on the determination of elemental impurities in the major four drug delivery systems.
The standard method for measuring elemental impurities in pharmaceutical products has been based on a 100-year-old "Heavy Metals Test," described in Chapter <231> of the United States Pharmacopoeia (USP)–National Formulary (NF) (1). This test involves precipitation of the metal sulfide in the sample, and compares the intensity and color of the precipitate to a lead standard. Even though this test has been used for more than 100 years, it is well-accepted that it is prone to error because it is not specific to any particular heavy metal, it suffers from quite severe matrix interferences, it is prone to very low recoveries, and it requires a skilled analyst to interpret the color correctly. For this reason, four years ago the USP organization set up an expert committee to investigate the viability of alternative analytical approaches to get around all these problems and replace Chapter <231> with a more robust and reliable instrumental technique.
In April 2012, USP came out with a brand new inductively coupled plasma–optical emission spectrometry (ICP-OES) and inductively coupled plasma–mass spectrometry (ICP-MS) method to determine a group of metallic contaminants in pharmaceutical products. This method was summarized in General Chapter <232> entitled "Elemental Impurities – Limits" and Chapter <233> entitled "Elemental Impurities – Analytical Procedures,", which will be published in the Second Supplement to USP 35–NF 30 on December 1, 2012 (2). Pharmaceutical stakeholders will then have until May 2014 to implement these changes and be consistent with the new method described in Chapters <232> and <233>.
This study focuses on the practical benefits of an ICP-MS system coupled to an in-line, autodilution, and autocalibration sample delivery system to determine a group of toxicologically relevant elements in various pharmaceutical products. It provides an overview of the USP methodology with particular emphasis on the impurity levels and the recommended analytical procedure. It also analyzes some common pharmaceutical products covering the major drug delivery systems of oral, intravenous, and inhalational, and presents performance figures of merit for the system based on the USP validation protocol for the method.
Elemental Impurities in Pharmaceutical Products
Chapter <232> specifies the list of elements and their toxicity limits, defined as maximum daily doses of the different drug categories — oral, parenteral (intravenous injection), inhalation, and large-volume parenteral, whereas Chapter <233> deals with the sample preparation, analytical procedure, and quality control (QC) validation protocol for measuring the elements, including the choice of either inductively coupled plasma–atomic emission spectroscopy (ICP-AES), ICP-MS, or the use of an alternative technique as long as it is fully validated to be acceptable and equivalent to the plasma-based procedures described in the method.
Chapter <232> Elemental Impurities — Limits
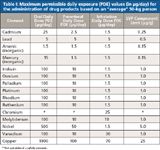
Table I shows the maximum permissible daily exposure (PDE) values (in micrograms per day) for the administration of drug products based on an "average" 50-kg person (3). The toxicity of an elemental impurity is related to its bioavailability. The extent of "chronic" exposure has been determined for each of the elemental impurities of interest for three routes of administration: oral, intravenous (parenteral), and inhalational. When the daily dose of an injection is >100 mL, the amount of element must be controlled through the individual components used to produce the drug product. This is known as the large-volume parenteral (LVP) component limit (in micrograms per gram) and is shown in the last column of Table I.

Table I: Maximum permissible daily exposure (PDE) values (in μg/day) for the administration of drug products based on an "average" 50-kg person
This chapter also defines the maximum limit of the elemental impurities based on the material's final use and dosage. This is to ensure the drug manufacturers determine an acceptable level of impurity in the drug based on a typical maximum daily dosage of ≤10 g/day. These values are also used to take into account the sum of all the individual chemicals, active ingredients, and excipient compounds (fillers) used to produce the final drug product, which is intended to be the basis of discussions between the drug manufacturer and the suppliers of the raw materials.
Chapter <233> Elemental Impurities — Analytical Procedure
This chapter describes the ICP-OES and ICP-MS analytical procedures (including sample preparation), together with the validation protocol for the determination of the elemental impurities in the drug products described earlier (4,5).
ICP-MS Procedure: To ensure the method is working correctly, a summary of the QC/QA validation protocols is given below.
- Target (element) limits (known as "J" values) defined as the acceptance value for the elemental impurity being evaluated, based on the weight, number of doses, and frequency of taking or administering the drug.
- Calibration using two matrix-matched calibration standards and a matrix-matched blank. For each element, the high standard is twice (2J) the target limit and the low standard is half (0.5J) the target limit.
- Samples are diluted so the concentration does not exceed 2× (2J) the target limits.
- Samples are analyzed according to the manufacturer's suggestions for instrumental conditions and analyte masses, taking appropriate measures to correct for matrix-induced polyatomic interferences.
- A collision–reaction cell may be used to reduce the polyatomic spectral interferences.
- A series of QC validation protocols, including spike recovery, accuracy, precision, and stability tests are followed to ensure the method is generating credible data.
Sample preparation can be approached in four different ways. However, careful consideration should be given to the choice of acids because of the potential for matrix-induced spectral interferences generated in the ICP.
- Analyze neat, undiluted sample, if the sample is in suitable liquid form.
- Dilute the sample in an acidified aqueous solution if the sample is soluble in water.
- If the sample is not soluble in water, dilute it in an appropriate organic solvent.
- Use closed-vessel microwave acid digestion for insoluble samples.
Instrumentation
This study was performed using a NexION 300X ICP–MS system (PerkinElmer, Inc.) coupled with a prepFAST (Elemental Scientific Inc.) automated in-line autodilution and autocalibration system. The ICP-MS system has been described in the literature but is basically a single-channel version of PerkinElmer's Universal Cell Technology, which enables the instrument to be used in either the collision (KED) mode or the reaction (DRC) mode using one cell gas, in addition to the standard or normal ICP-MS mode (6).

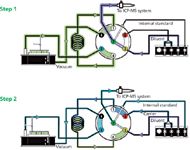
Figure 1: Schematic of the sample delivery system (prepFAST) illustrating a two-step process of loading sample into a loop and in-line dilution. During syringe reset in step 1, the loop is rapidly (vacuum) rinsed and loaded with the sample while the nebulizer and spray chamber are rinsed with carrier. In step 2, the sample is injected into the ICP-MS system along a flow path where in-valve addition and mixing of diluent (port 3) and internal standard (port 7) occurs.
The autodilution system is fully integrated with the ICP-MS system for in-line autodilution of sample and stock standard solutions (7). Solutions are rapidly and reproducibly vacuum loaded from each autosampler location into a sample loop. This process is shown in Figure 1. Dilution, internal standard addition, and mixing all occur in line in the mixing valve. The system's high-resolution syringe-based delivery of all solution flow rates ensures precise and accurate dilution factors while maintaining a constant total sample flow rate. The system is used to autocalibrate the ICP-MS system and perform in-line dilutions of samples. Some of the benefits of this approach for the demands of a high-throughput pharmaceutical laboratory include
- Real time dilutions up to 200-fold
- Dilution in the valve head
- Elimination of the errors associated with manual dilution steps
- Reduction of reagent volumes required for high dilution factors
- Rapid uptake and washout
- Reduced risk of contamination
Samples Used for This Evaluation
The samples investigated are shown in Table II, representing the three different categories of pharmaceutical products described earlier (oral, inhalation, and large volume parenteral).

Table II: List of medications evaluated in this study
Sample Preparation
For all medications, 1 g of sample was taken and brought into solution with an acid mixture of 2% HNO3 and 0.5% HCl. The arthritis pain medication was crushed into a powder and digested in a Multiwave 3000 microwave digestion system (PerkinElmer, Inc.) and made up to a final volume of 50 mL. The OTC cold and flu remedy was dissolved in the acid mixture, warmed on a hot plate, and made up to 50 mL. Both the allergy medication and the lactated Ringer's solution were already in liquid form, so they were prepared by diluting 1 g to a final volume of 50 mL. The oral medications were further diluted 10-fold in-line, using the autodilution system, to a final dilution factor of 500:1. It's worth emphasizing that if many different medications are being analyzed with large variations in daily dosage, the target values (J) change, requiring additional sample dilution or a new calibration graph. One of the major benefits of the in-line autodilution approach is that it can be done in a fully automated manner, without the need to make additional manual dilutions.

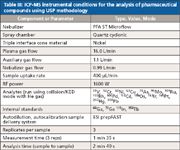
Table III: ICP-MS instrumental conditions for the analysis of pharmaceutical compounds using USP methodology
Calibration
Depending on the target values (J) for the analyte of interest and the sample preparation technique used for the different drug compounds, USP-defined calibration solutions at half (0.5J) and twice (2J) the target values are required. Table V (on-line) shows the PDE values (in micrograms per day) for the oral drugs and target concentration values (in micrograms per liter) calculated based on a daily dose of 10 g/day and a final sample dilution of 500:1 (10-fold in-line dilution of 1 g/50 mL). It can be seen that correlation coefficients for all calibration curves generated by in-line dilution (2% HNO3 and 0.5% HCl) of a single stock standard are 0.999 or better.
Results
Chapter <233> also defines a number of QC–QA protocols to validate the method, which include the following tests:
- Accuracy of the method by spiking the material under investigation at appropriate concentration levels related to the target limits and measuring the % recovery.
- Repeatability of the method by measuring six independent samples of the material under investigation, spiked at the target limits defined and measuring the recovery and precision of the measurements.
- Ruggedness of the method by carrying out repeatability measurement testing by analyzing either on different days, with a different instrument, or by a different analyst, and measuring the recovery and precision of the measurements.
- Stability of the method by measuring an appropriate concentration level of spike relative to the target limits, before and at the end of analyzing a batch of samples.
All four medications were first analyzed in triplicate for their trace element concentrations. Tables V, VI, VII, and VIII (all on-line) show the elemental contaminants found in the arthritis pain drug, the cold and flu remedy, the allergy spray, and lactated Ringer's solution, respectively, together with spike recoveries at 80% of the target limits (0.8J). The USP-accepted criteria for this test is 70–150% recovery for each of the target elements. In each of the tables, the concentration limits (in micrograms per gram) for the maximum daily dose of each of the drug products are also given, together with method detection limit (MDL) in the original drug (based on the sample weight and the dilution factor used). This is intended to show how much lower the detection capability of the method is compared with maximum elemental contaminant levels.
Validation Protocol
For clarity, it was decided to take just one of the medications through the rest of the QC validation testing. The cold and flu remedy was selected for this part of the study. The results for the repeatability section of the test are given in Table X (on-line), which shows the % recovery and % RSD of six different samples of the cold and flu remedy spike at 1J and then taken through the all sample preparation and dilution steps. The accepted criteria for this test is <20% RSD for each target element.
The long-term stability of the method is illustrated in Figure 2, which shows a 7.5-h stability plot of all 15 analytes spiked at 1J, without the use of internal standardization. The USP does not specify the length of the stability measurement test, but does say that the drift should be assessed before and after the analysis of all the sample solutions. The 7.5-h time frame of this test was not only intended to approximate running samples for a typical working day, but also to understand the drift characteristics of the instrument without using any kind of internal standard signal compensation. The USP acceptance criterion for this test, with internal standardization, is ±20%.

Figure 2: Long-term (7.5 h) drift plot for the oral coldâflu remedy with all 15 analytes spiked at 1J.
Conclusion
This study has shown how an ICP-MS system coupled with an automated in-line autodilution and autocalibration sample delivery system can be applied to the analysis of a group of OTC medications according to the new USP Chapters <232> and <233> on elemental impurities in pharmaceutical products. It was demonstrated that the technique can comfortably achieve the PDE limits defined in Chapter <232> for the four major modes of drug delivery. The data generated in this study also confirmed that the instrument has easily met the quality control and validation protocols described in Chapter <233>.
In addition, the use of an in-line autodilution and autocalibration sample delivery system makes the approach well-suited for the demands of a high-throughput pharmaceutical laboratory by automating the labor-intensive steps of calibration standard, sample dilution, and internal standard addition. Furthermore, it lowers the risk of human error and contamination of the sample, standards, or blanks, because all these functions are being carried out in-line, with no manual intervention by the analyst.
On-Line Edition
Tables IV–X are available on-line at: spectroscopyonline.com/ThomasICP
References
(1) General Chapter <231> "Heavy Metals Test," in United States Pharmacopeia (USP) 35–National Formulary (NF) 30 (United States Pharmacopeial Convention, Rockville, Maryland 2011).
(2) United States Pharmacopeial Convention web site. "Compendial Approvals for USP35–NF30, Second Supplement."
(3) General Chapter <1151> "Pharmaceutical Dosage Forms – Routes of Administration," in USP 35–NF 30 (United States Pharmacopeial Convention, Rockville, Maryland, 2011).
(4) General Chapter <730> "Plasma Spectrochemistry Method," in USP 35–NF 30 (United States Pharmacopeial Convention, Rockville, Maryland, 2011).
(5) General Chapter <1225> "Validation of Compendial Procedures," in USP 35–NF 30 (United States Pharmacopeial Convention, Rockville, Maryland, 2011).
(6) E. Pruszkowski and C. Bosnak, The Analysis of Drinking Waters by U.S. EPA Method 200.8 Using the NexION 300X ICP-MS in Standard and Collision Modes, PerkinElmer Application Note.
(7) PrepFAST On-Line Auto-dilution and Auto-Calibration Sample Delivery System: Elemental Scientific Inc. Application Note, http://www.icpms.com/products/prepfast.php.
Lee Davidowski and Ewa Pruszkowski are with PerkinElmer, Inc. Austin Shultz and Kyle Uhlmeyer, are with Elemental Scientific, Inc. Robert Thomas is a consultant and science writer specializing in trace elemental analysis. Direct correspondence to: Ewa.Pruszkowski@perkinelmer.com.

Best of the Week: AI and IoT for Pollution Monitoring, High Speed Laser MS
April 25th 2025Top articles published this week include a preview of our upcoming content series for National Space Day, a news story about air quality monitoring, and an announcement from Metrohm about their new Midwest office.
LIBS Illuminates the Hidden Health Risks of Indoor Welding and Soldering
April 23rd 2025A new dual-spectroscopy approach reveals real-time pollution threats in indoor workspaces. Chinese researchers have pioneered the use of laser-induced breakdown spectroscopy (LIBS) and aerosol mass spectrometry to uncover and monitor harmful heavy metal and dust emissions from soldering and welding in real-time. These complementary tools offer a fast, accurate means to evaluate air quality threats in industrial and indoor environments—where people spend most of their time.