The Importance of Rigorous Instrument Calibration for Successful Sample Identification and Instrument-to-Instrument Reproducibility
Special Issues
Over the last few years, Raman has made the transition from a technique used solely in a research environment to one that is now seen as a powerful tool for routine analytical use. Raman spectroscopy now is used widely for sample identification in fields as diverse as forensics, QA/QC, art conservation, defect analysis, and failure analysis. This has imposed new demands on the technique for reproducibility and stability. Successful sample identification takes advantage of the extensive spectral libraries and sophisticated search algorithms that have been developed in recent years. However, in order to be able to cross-correlate experimental and library spectra with any degree of confidence, it is critical that the Raman spectrometers used to collect the spectra are calibrated rigorously. It is likewise critical for QC applications that spectra collected on one instrument can be compared reliably with spectra collected on other instruments and that results remain constant when collected over extended periods..
There are three major sources of nonreproducibility in dispersive Raman spectroscopy. These include inadequate x-axis (shifted wavenumber) calibration, plus two sources of y-axis variability: the wavelength dependence of the silicon CCD detector response and variations in excitation laser power output. This article discusses the impact of these sources of nonreproducibility and strategies to address them.
x-Axis Calibration
Accurate x-axis calibration is particularly important in ensuring accurate sample identification using library searching. Some of the spectra in library collections can be very similar, so even small shifts in band positions due to calibration inaccuracies might be sufficient to compromise the search.
There are two causes for nonlinearity in wavelength dispersion across a detector by the spectrograph grating. The first is inherent in the sine function that describes wavelength dispersion, while the second is the result of aberrations that are present to some degree in all spectrograph optical designs. Theoretically, a one- or two-point calibration should be sufficient to compensate for the first cause of nonlinearity; however, multipoint calibration is required to correct adequately for aberrations and to permit spectrograph-to-spectrograph comparisons. The second cause lies in the slight variations in excitation laser frequency that occur over the course of instrument use.
Procedures for x-axis calibration vary depending upon the commercial vendor and can range from a simple single-point calibration to sophisticated, software-controlled, multipoint calibration algorithms. Ideally, calibration should be fully automated by software. Wavelength calibration should employ multiple, precisely characterized lines in the emission spectrum from a neon source to correct for the wavelength nonlinearity of the spectrograph, while multiple bands in the Raman spectrum of a polystyrene standard are ideal for calibrating the excitation laser frequency.
Calibration and Library Search Results
An example of a successful library search is shown in Figure 1. The spectrum was collected using a Thermo Scientific DXR Raman microscope (Thermo Fisher Scientific), which had been fully calibrated using well-spaced, multiple neon emission bands to calibrate the spectrograph and a multipoint polystyrene Raman spectrum to calibrate the excitation laser. The OMNIC software suite calculates and applies appropriate quadratic functions to optimize calibration across the full Raman spectrum. Figure 1 shows that the caffeine spectrum gave a 99.8% match with a standard library spectrum.
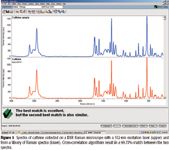
Figure 1
The effects of inadequate calibration on the results of a library search can be demonstrated by distorting the caffeine spectrum artificially.
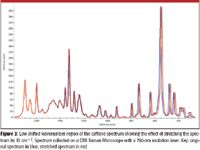
Figure 2
Compression or Stretching
Apparent stretching or compression of the spectrum is likely to result if the spectrograph x-axis calibration does not use a sufficient number of widely spaced neon calibration bands and is thus unable to model dispersion across the entire spectrum. Figure 2 illustrates the effect of stretching the low-shifted wavenumber end of the caffeine spectrum. The effect of compression or stretching on the results of a library search is shown in Table I. The results show that small amounts of this type of distortion resulting from inadequate calibration still permit the search algorithm to identify the sample as caffeine, albeit with lower confidence levels. Larger distortions result in poor matches and misidentification.

Table I: The effect of compressing or stretching a caffeine spectrum on the percent match with a standard caffeine spectrum in a Raman spectral library.
Lateral Displacement
Lateral displacement of the spectrum along the x axis as a result of poor x-axis and poor laser frequency calibration degrades the quality of the library search (Table II). Displacement of the caffeine spectrum by 2.5 cm–1 or less still permits correct identification, although with less certainty. Larger displacements are likely to result in sample misidentification.
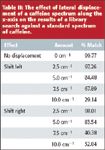
Table II: The effect of lateral displacement of a caffeine spectrum along the x-axis on the results of a library search against a standard spectrum of caffeine.
y-Axis Calibration
Intensity Correction
Successful library searches also are dependent upon accurate compensation for wavelength-dependent variations in detector response. This is most critical when using a 780- or 785-nm excitation laser, because the high-shifted wavenumber end of the Raman spectrum falls into the region of the wavelength spectrum where the silicon CCD detector response falls off rapidly. Intensity correction should use a standardized light source to correct for CCD pixel-to-pixel variations and to compensate for the decline in the silicon CCD detector response at longer wavelengths.
The need for intensity correction is obvious in the C-H stretch region (2800–3200 cm–1) of the caffeine spectra collected with an excitation laser wavelength of 780 nm and shown in Figure 3. For sample identification or QC purposes, reference spectra might have been collected either at shorter excitation wavelengths, or by using Fourier-transform (FT) Raman spectroscopy. In both methods, detector wavelength dependence does not occur, and the lack of intensity correction (Figure 3b) will have a marked impact. Any method that depends upon the comparison of peak heights at the low- and high-shifted wavenumber regions of the spectrum also will be impacted negatively.
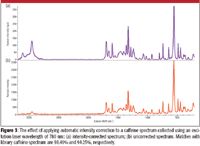
Figure 3
Lack of intensity correction also affects the results of library searches. The match between the intensity-corrected spectrum and the library caffeine spectrum is 98.5%. In the absence of intensity correction, the match confidence falls to 94.3%.
Laser Power
Raman signal intensity is proportional to excitation laser power. However, it has been observed that lasers with nominally identical laser power specifications can vary quite significantly in laser power output, even when the laser is new. As lasers age, power output declines significantly, further adding to Raman signal intensity variations from instrument to instrument and from laser to laser.
Most commercially available instruments make no attempt to correct for this source of nonreproducibility. Instruments might include a series of neutral density filters (NDF) that can be inserted into the laser beam to reduce laser intensity at the sample; however, the user is limited to specifying a percentage of total power and is unable to control the actual power delivered. To address this need, the design for the Thermo Scientific DXR Raman microscope and DXR SmartRaman spectrometer has incorporated a laser power regulator. This device uses a variable NDF and a calibrated power meter to measure and adjust the power delivered to the sample, thereby permitting the user to specify the absolute amount of power in milliwatts. This permits the instruments to deliver reproducible laser power and to be able to compensate for laser-to-laser variability. Because the power regulator is set up to limit the amount of power delivered to be somewhat less than the maximum laser power specified by the laser manufacturer, the user is assured that the instrument will deliver laser power reproducibly to the maximum specified over the lifetime of the laser. This is illustrated in Figure 4.
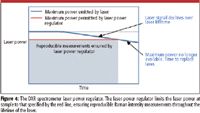
Figure 4
Conclusions
With the advent of automated, easy-to-use instrumentation, Raman spectroscopy is gaining acceptance rapidly as a valuable analytical tool. It is particularly useful for compound identification now that extensive, diverse Raman spectral libraries are widely available. In the past there had been a belief that it was difficult to perform successful cross-correlation searches on spectra that had been collected on different instruments. The results in this article show that while distortions resulting from inadequate calibration will compromise library searches, as long as Raman spectrometers have been calibrated rigorously using multipoint calibration routines, sample identification using library searching will become routine.
Other sources of nonreproducibility include lack of compensation for the wavelength dependence of the silicon CCD detector response and uncompensated variation in excitation laser output. Addressing all such sources will enable Raman spectroscopy to gain its place rapidly as a routine QC tool.
Patricia Henson is Raman Product Manager with Thermo Fisher Scientific.

AI-Powered SERS Spectroscopy Breakthrough Boosts Safety of Medicinal Food Products
April 16th 2025A new deep learning-enhanced spectroscopic platform—SERSome—developed by researchers in China and Finland, identifies medicinal and edible homologs (MEHs) with 98% accuracy. This innovation could revolutionize safety and quality control in the growing MEH market.
New Raman Spectroscopy Method Enhances Real-Time Monitoring Across Fermentation Processes
April 15th 2025Researchers at Delft University of Technology have developed a novel method using single compound spectra to enhance the transferability and accuracy of Raman spectroscopy models for real-time fermentation monitoring.
Nanometer-Scale Studies Using Tip Enhanced Raman Spectroscopy
February 8th 2013Volker Deckert, the winner of the 2013 Charles Mann Award, is advancing the use of tip enhanced Raman spectroscopy (TERS) to push the lateral resolution of vibrational spectroscopy well below the Abbe limit, to achieve single-molecule sensitivity. Because the tip can be moved with sub-nanometer precision, structural information with unmatched spatial resolution can be achieved without the need of specific labels.