Improved Measurement Characteristics of Elemental Compositions Using Laser- Induced Breakdown Spectroscopy
Spectroscopy
Pages 22–35 Rapid detection of coal and fly ash is significant to improve the efficiency of thermal power plants and reduce environmental pollution. Given its fast response, high sensitivity, real-time, and noncontact features, laser-induced breakdown spectroscopy (LIBS) has a great potential for on-line measurement in these applications. The direct measurement of particles and gases using LIBS was studied, and the method was shown to be effective for this application.
Pages 22–35
Rapid detection of coal and fly ash is significant to improve the efficiency of thermal power plants and reduce environmental pollution. Given its fast response, high sensitivity, real-time, and noncontact features, laser-induced breakdown spectroscopy (LIBS) has a great potential for on-line measurement in these applications. The direct measurement of particles and gases using LIBS was studied, and the method was shown to be effective for this application.
Coal provides the largest share of world electricity generation. Operating characteristics of coal-fired boilers are heavily influenced by factors such as differences in fuel properties and combustion conditions. To achieve optimal operation of multiple coal-fired boilers, it is necessary to accurately understand the state of combustion and to adjust the control parameters. The coal and fly ash contents, especially unburned carbon in fly ash, are the major factors of efficient combustion. Fly ash produced during coal combustion is one of the sources of fine particles. The fine particles containing toxic trace elements also affect human health (1). The measurement of fine particles is also important in studying the pollution in environmental and industrial areas. Nuclear power is a proven means to supply the growing demand for clean energy in our energy future, and it is obviously dependent on safe and rational utilization and careful monitoring of radioactive substances. Therefore, the rapid and precise measurement of fine particles and trace species is imperative to minimize environmental disruption and improve the efficiency of combustors in different applications.
Laser diagnostics have attracted a great deal of attention in various industries because of its ability to perform noncontact, fast response, and multidimensional qualitative and quantitative analytical detection (2). Laser-induced breakdown spectroscopy (LIBS) is an analytical detection technique based on atomic emission spectroscopy to measure the elemental composition. With the development of lasers and detection systems, LIBS has been applied to the analysis of solids, liquids, and gases in areas such as combustion (3–5), metallurgy (6,7), food (8,9), human health (10,11), and others (12,13). Specifically, the advantages of the method are more significant in the areas of combustion, metallurgy, and the harsh environment. Various papers have reported the measurement of coal and fly ash (14,15), as well as the trace species measurement of elements such as Hg, Cd, and Pb in different fields using LIBS (16,17). The improvement of quantitative analysis for aerosol sample measurement is very necessary. One of the challenging targets of LIBS is the enhancement of detection limits for gas-phase materials. A new method to control the LIBS plasma generation process is necessary for the enhancement of detection limits. The improved measurement of the quantitative elemental composition of fine particles and the enhanced detection ability of trace species using LIBS is studied and discussed in this column installment.
Theory
In the LIBS process, a laser beam is focused into a small area, producing hot plasma. The material contained in the plasma is atomized and the light corresponding to a unique wavelength of each element is emitted from excited atoms in the plasma. Despite the fact that the LIBS processes involved are complex, the emission intensity from the atomized species can be described by the following equation with the assumption of uniform plasma temperature (2):

where Ii is the emission intensity of species i, ni is the concentration of species i, Ki,j is a variable that includes the Einstein A coefficient from the upper energy level j, gi,j is the statistical weight of species i at the upper energy level j, Ei.j is the upper level energy of species i, k is the Boltzmann constant, and T is the plasma temperature. Equation 1 is applicable under the conditions of local thermodynamic equilibrium (LTE). Actually, the plasma temperature intrinsically fluctuates causing the fluctuation of evaluated concentrations from LIBS signal intensities. Therefore, the plasma temperature correction becomes important to ensure the quantitative measurement, especially for particle measurement in gases. The plasma temperature correction method was proposed to improve the quantitative capability of LIBS (3). Different spectral lines from the same species were selected to correct the plasma temperature dependence of the emission intensity.
There are several interferences that target the signal in a LIBS process, including the continuum emission from plasma itself, coexisting molecular and atomic emissions, noise from detectors, and so on. Creation and cooling processes of the plasma in LIBS include multiphoton ionization, electron impact ionization, and recombination, which can be controlled by pressure and pulse width (18). A new method to control the LIBS plasma generation process was proposed to enhance the detection ability.
Experiment
Figure 1 illustrates the experimental apparatus used in fly ash and coal measurements to detect the size-segregated particles according to the diameter (3). The experimental setup was composed of a laser, a beam-focusing system, a detection system, a separator, and auxiliary devices. The beam from a Q-switched Nd:YAG laser (LOTIS TII, LS-2137U, 6–8 ns, beam diameter: 8 mm) operating at 1064 nm was focused into the measurement area using a lens with a focus length of 200 mm. The measurement chamber was a vacuum cell with four quartz windows, and its internal volume was about 200 cm3. The emission signals were separated from the laser path using a splitter and focused into an optical fiber. The spectra were dispersed using a spectrometer (JASCO CT-10S) and detected by an intensified charge-coupled device (ICCD) camera (iStar 334T Series, Andor). Improvement on quantification of LIBS has been demonstrated in terms of surrounding gas effect for further applications (19).
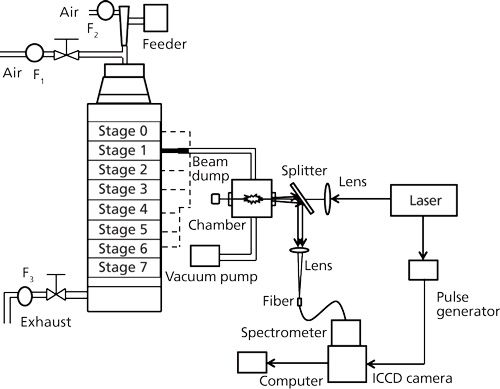
Figure 1: LIBS experimental system for analyzing size-segregated particles (3).
The schematic diagrams of the experimental system for trace species measurement is illustrated in Figure 2. Hg, CH3I, Sr(C5[CH3]5)2, and Cs(C11H19O2) were measured to evaluate the elemental detection characteristics of Hg, I, Sr, and Cs. The standard CH3I gas and the gaseous mixtures of Hg, Sr(C5[CH3]5)2, and Cs(C11H19O2) from the constant-temperature bath according to the vaporizing pressure with buffer gases of air and N2 were introduced into the measurement chamber. Four different pulsed Nd:YAG lasers were used here including nanosecond laser 1 (Quantel Brilliant b, 6 ns, beam diameter: 9 mm), nanosecond laser 2 (Quanta-Ray Pro-230, 6–12 ns, beam diameter: 9 mm), picosecond laser 1 (EKSPLA SL312, 150 ps, beam diameter: 10 mm), and picosecond laser 2 (Quantel YG901C-10, 35 ps, beam diameter: 9.5 mm). The output laser beam was focused into the measurement chamber using the lens with a focal length of 80 mm. Emission signals from another window of the chamber, perpendicular to the laser propagation direction, were finally detected by a combination of a spectrometer (JASCO CT-10S), an ICCD camera (Princeton Instruments Inc., Model ITEA/CCD-576-S/RB-E), and auxiliary equipment.
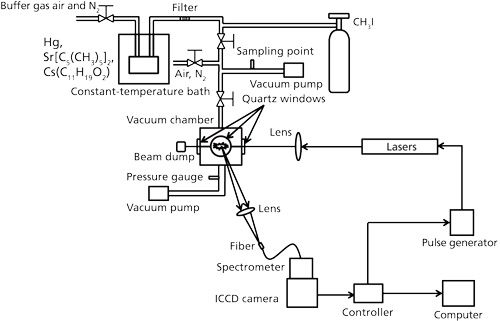
Figure 2: LIBS experimental system for trace species measurement.
Results and Discussion
Coal and Fly Ash Measurement Using LIBS
Plasma temperature correction is important for quantitative measurement. The fly ash and coal samples were measured to set up the plasma temperature correction factors under different experimental conditions such as delay time. The intensity with respect to species concentration varied with different delay times, which results in the alteration of the plasma temperature. The ratio of IMg1/IMg2 was used as the plasma temperature correction factor. A fly ash sample was measured for the temperature correction. IMg1/IMg2 was altered in the 4–24 range by changing the delay time between 800 and 3000 ns. IMg1/IMg2 increased with a decrease of the delay time. The typical temperature correction curve and temperature correction result of IC/ISi for IMg1/IMg2: 4–24 are shown in Figure 3. In Figure 3a the ratio is influenced by the plasma temperature, which is directly related to IMg1/IMg2. By applying the temperature correction scheme (20), the fluctuation of IC/ISi became smaller under different plasma temperature conditions, as shown in Figure 3b. However, the plasma temperature dependencies are apparently different for IMg1/IMg2: 4–8, which means the low plasma temperature condition, and IMg1/IMg2: 12–24, the high plasma temperature condition. This result means that the plasma induced by the LIBS process is not uniform and complex. LTE can be assumed in the limited range of plasma temperature-that is, IMg1/IMg2. The limitation of LTE assumption has also been discussed for glow discharge plasma (21).
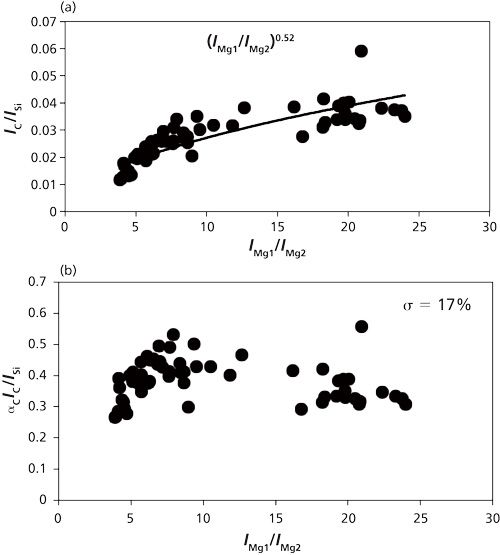
Figure 3: Correction curves and results of plasma temperature for IMg1/IMg2 values ranging from 4 to 24 (20): (a) correction factor for IC/ISi; (b) correction result for IC/ISi.
The results for C/SiO2, Al2O3/SiO2, Fe2O3/SiO2, and CaO/SiO2 are summarized in Table I. The correction results for IMg1/IMg2: 4–8 are more accurate than those for IMg1/IMg2: 4–24 and IMg1/IMg2: 12–24, which means the limitation of LTE assumption. It is important to set the measurement condition within an appropriate IMg1/IMg2 range. The cause of the fluctuation in the temperature correction results is also attributed to the sample uniformity, because the fly ash contents are not uniform in the microscopic sense. With the temperature correction, unburned carbon in fly ash can be evaluated down to less than 1% (15), which can satisfy the requirements in most pulverized coal fired boilers. This method is made workable and satisfactory for practical applications by choosing the appropriate plasma temperature correction range.

The fly ash was separated and then measured according to the diameter. The temperature correction method described above was used to obtain the normalized concentration ratios of each stage shown in Figure 4. At different stages, the concentration ratio of Fe2O3/SiO2 was unchanged and stable. Concentration ratios of C/SiO2, Al2O3/SiO2, and CaO/SiO2 decreased slightly by 2.7%, 4.2%, and 0.3% with decreases of particle diameter. The smaller particles combust much more completely, resulting in lower carbon concentrations in the smaller particles. Because the boiling points of Ca and Al are lower than that of Fe, concentration ratios of Al2O3/SiO2 and CaO/SiO2 also decreased during coal combustion, which was consistent with the chemical analysis results.
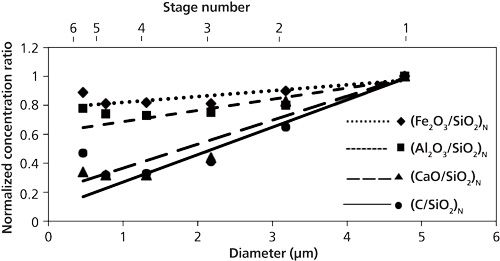
Figure 4: Average results of LIBS measurement of fly ash (3).
In the case of real-time fly ash measurement in exhausts of coal-fired boilers, the influence of coexisting gases such as CO2 must be considered. In the particle contents measurement in gases, particles such as fly ash become the core of the plasma and the plasma expands to the surrounding gases. The CO2 effect is rather sensitive to the concentration in surrounding gas and less than 1% CO2 will cause the spurious C signal in fly ash LIBS spectra. Therefore, it is important to reduce CO2 content in burned gas under burned gas conditions. The sampling of fly ash using a cyclone positioned in the sampling box in the coal-fired power plant is one of the effective methods to reduce this CO2 effect (15).
Coal has also been measured using the same experimental procedure and parameters with the temperature correction method. Concentration ratios of Fe2O3/SiO2, Al2O3/SiO2, and CaO/SiO2 were similar for different stages. However, C/SiO2 decreased when reducing the particle diameter (3). One reason for these results is the variation of mineral matter during the coal grinding process, which means the contents of different species are uneven in fine particles. From our results, we conclude that LIBS can quantitatively measure size-segregated particles according to diameter with the temperature correction method.
Trace Species Measurement Using LIBS
There are several interferences with the target signals in the LIBS process, generally including the continuum emission from plasma itself, coexisting molecular and atomic emissions, and noise from detectors. The laser-induced plasma process can be controlled by pressure, which relates to the interference and signal emissions. The interference of the continuum emission from plasma itself was reduced when the pressure decreased and the emissions of target elements became eminent compared with other emission signals by the control of electron impact ionization process. Figure 5 shows the measurement results of Hg, CH3I, Sr(C5[CH3]5)2, and Cs(C11H19O2) in N2 at low pressure (22). The apparent signals of Hg at 253.7 nm, iodine at 183 nm (I-3), Sr at 460.7 nm, and Cs at 852.1 nm can be detected with little interference of continuum emission and coexisting materials.
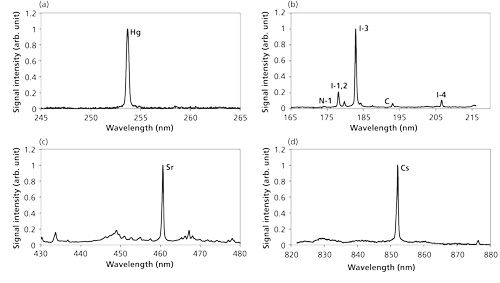
Figure 5: LIBS spectra of Hg, CH3I, Sr(C5[CH3]5)2, and Cs(C11H19O2) in N2: measurement results (22) for (a) Hg, (b) I, (c) Sr, and (d) Cs.
Trace species of iodine were measured using low-pressure LIBS under different conditions to examine the detection features (23). The buffer gas of N2 produced N atom emissions that appear around the iodine emission wavelength region. The intensity ratio of II-3/IN-1 was defined to evaluate the emission characteristics of iodine compared with N emission at 174.3 nm from the buffer gas. When reducing the pressure, the intensity ratio of II-3/IN-1 increased. Using a short pulse width and short wavelength breakdown improved II-3/IN-1. The reasons were the control of the laser-induced plasma process, especially the electron impact ionization process and the larger ionization and excitation of iodine. The coexisting molecular and atomic emissions usually appear during the electron impact ionization process. The interference of N emission was diminished by using a short pulse width and a short wavelength breakdown.
Iodine was also measured in air to evaluate the buffer gas effect. The LIBS spectra in air were different from those in N2 because of the reduction of iodine signal by the effect of oxygen. The iodine signal at 183 nm was reduced markedly because of the high quenching rate of excited iodine in air. N2 and air were also used in Hg measurements to compare the buffer gas effect on the plasma process, especially the O2 effect. The Hg signal in N2 was very clear without any interference of continuum emission and coexisting N2 effect. Using air as the buffer gas, several signal lines including N and NO emissions were detected besides the Hg signal. The NO emissions were formed during the plasma generation and cooling process of N2 and O2 in air. The intensity of the Hg signal also became weak because of the quenching of the Hg signal in O2.
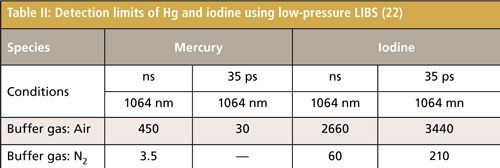
Figure 6 shows the concentration dependence of the iodine signal intensity in N2 (23). The results suggest the linear growth of I-3 signal intensity. The iodine detection limit of 600 shots (1 min) in N2 was estimated by evaluating the ratio of the slope of the iodine signal calibration curve (ms) to the background noise (standard deviation: Ï). The detection limit of iodine was 60 ppb (3Ï/ms) using nanosecond breakdown at 700 Pa. The background emission around I-3 at 183 nm was not eminent and the iodine detection limit was mainly determined by the detector noise in N2. Therefore, there was no evident enhancement of detection limits using short pulse width breakdown. The detection limit of iodine in air became worse because of the high quenching rate of excited iodine in O2. The Hg detection limit of 600 shots (1 min) was also estimated. The detection limits of iodine and Hg measured by low pressure LIBS are summarized in Table II.
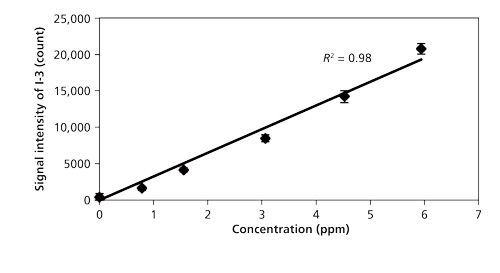
Figure 6: Concentration dependence of iodine signal intensity (23).
Conclusion
The size-segregated particles of coal and fly ash were measured using LIBS with the temperature correction method. With temperature correction, signals became much more stable than those without plasma temperature correction. To improve the accuracy of unburned carbon content in thermal power plants, the influence of coexisting gases such as CO2 was also evaluated. The trace species such as Hg, I, Sr, and Cs concerning the environment and human health were measured using low-pressure LIBS with enhanced detection limits. The detection limits of mercury and iodine were 3.5 ppb and 60 ppb in N2 using low-pressure LIBS.
References
- P. Li, X.B. Feng, G.L. Qiu, L.H. Shang, and Z.G. Li, J. Hazard. Mater. 168, 591–601 (2009).
- Y. Deguchi, Industrial Applications of Laser Diagnostics (CRS Press, Taylor & Francis, New York, New York, 2011).
- Z.Z. Wang, Y. Deguchi, M. Kuwahara, T. Taira, X.B. Zhang, J.J. Yan, J.P. Liu, H. Watanabe, and R. Kurose, Spectrochim. Acta Part B87, 130–138 (2013).
- T.B. Yuan, Z. Wang, L.Z. Li, Z.Y. Hou, Z. Li, and W.D. Ni, Appl. Opt.51, B22–B29 (2012).
- T. Ctvrtnickova, M.P. Mateo, A. Yañez, and G. Nicolas, Spectrochim. Acta Part B65, 734–737 (2010).
- M. Gaft, I. Sapir-Sofer, H. Modiano, and R. Stana, Spectrochim. Acta Part B62, 1496–1503 (2007).
- F. Boué-Bigne, Spectrochim. Acta Part B63, 1122–1129 (2008).
- , J. Anal. At. Spectrom. 16, 622–627 (2001).
- V. Juvé, R. Portelli, M. Boueri, M. Baudelet, and J. Yu, Spectrochim. Acta Part B63, 1047–1053 (2008).
- O. Samek, D.C.S. Beddows, H.H. Telle, J. Kaiser, M. LiÅ¡ka, J.O. Cáceres, and A. Gonzáles Ureña, Spectrochim. Acta Part B56, 865–875 (2001).
- R.K. Thareja, A.K. Sharma, and S. Shukla, Med. Eng. Phys.30, 1143–1148 (2008).
- L. St-Onge, E. Kwong, M. Sabsabi, and E.B. Vadas, Spectrochim. Acta Part B57, 1131–1140 (2002).
- Q.L. Ma, V. Motto-Ros, W.Q. Lei, M. Boueri, L.J. Zheng, H.P. Zeng, M. Bar-Matthews, A. Ayalon, G. Panczer, and J. Yu, Spectrochim. Acta Part B65, 707–714 (2010).
- F.J. Wallis, B.L. Chadwick, and R.J.S. Morrison, Appl. Spectrosc. 54, 1231–1235 (2000).
- M. Kurihara, K. Ikeda, Y. Izawa, Y. Deguchi, and H. Tarui, Appl. Opt. 42, 6159–6165 (2003).
- H.S. Zhang, F.Y. Yueh, and J.P. Singh, Appl. Opt. 38, 1459–1466 (1999).
- S.G. Buckley, H.A. Johnsen, K.R. Hencken, and D.W. Hahn, Waste Management20, 455–462 (2000).
- Z.Z. Wang, Y. Deguchi, M. Kuwahara, J.J. Yan, and J.P. Liu, Appl. Spectrosc. 1242–1251 (2013).
LIBS Illuminates the Hidden Health Risks of Indoor Welding and Soldering
April 23rd 2025A new dual-spectroscopy approach reveals real-time pollution threats in indoor workspaces. Chinese researchers have pioneered the use of laser-induced breakdown spectroscopy (LIBS) and aerosol mass spectrometry to uncover and monitor harmful heavy metal and dust emissions from soldering and welding in real-time. These complementary tools offer a fast, accurate means to evaluate air quality threats in industrial and indoor environments—where people spend most of their time.
Laser Ablation Molecular Isotopic Spectrometry: A New Dimension of LIBS
July 5th 2012Part of a new podcast series presented in collaboration with the Federation of Analytical Chemistry and Spectroscopy Societies (FACSS), in connection with SciX 2012 — the Great Scientific Exchange, the North American conference (39th Annual) of FACSS.
New Multi-Spectroscopic System Enhances Cultural Heritage Analysis
April 2nd 2025A new study published in Talanta introduces SYSPECTRAL, a portable multi-spectroscopic system that can conduct non-invasive, in situ chemical analysis of cultural heritage materials by integrating LIBS, LIF, Raman, and reflectance spectroscopy into a single compact device.