A Process for Successful Infrared Spectral Interpretation
Spectroscopy
We wrap up our introduction to the theory of infrared spectral interpretation with a discussion of the correct process to follow when interpreting spectra. The author has developed this 12-step system over many years of interpreting spectra, and finds it gives him the best results. The process includes knowing how a spectrum was measured, systematically identifying peaks, and the proper use of infrared spectral interpretation aids. The answer to last column’s quiz is also disclosed.
Pages 14–21
We wrap up our introduction to the theory of infrared spectral interpretation with a discussion of the correct process to follow when interpreting spectra. The author has developed this 12-step system over many years of interpreting spectra, and finds it gives him the best results. The process includes knowing how a spectrum was measured, systematically identifying peaks, and the proper use of infrared spectral interpretation aids. The answer to last column’s quiz is also disclosed.
Infrared (IR) spectral interpretation is firmly grounded in science as seen in the theory sections in previous installments. The challenge with interpreting spectra, however, is that with the hundreds of known functional groups that absorb in the mid-infrared and the resultant thousands of peaks, it becomes difficult to figure out what peaks are from what functional groups. To successfully interpret infrared spectra one must follow the right process, or else it is easy to be misled. This column will teach you a 12-step program that, if followed, should help you be more successful at interpreting spectra. The 12 steps are outlined below.
Step 1: Always Interpret Quality Spectra
The higher the quality of the spectrum you are working with, the easier your interpretation job will be. There are at least five attributes of a good spectrum: low noise, little or no baseline offset, a flat baseline, peaks on scale, and a lack of spectral artifacts.
An example of a bad spectrum is shown in Figure 1. Learn to eyeball the noise level in your spectra by looking at the amount of noise seen as “fuzz” in the baseline as indicated in Figure 1. If the noise is too large you may need to do more scans or re-prepare the sample.
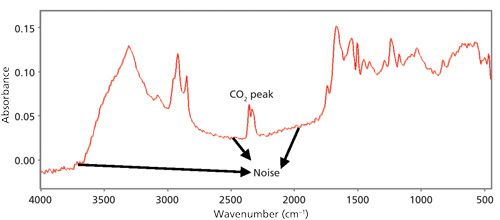
Figure 1: An example of a bad IR spectrum. Note the high noise, offset, sloped baseline, and presence of a CO2 artifact peak. Noise is represented by fuzz in the baseline as indicated.
Offset is a measure of how far the spectral baseline is away from zero. Ideally, the baseline should be as close to zero as possible. If it is not, try running a fresh background spectrum and then running your sample again. If that doesn’t work, re-prepare the sample. The peaks in an IR spectrum should be between 0 and 2 absorbance units, or 10% to 90% transmittance. If the peaks are outside these ranges and thus off scale, reduce the pathlength or concentration of the sample.
Spectral artifacts are peaks not caused by the sample. The most common types of spectral artifacts in IR spectra are water vapor and CO2 peaks; a CO2 peak is shown in Figure 1. These peaks can be minimized by running a fresh background, changing the desiccant in your instrument, or purging the instrument with dry nitrogen.
Figure 2 is an example of a good IR spectrum.
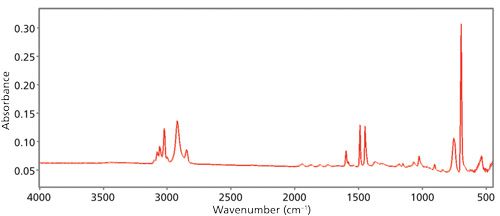
Figure 2: An example of a good IR spectrum. It has low noise, little baseline offset, a flat baseline, the peaks are on scale, and it is free of spectral artifacts.
There is little fuzz in the baseline, meaning the spectrum is low noise. The baseline is flat and close to zero, the peaks are on scale, and there are no spectral artifacts. This is the type of spectrum you should be interpreting. For more on spectral quality and how to fix spectral problems see my book on Fourier transform infrared (FT-IR) spectroscopy (1).
Step 2: Avoid Mixtures if Possible
The problem with mixtures in IR spectroscopy is that the more complex the composition of a sample, the more difficult it becomes to figure out what peaks are from what functional groups. A large part of a previous column was devoted to how to get around the mixture analysis problem (2). Please consult that installment for guidance on this topic.
Step 3: Use Other Knowledge of the Sample
An IR spectrum contains a lot of information about a sample, but by itself will not necessarily tell you everything you need to know about a sample. Thus, it is useful to have other information about a sample in addition to its IR spectrum. Don’t be afraid to interrogate the person submitting the sample. Ask them how the sample was generated, where it came from, how it was obtained and handled, what they think is in there, and most importantly, what will they do differently after obtaining the answer. Use your senses to help you. Is the sample a solid, semisolid, liquid, or gas? What color is it? What is its texture and physical form? All of these things can help you narrow down what is in a sample. If there are any other chemical analyses of the sample, such as Raman, ultraviolet–visible (UV–vis), or nuclear magnetic resonance (NMR) spectra by all means use the results of those analyses to aid your interpretation. Don’t forget about physical characteristics either such as melting point and boiling point; these can be included in a library search to help narrow down the possibilities. In general, the more sample info you have, the easier your interpretation job will be.
Step 4: Determine How the Spectrum Was Measured
Before looking at a spectrum you need to know the instrumental resolution, sampling method used, and whether any spectral processing (subtraction, smoothing, baseline correction, and so on) was applied. All the particulars listed here can affect the appearance of a spectrum and therefore must be known before interpreting a spectrum. As discussed in the most recent installment on comparing spectra (3), the instrumental resolution of a sample can have a huge effect on spectral appearance. Different sampling techniques can change the look of a sample’s spectrum, as shown in Figure 3. Lastly, spectral processing algorithms such as spectral subtraction, baseline correction, and smoothing can have a huge impact on spectral appearance, and this effect must be taken into account when interpreting spectra.
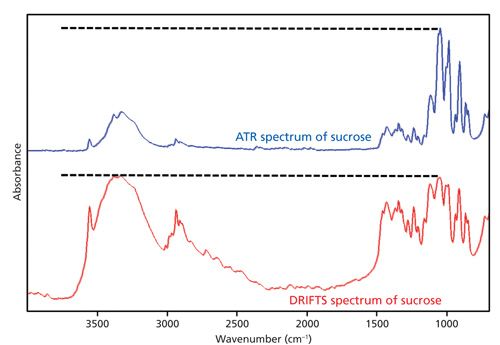
Figure 3: Bottom: The IR spectrum of sucrose measured by diffuse reflectance infrared Fourier transform spectroscopy (DRIFTS). Top: The IR spectrum of sucrose measured using a diamond ATR accessory. Note the difference in relative peak heights in the two spectra.
Step 5: Identify Spectral Artifacts Before Other Peaks
Water vapor and carbon dioxide are strongly IR-absorbing atmospheric gases whose ambient concentrations are high enough for their peaks to appear in mid-IR spectra. A spectrum of the atmosphere is shown in Figure 4.
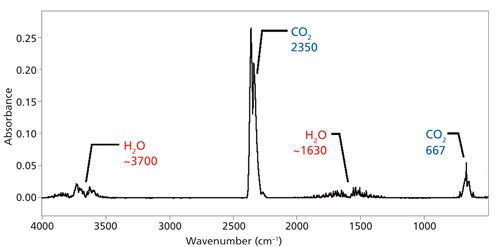
Figure 4: The IR spectrum of the atmosphere with major peaks from water vapor and carbon dioxide noted.
In theory, by running a background spectrum and ratioing it to a sample single-beam spectrum, the atmospheric contribution to a sample spectrum should cancel and leave the sample spectrum free of spectral artifacts. However, changes in the concentration of water vapor and CO2 inside the instrument and sample compartment can cause these peaks to appear in sample spectra. Methods for trying to minimize atmospheric peaks include purging the instrument with dry nitrogen, sealing and desiccating the instrument, and frequently running background spectra. Despite these efforts, artifact peaks can still appear in your FT-IR spectra. Therefore, you should learn to recognize and ignore the peaks listed in Figure 4.
Step 6: Identify Peaks from Components You Know Are Present
You need to identify the peaks of known components so you don’t misinterpret them as being part of the rest of the sample. For example, if you prepare your sample as a mineral oil mull or dissolve the sample in a solvent to take its spectrum, you need to track down the mineral oil or solvent peaks. This step is easily accomplished by taking reference spectra of these materials neat and comparing them to your sample. If your sample is in aqueous solution, identify the water peaks at this point. If the sample is a mixture and you know the identity of one or more of the mixture components, track down their peaks. After identifying peaks of known components you will be left with a set of unknown peaks. Use the rest of this process to help you assign them.
Step 7: Read the Spectrum from Left to Right
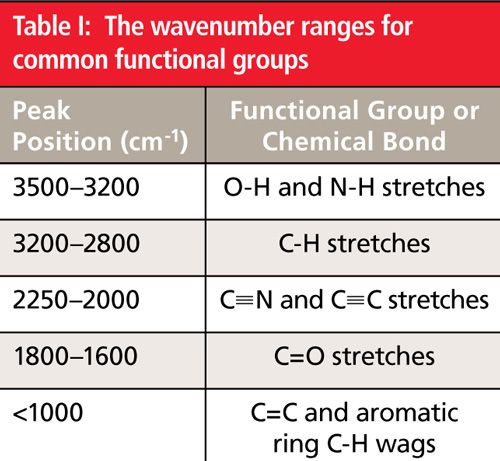
You should read the spectrum from left to right like a sentence in a book, noting the presence or absence of the group wavenumbers listed in Table I.
The conventional way to plot IR spectra is with high wavenumber to the left and low wavenumber to the right as seen in Figure 5.
When plotted in this orientation you scan the spectrum from left to right and use the peak ranges in Table I to quickly determine whether certain important functional groups are present or absent from a sample. For example, there are no significant peaks between 3500 and 3200 cm-1 in Figure 5, which means the sample does not contain any O-H or N-H bonds. There is a medium size peak near 3000 cm-1, indicating there are C-H bonds in the sample. Triple bonds such as C≡N and C≡C have stretching peaks around 2200 cm-1. The strong peak in this region in Figure 5 is from a nitrile (C≡N) bond. There are no significant peaks between 1800 and 1600 cm-1, which means there are no carbonyl (C=O) bonds present. Lastly, there are several strong peaks below 1000 cm-1, indicative of unsaturated carbon (C=C or aromatic ring) C-H wagging vibrations. In this case, there is a benzene ring in the sample.
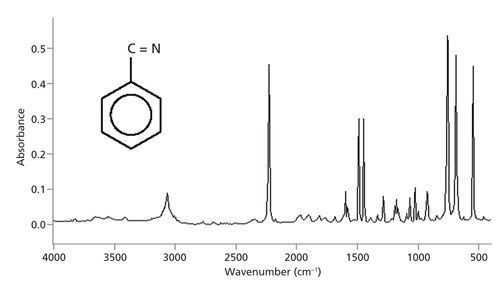
Figure 5: The IR spectrum of benzonitrile plotted in conventional orientation.
Note that Table I does not list any peak positions between 1600 and 1000 cm-1. This region is frequently called the fingerprint region because of the level of detail usually found there (4). The fingerprint region is vitally important to successful infrared interpretation, but it is passed over during the initial examination of a spectrum because it is best to learn as much as possible from the less complex parts of the spectrum first, and then bring this knowledge to bear on the fingerprint region.
Step 8: Assign the Intense Bands First
The most intense bands are the easiest ones to see, but they are also frequently the most diagnostically useful peaks. This doesn’t mean less intense peaks don’t matter, but since the bigger peaks are easier to see and assign it is best to handle them first.
Step 9: Track Down Secondary Bands of Functional Groups Already Found
Secondary bands are peaks of lesser intensity for a given functional group. Secondary bands need to be tracked down for two reasons. First, many functional groups have multiple peaks in the mid-IR, and tracking down as many peaks as possible for them raises the probability of a correct interpretation. Second, these bands should be assigned to keep from incorrectly assigning them as being caused by a functional group that may not be present.
Step 10: Assign Other Bands as Needed
You should try to assign as many peaks as possible when interpreting an infrared spectrum. However, there are limits to what one can do. For example, you could try to interpret every wiggle and bump in the spectrum of benzonitrile in Figure 5, but it could take days and probably would be a waste of your time. One must assign “peaks as needed” but realize there is a limit to what can be accomplished. My experience is that I learn the most from a spectrum from my first few minutes of examining it, and after the 10- or 15-min mark I rarely make much further progress. I also do not feel the need to assign every peak. Keep in mind that an infrared spectrum is not a democracy and not all peaks are created equal. Some peaks are diagnostically useful, some are marginally useful, and some are useless. The most diagnostically useful peaks are generally the biggest ones, are located in unique places, or are listed in common compendia of peak positions (4–7). It will be my job going forward to teach you which peaks are the most diagnostically useful for the functional groups we cover.
Step 11: Write Down the Functional Groups You Think Exist in the Sample
As peaks are assigned during your interpretation process, write down the functional groups you think are present. After you have identified several functional groups put them together like the pieces of a jigsaw puzzle to form legitimate chemical structures. Then see if the spectrum is consistent with the structure you have drawn. For example, if a sample contains an OH, CH2, and a benzene ring, the OH could be attached to the methylene or the ring. An examination of the spectrum will tell you which of these two possibilities you actually have.
Step 12: Get Help!
Nobody is perfect at spectral interpretation, so it is OK to ask for help. However, notice that getting help is not step 1 but step 12. You should always examine the spectrum first, learn what you can on your own, and then consult your help sources. In this way, you will be obtaining help from a position of knowledge rather than ignorance, and the help sources will be more useful to you. Sources of interpretation help include expert interpreters, textbooks (4–7), IR peak correlation charts, training courses, spectral atlases (8), library searching, and interpretation software packages.
Conclusion
Remember that IR spectral interpretation is part art and part science, and that every peak position range you learn will have exceptions to it. It is possible to follow this 12-step program and not come to the correct answer. However, I promise you that by following this program you will obtain more information and more correct interpretations than if you don’t follow it.
References
- B.C. Smith, Fundamentals of Fourier Transform Infrared Spectroscopy (CRC Press, Boca Raton, Florida, 2011).
- B.C. Smith, Spectroscopy30(7), 26–31, 48 (2015).
- B.C. Smith, Spectroscopy30(9), 40–45 (2015).
- B.C. Smith, Infrared Spectral Interpretation: A Systematic Approach (CRC Press, Boca Raton, Florida 1995).
- N. Colthup, L. Daly, and S. Wiberley, Introduction to Infrared and Raman Spectroscopy (Academic Press, Boston, Massachusetts, 1990).
- D. Lin-Vien, N. Colthup, W. Fateley, and J. Graselli, The Handbook of Infrared and Raman Characteristic Frequencies of Organic Molecules (Academic Press, Boston, Massachusetts, 1991).
- G. Socrates, Infrared and Raman Characteristic Group Frequencies: Tables and Charts (Wiley, Boston, Massachusetts, 2001).
- C. Pouchert, Aldrich Library of Infrared Spectra, 3rd Edition (Aldrich Chemical Co., Madison Wisconsin, 1981).
- B.C. Smith, Spectroscopy30(4), 18–23 (2015).

Brian C. Smith, PhD, is a Senior Infrared Product Specialist for PerkinElmer, based in San Jose, California. Before joining PerkinElmer, he ran his own FT-IR training and consulting business for more than 20 years, and taught thousands of people around the world how to improve their FT-IR analyses and interpret infrared spectra. Dr. Smith has written three books on infrared spectroscopy: Fundamentals of FTIR and Infrared Spectral Interpretation, both published by CRC Press, and Quantitative Spectroscopy: Theory and Practice published by Academic Press. He has published a number of papers in peer-reviewed journals and is a co-inventor on a patent for an FT-IR method to monitor dust exposure in coal mines.

AI Shakes Up Spectroscopy as New Tools Reveal the Secret Life of Molecules
April 14th 2025A leading-edge review led by researchers at Oak Ridge National Laboratory and MIT explores how artificial intelligence is revolutionizing the study of molecular vibrations and phonon dynamics. From infrared and Raman spectroscopy to neutron and X-ray scattering, AI is transforming how scientists interpret vibrational spectra and predict material behaviors.
Real-Time Battery Health Tracking Using Fiber-Optic Sensors
April 9th 2025A new study by researchers from Palo Alto Research Center (PARC, a Xerox Company) and LG Chem Power presents a novel method for real-time battery monitoring using embedded fiber-optic sensors. This approach enhances state-of-charge (SOC) and state-of-health (SOH) estimations, potentially improving the efficiency and lifespan of lithium-ion batteries in electric vehicles (xEVs).
New Study Provides Insights into Chiral Smectic Phases
March 31st 2025Researchers from the Institute of Nuclear Physics Polish Academy of Sciences have unveiled new insights into the molecular arrangement of the 7HH6 compound’s smectic phases using X-ray diffraction (XRD) and infrared (IR) spectroscopy.