In situ Raman Spectroscopy Monitors the Corrosion of Mild Steel in a Salt Fog Chamber
The global cost of corrosion imposes a significant burden on society, with safety and environmental consequences in addition to its direct impact. One challenge to its management is that the process of corrosion is complex, and common experimental techniques provide only limited information. The neutral salt spray test, a standardized test used for the evaluation of the corrosion resistance of steels and coatings, creates an aggressive environment not suitable for many analytical methods. Here, we report the first use of in situ Raman spectroscopy to detect the formation, growth, and evolution of corrosion products on metal surfaces, monitoring a mild steel plate in alternating salt fog and dry atmospheric conditions over a period of eight days to identify and track key corrosion products. Assisted by multivariate curve resolution alternating least squares (MCR-ALS) analysis and online weighing of the sample, we found the chemical conversion of iron hydroxides to oxides takes much longer than the physical drying of the corroded surface. Together, these results pave the way for real-time online observation of corrosion inside a salt fog chamber to obtain chemically relevant information with a single, compact apparatus.
Corrosion is the process of degradation of metals because of atmospheric phenomena or environmental conditions, incurring costs of approximately 3.4% of the global gross domestic product (1). To combat corrosion, many coatings and alloys have been developed to extend the life span of steel products. Research institutions and industries, including but not limited to the steel, automotive, oil and gas, and aerospace industries, have adopted different techniques to understand, predict, and ultimately control corrosion-related processes (2). The key to improving these techniques is a better understanding of the corrosion mechanisms involved.
Standardized tests, such as the neutral salt spray (NSS) test, are used to accelerate the corrosion process for research purposes (3). Samples are placed in a chamber with a fog of neutral 5% NaCl solution at 35 °C. Once the samples are corroded in the chamber, they are removed and can be analyzed with a variety of methods (4–6). Raman spectroscopy is a common analysis technique that can provide detailed chemical information with high specificity (7–9).
In contrast to such offline analyses, here we present for the first time a setup that collects in situ Raman spectra inside a working salt fog chamber, demonstrating the feasibility of online investigation of the corrosion process in mild steel samples (also known as low carbon steel).
Materials and Methods
In this study, we used a custom tabletop corrosion chamber constructed from a glass basin 45 x 25 x 30 cm in size (see Figure 1). A solvent-cleaned sample of 10 x 10 cm mild steel (DC04, voestalpine Stahl GmbH) was corroded for 8 days as follows: 48 h of salt fog, 48 h of drying, an additional 72 h of salt fog, and a further 24 h of drying. To generate salt fog, the basin was filled with several centimeters of a neutral 5.0 wt% sodium chloride solution (NaCl, Pharmasal, Salinen Austria AG). The salt fog was produced by a floating ultrasonic fog generator, and homogeneously dispersed with a stirrer. To monitor sample weight changes, the steel plate under study was suspended from a balance which was mounted on top of the chamber. The sample was placed at a 20° angle from vertical to facilitate run-off of the condensed salt water. During the salt fog experiments, the temperature of the sample and chamber was kept at 35±2 °C. These settings are similar to standardized tests such as EN ISO 9227 NSS (3) or ASTM B117 (10). The drying was performed in laboratory atmosphere conditions at 23±2 °C with 40–60% relative humidity.
FIGURE 1: Schematic representation of custom tabletop salt fog chamber with Raman probe.
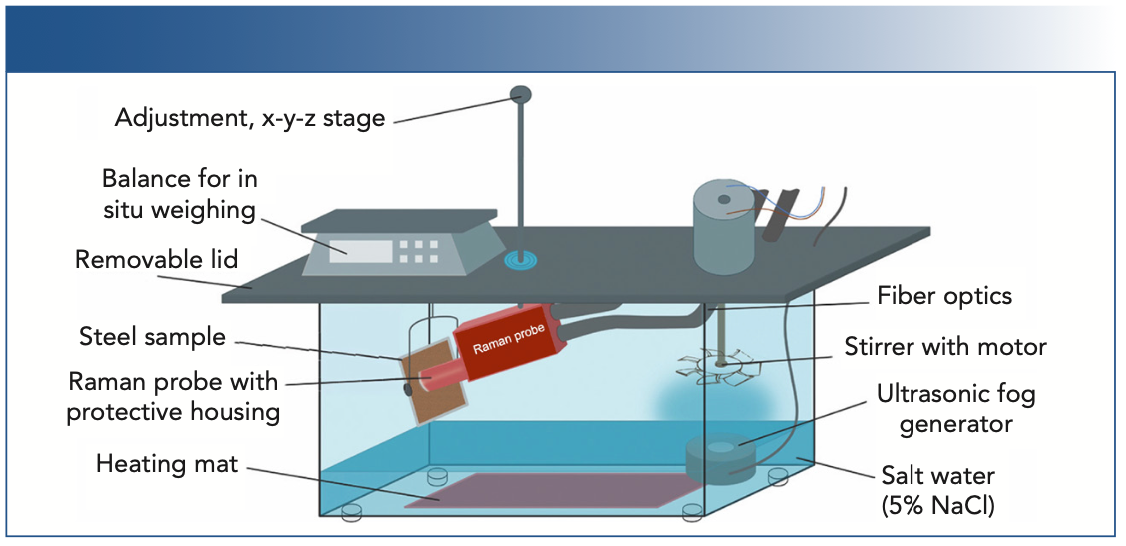
The in situ Raman measurements were performed with a hermetically enclosed Raman probe pointed perpendicular to the sample surface and observed the same spot throughout the experiment. The working distance was kept to within ±0.5 mm of the optimal working distance of 11 mm to maintain good signal-to-noise (S/N) ratio, maintaining a 90° sample-laser angle for optimal signal intensity. The presence of salt fog in the chamber reduced the Raman signal intensity by approximately 50%.
The Raman system used for monitoring was comprised of a WP-785-R-SR-LMMFC-25 spectrometer (Wasatch Photonics) with an integrated diode laser (450 mW, 785 nm), connected to an RP-785 Raman probe (Wasatch Photonics) using a 600 μm core SMA-coupled detection fiber and a 550 μm core FC-coupled laser delivery fiber. The laser spot size on the sample was 900 μm, large enough to prevent local heating of the corrosion products, which could induce background emission in the Raman spectrum. Spectra were recorded at 6-min intervals with an integration time of 1 s, and 25 averages. The laser was turned off between acquisitions, and a new averaged dark spectrum was acquired prior to every measurement. The laser power was set to the full 450 mW during the salt fog periods, but reduced to 300 mW during dry conditions to avoid local sample heating.
Results and Discussion
Figure 2 shows examples of Raman spectra obtained for the corrosion process of the sample during the four phases of the experiment (salt fog I and II, drying phases I and II). Before the start of corrosion (0 h), the signal represents the broadband Raman signature of the encapsulation windows and focusing lens.
FIGURE 2: Representative in situ Raman spectra recorded during the different phases of the corrosion experiment with tentative assignments to corrosion products (top figure), and a schematic representation of the deduced chemical transformations (bottom).
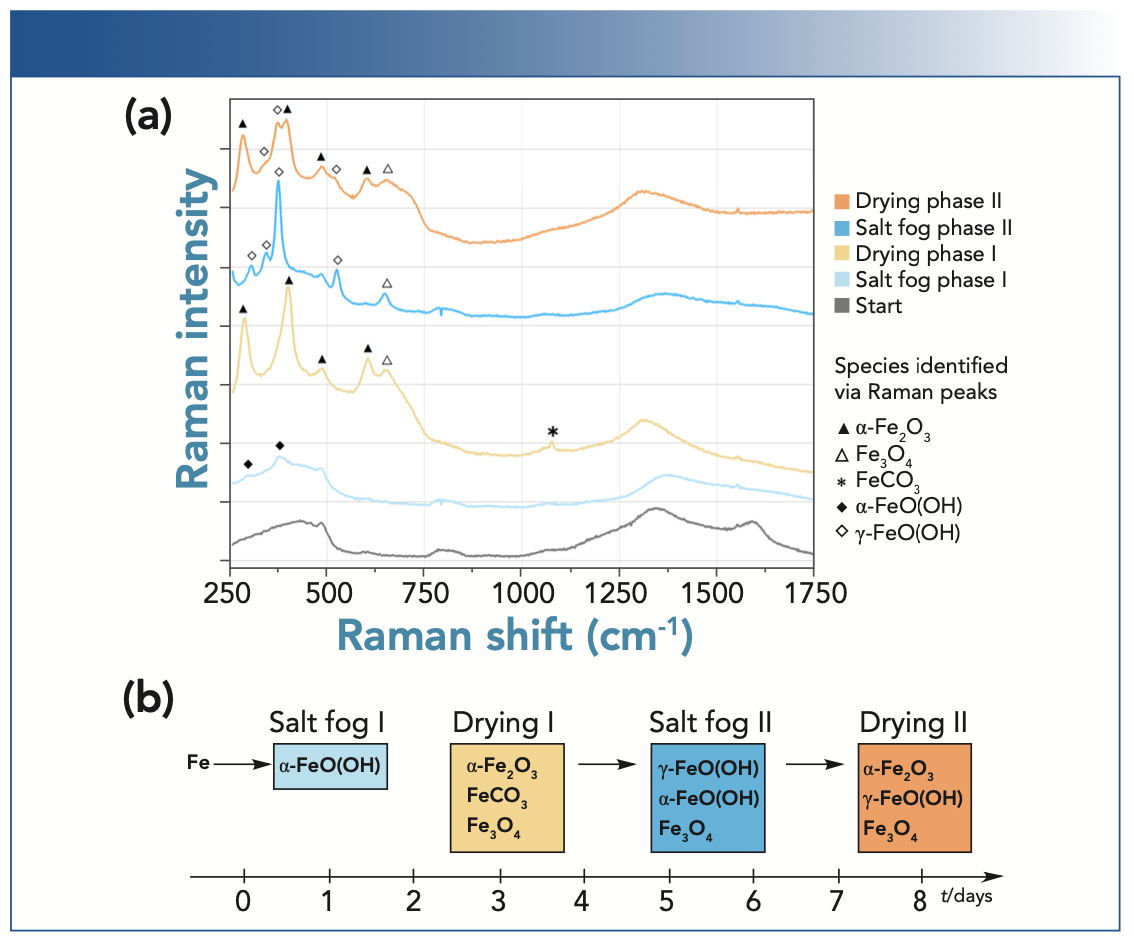
The emergence of the low-intensity bands at 297 and 378 cm-1 (marked with solid diamonds) during the first salt fog phase marks the onset of corrosion with appearance of α-FeO(OH), also known as goethite (11–12). During the first drying phase, bands with more significant Raman emission at 289, 402, 489, and 604 cm-1 (marked with solid triangles) were observed. Using library spectra (13) and literature spectra (14,15) with very similar band positions, we assign these bands to hematite (α-Fe2O3). Therefore, we interpret these spectral changes as the drying of the iron oxyhydroxides to iron oxides through the removal of chemically bound water.
Additional features were observed at 647 cm-1 and 1078 cm-1 (marked with the open triangle and the star, respectively). Based on library spectra, we assign these bands to magnetite (Fe3O4) (16) and siderite (FeCO3) (17), respectively. We interpreted the emergence of the siderite band as an indication of a chemical reaction between the sample surface and CO2 from the laboratory atmosphere during the drying phase.
During the second salt fog phase, we observed bands at 306, 346, 376, and 525 cm-1 (marked with the open diamonds). We assign these bands to lepidocrocite (γ-FeO[OH]) (18). An additional band at 649 cm-1 was observed, and can again be assigned to magnetite (marked by an open triangle, as before). The persistence of magnetite throughout the salt fog phase can be explained by the stable nature of this iron oxide.
During the second drying phase, many of the aforementioned bands attributable to iron oxyhydrides and oxides reappeared (as marked), namely hematite, lepidocrocite, and magnetite, although it is hard to distinguish the α and γ oxyhydroxides bands around 376 cm-1. Hence, the nature of the exact crystal structure present was uncertain.
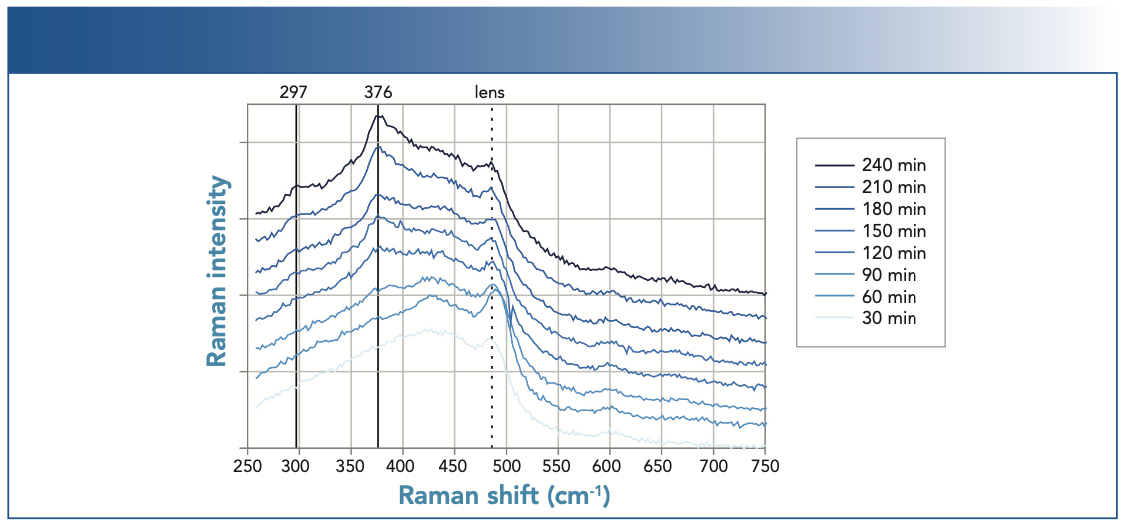
In addition to qualitative assessment of the chemical changes, in situ Raman observations also allowed the extraction of dynamic information about the corrosion process. Even though corrosion occurs slowly, changes in the spectrum could be observed within a few hours, as shown in Figure 3. The bands at 298 and 376 cm-1 (assigned to α-FeO(OH) above) emerged once the sample was exposed to the salt fog.
FIGURE 3: Evolution of the in situ Raman spectra during the first hours of a neutral salt fog exposure indicating the formation of corrosion products on mild steel.
It was also possible to monitor and analyze a shift in the position of the dominant Raman band during drying phase I and II, as shown in Figure 4, revealing a shift in intensity from the band at 374 cm-1 to a band at approximately 400 cm-1. We interpret this spectral change as the transformation from FeO(OH) to α-Fe2O3, as assigned above.
FIGURE 4: Recorded Raman spectra of a corroding mild steel sample during drying phase I (left) and II (right) in a salt fog experiment designed to monitor corrosion.
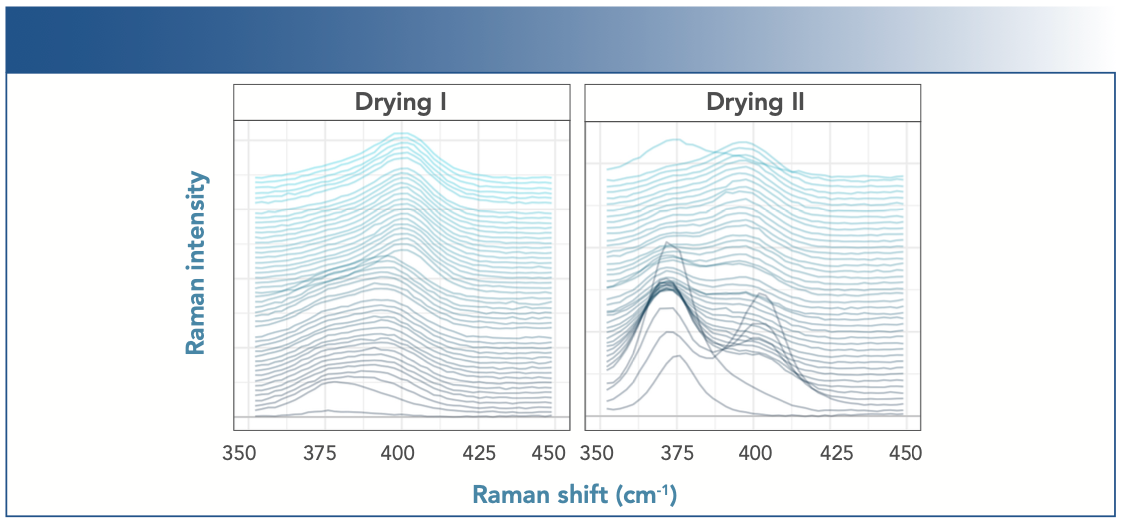
The position of the main peak within this spectral window was determined through quadratic interpolation across the band maximum. Additionally, as shown in Figure 5, we compared the resulting shift of the maximum Raman peak position (in blue) with the recorded weight changes (in green). The sudden weight changes were caused by surface water evaporation in the drying phase and sample wetting in the salt fog phase, respectively, and take approximately 1–2 h to occur.
FIGURE 5: Weight changes of the steel sample compared to the shift to the main peak around 375–400 cm-1 measured by the position of the most intensive peak in this region, indicating the transformation from FeO(OH) (375 cm-1) to Fe2O3 (400 cm-1).
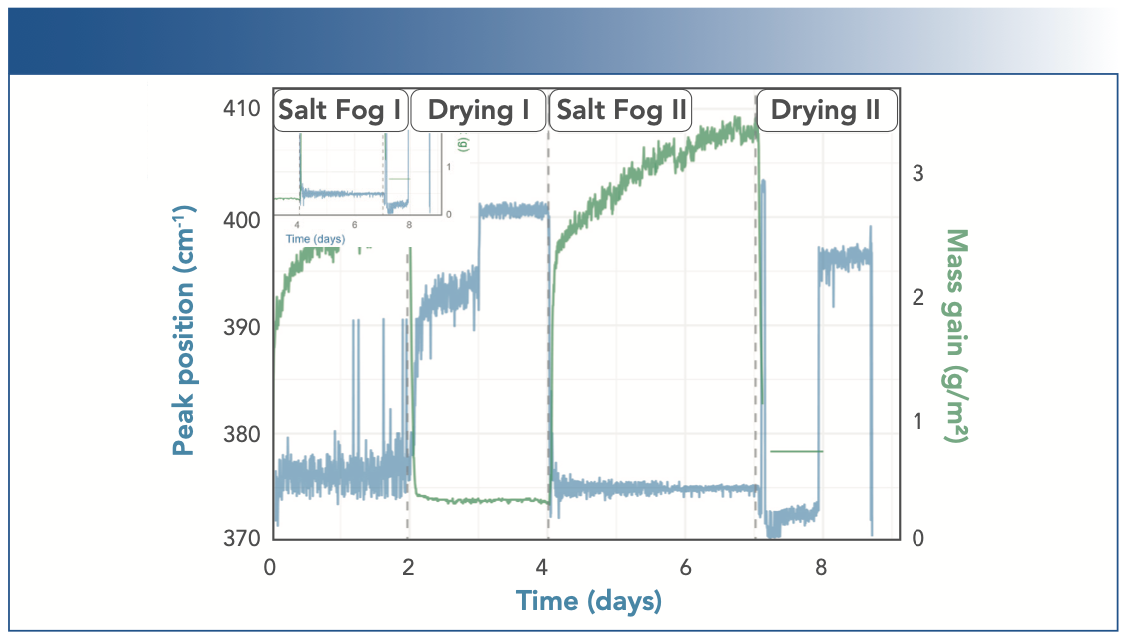
Comparing the sudden weight changes during drying phase I to the change in Raman band position, we find a much more gradual change in the spectrum, taking about 30 h. Based on earlier band assignments, this spectral change can be attributed to the chemical transformation from α-FeO(OH) to α-Fe2O3. For the second drying phase, Figure 4 illustrates a decreasing band at 376 cm-1 and an increasing band at 400 cm-1, leading to the appearance of an instantaneous transition of the maximum in Figure 5. We assign this change to the transformation from γ-FeO(OH) to α-Fe2O3, which may explain the difference between drying phases I and II.
Using in situ Raman spectroscopy, it was possible to identify the chemical transformations and also determine their timelines. Access to this information would be of significant benefit to both fundamental corrosion research and in the development of new coatings and alloys.
The complete set of in situ Raman spectra recorded during the week-long experiment contains a full representation of the chemical changes during this corrosion process. Multivariate statistical analysis tools can be used to transform the full set of spectra into a sum of spectra from individual chemical species, each with a contribution varying as a function of time. Therefore, this analysis provides a potential chemical interpretation of the process based on the recorded set of in situ Raman spectra.
One such analysis is multivariate curve resolution (MCR), often using alternating least squares (ALS) during the fitting process. The analysis is dependent on the chosen starting values; here, we use the orthogonal projection approach (OPA) to estimate the time changes of each species’ contribution. Five components were fitted, with the four main contributions discussed below. This number was determined through a combination of principal component analysis (PCA), chemical intuition, and trial and error. It should be noted that MCR-ALS has difficulties separating spectral contributions that are significantly correlated in time.
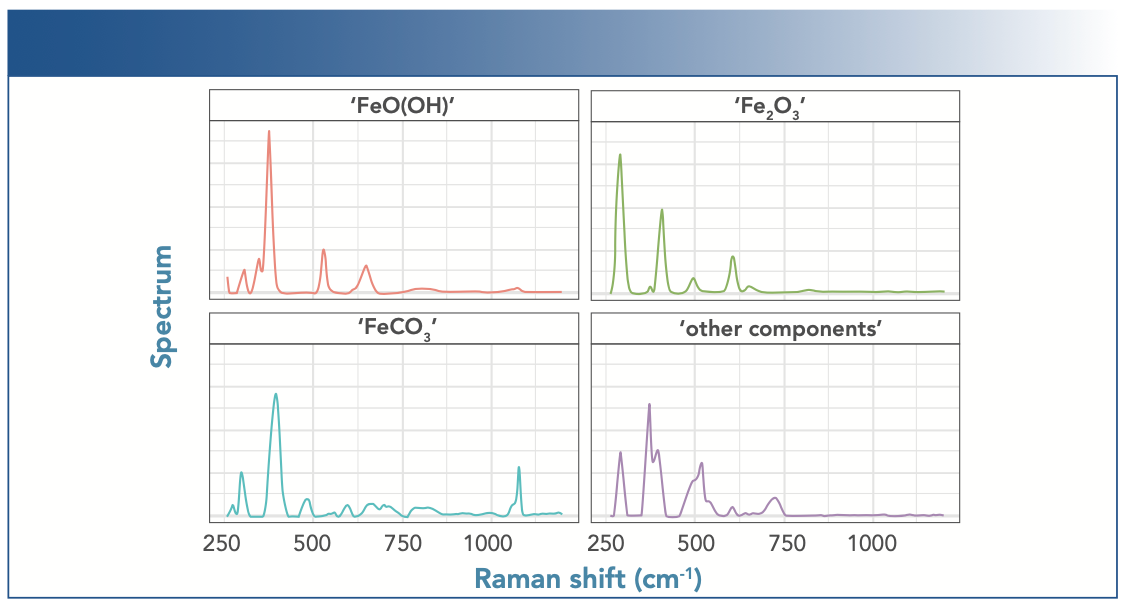
The MCR-ALS analysis resulted in spectra for four components, shown in Figure 6, which were assigned to chemical species based on the spectra referenced above. Three components were assigned as “FeO(OH),” “Fe2O3,” and “FeCO3.” However, the fourth component was not clearly identifiable and is hence simply labeled as “other components.”
FIGURE 6: Component spectra from MCR-ALS multivariate analysis of the entire experiment. The component spectra are tentatively assigned to actual chemical species based on best agreement with published band positions.
Based on these component spectra, the MCR-ALS analysis generated a visualization of the change in each component’s contribution to the experimental spectrum as a function of time, as shown in Figure 7. These plots represent the dynamics of the process, observed with in situ Raman spectroscopy, but interpreted from a chemical perspective. However, as MCR-ALS is a fitting technique, the results can only show one potential representation of the experimental spectral data set.
FIGURE 7: Dynamics and time profile of the contributions of the four components to the experimental spectra set, as determined with MCR-ALS analysis, here tentatively assigned to four chemical species as indicated.
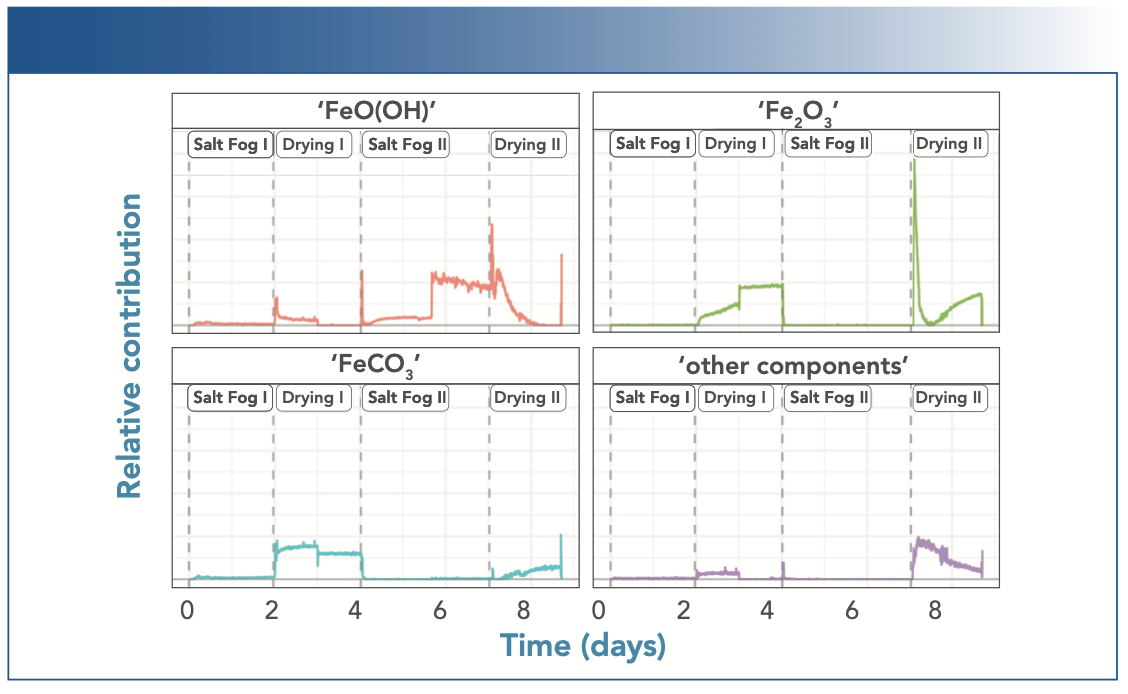
The MCR-ALS results show even more clearly the slow transition from oxyhydroxides to oxides during the drying phases of the experiment, both in the disappearance of the “FeO(OH)” contribution, as well as in the appearance of the “Fe2O3“ contribution. The sudden jump in the various contributions during the first drying phase most likely stems from a small shift in the observed location, or some macroscopic change in the monitored spot on the sample surface.
Conclusion
This study shows how in situ Raman spectroscopy can facilitate the investigation of surface chemistry processes, such as the corrosion of mild steel, even in a harsh salt fog environment. Detailed chemical insights into the corrosion process that would otherwise be inaccessible can be obtained.
By performing a cyclical corrosion experiment consisting of alternating salt fog and drying periods for 1–3 d each, we find that initially α-FeO(OH) is formed after about 2 h of salt fog exposure. During the first drying phase, a slow change to α-Fe2O3 was accompanied by the formation of iron carbonate and magnetite; while the former rapidly converts to a mixture of γ-FeO(OH) and α-FeO(OH) during the second salt fog phase, some magnetite remains on the surface. The second drying period leads to a continuous conversion from iron oxyhydroxides to iron oxides. The results show that physi- cal drying of the sample occurred within 2 h (in contrast to the chemical conversion, which took about 24 h), with MCR-ALS analysis of the spectra revealing the detailed dynamics of these transformations.
The results confirm that a compact Raman spectroscopy setup can be used to monitor and understand complex corrosion processes taking place in a custom salt fog chamber, allowing new insights to be generated for academic and industrial corrosion investigations. The coupling of in situ Raman spectroscopy and a salt fog chamber represents a valuable tool for future investigations of corrosion mechanisms, and for evaluating the resistance of newly developed coatings and alloys.
Acknowledgments
The Comet Center CEST is funded within the framework of COMET—Competence Centers for Excellent Technologies by BMVIT, BMDW as well as the Province of Lower Austria and Upper Austria. The COMET program is run by FFG. This work originates from research in iMESA (FFG 865864, CEST-K1, 2019–2022) project. The authors gratefully thank voestalpine Stahl GmbH and Recendt GmbH for support, and Wasatch Photonics for providing the Raman spectroscopy system.
References
(1) G. Koch, J. Varney, N. Thompson, O. Moghissi, M. Gould, and J. Payer, “International Measures of Prevention, Application, and Economics of Corrosion Technologies Study” (NACE International, Houston, TX, 2016), pp. 1–6.
(2) S.K. Dhawan, H. Bhandari, G. Ruhi, B.M. Bisht, and P. Sambyal, Corrosion Preventive Materials and Corrosion Testing (CRC Press, Boca Raton, FL, 2020).
(3) International Organization for Standardization, “Corrosion Tests in Artificial Atmospheres — Salt Spray Tests,” ISO 9227, 2017.
(4) E.D. Kiosidou, A. Karantonis, G.N. Sakalis, and D.I. Pantelis, Corros. Sci. 137, 127–150 (2018). DOI: 10.1016/j.corsci.2018.03.037.
(5) M. Ito, A. Ooi, E.Tada, and A. Nishikata, J. Electrochem. Soc. 167(10), 101508 (2020). DOI: 10.1149/1945-7111/ab9c85.
(6) J. Duchoslav, M. Arndt, T. Keppert, G. Luckeneder, and D. Stifter, Anal. Bioanal. Chem. 405(22), 7133–7144 (2013). DOI: 10.1007/s00216-013-7099-3.
(7) K. Hedenstedt, J. Bäckström, and E. Ahlberg, J. Electrochem. Soc. 164(9), H621–H627 (2017). DOI: 10.1149/2.0731709jes.
(8) T. Doi, T. Adachi, T. Kudo, and N. Usuki, Corros. Sci. 177, 108931 (2020). DOI: 10.1016/j.corsci.2020.108931.
(9) S.S. Raiman and G.S. Was, J. Nucl. Mater. 493, 207–218 (2017). DOI: 10.1016/j.jnucmat.2017.05.043.
(10) ASTM International, ASTM Standard B117-19 “Standard Practice for Operating Salt Spray (Fog) Apparatus” (West Con- shohocken, PA, 2019).
(11) Raman spectrum RHX124, KnowItAll Informatics System 2021 (John Wiley & Sons, Inc., Hoboken, NJ, 2001–2021)
(12) M. Hanesch, Geophys. J. Int. 177(3), 941–948 (2009). DOI: 10.1111/j.1365-246X.2009.04122.x.
(13) Raman spectrum RMX267, KnowItAll Informatics System 2021 (John Wiley Sons, Inc., Hoboken, NJ, 2001–2021)
(14) L. Shengxi and L.H. Hihara, J. Electrochem. Soc. 159(4), C147–C154 (2012). DOI: 10.1149/2.013204jes.
(15) M.B. Leban, T. Kosec, Eng. Fail. Anal. 79, 940–950 (2017). DOI: 10.1016/j.eng-failanal.2017.03.022.
(16) X. Nie, X. Li, C. Du, Y. Huang, and H. Du, J. Raman Spectrosc. 40, 76–79 (2009). DOI: 10.1002/jrs.2082
(17) Raman spectrum RHX183, KnowItAll Informatics System 2021 (John Wiley & Sons, Inc., Hoboken, NJ, 2001–2021)
(18) Raman spectrum RHX145, KnowItAll Informatics System 2021 (John Wiley & Sons, Inc., Hoboken, NJ, 2001–2021).
Arie Bleij, Maria Ponomareva, Markus Nadlinger, Gabriela Schimo-Aichhorn, and Pierluigi Bilotto are with the CEST Competence Center for Electrochemical Surface Technology GmbH in Linz, Austria. Dieter Bingemann and Cicely Rathmell are with Wasatch Photonics. Gerald Luckeneder and Gerald Haslehner are with voestalpine Stahl GmbH in Linz, Austria. Maria Ponomareva and Markus Valtiner are with the Vienna University of Technology in Vienna, Austria. Paul Gattinger and Markus Brandstetter are with the Research Center for Non Destructive Testing GmbH in Linz, Austria. Direct correspondence to: marketing@wasatchphotonics.com

AI-Powered SERS Spectroscopy Breakthrough Boosts Safety of Medicinal Food Products
April 16th 2025A new deep learning-enhanced spectroscopic platform—SERSome—developed by researchers in China and Finland, identifies medicinal and edible homologs (MEHs) with 98% accuracy. This innovation could revolutionize safety and quality control in the growing MEH market.
New Raman Spectroscopy Method Enhances Real-Time Monitoring Across Fermentation Processes
April 15th 2025Researchers at Delft University of Technology have developed a novel method using single compound spectra to enhance the transferability and accuracy of Raman spectroscopy models for real-time fermentation monitoring.
Nanometer-Scale Studies Using Tip Enhanced Raman Spectroscopy
February 8th 2013Volker Deckert, the winner of the 2013 Charles Mann Award, is advancing the use of tip enhanced Raman spectroscopy (TERS) to push the lateral resolution of vibrational spectroscopy well below the Abbe limit, to achieve single-molecule sensitivity. Because the tip can be moved with sub-nanometer precision, structural information with unmatched spatial resolution can be achieved without the need of specific labels.