Raman Spectroscopy in Analyzing Fats and Oils in Foods
Fats and oils are ubiquitous in natural and processed foods, providing necessary energy storage. Fat and oil content in foods also have important contributions to the shelf life, texture, compatibility with processing operations, and sensory profiles of food products. Understanding the molecular properties of fats and oils separately within a heterogeneous food matrix requires a multidisciplinary approach. Vibrational spectroscopy techniques are used throughout the food industry to gain product understanding, identify adulterated products, ensure quality, and control processes. In analyzing fats and oils in food, near-infrared (NIR) spectroscopy is an established analytical technique, and there are other growing applications of infrared (IR) and Raman spectroscopies. In particular, Raman spectroscopy is well suited to measure fats and oils because their C-H and C-C bonds are polarizable. In this article, we review the historical use of Raman spectroscopy in studying fats and oils in foods from Fourier transform (FT)–Raman spectroscopy to dispersive Raman spectroscopy. We also provide an overview of various Raman approaches to understand fat compositional heterogeneity in solid foods, identify polymorph or crystallinity, and measure fatty acid saturation. Examples in a variety of fat-containing foods demonstrate feasibility for Raman applications in the laboratory and process environments.
Lipids are a class of biological molecules that provide important energy storage, metabolism, and cell membrane structure functions. They encompass sterols, fatty acids, glycerides, phospholipids, and waxes. Saturated fatty acids are also called fats. Fats have higher melting points, are solid at room temperature, and are more stable. Unsaturated fatty acids are also called oils. Oils have lower melting points, are liquid at room temperature, and are less stable. Understanding lipids for biomedical, food and beverage, and now lipidomics applications, requires a variety of analytical tools and techniques, including chromatography, wet chemistry, molecular probes, mass spectrometry (MS), and vibrational spectroscopy (1–3). Raman spectroscopy and nonlinear Raman spectroscopy techniques are particularly well suited to measure lipids because of a high Raman cross section and high optical scattering. A book, titled Raman Spectroscopy for Chemical Analysis by Rich McCreery, starts with the theory and goes into calculating the cross sections of some simple molecules. C-H and C-C bonds are polarizable, and they comprise the majority of a lipid. As a result, it stands to reason that lipids would have a higher Raman cross section than other biological molecules, such as proteins or nucleic acids (4). This assumption was verified by calculating the cross-sections of cholesterol and proteins, where the cross section of the 1440 cm-1 band is three times higher than that of proteins (5). Another reason that lipids are easily measured by Raman spectroscopy is because of optical scattering, particularly in biological tissues. The density of the scattering is considered in calculating the Raman intensity, but that calculation only considers Raman scatters. Optical scattering also occurs elastically, so that would affect light fluence and sampling volume. Fatty tissues have a higher optical scattering coefficient than muscle tissues (6,7).
Because of their importance and strong Raman scattering, lipids have been studied by Raman spectroscopy since 1936. A 1936 paper by Jogarao is the first acknowledged paper on Raman spectroscopy analysis of food oils (8). Olive, gingelli, castor, coconut, groundnut oils, cocogem, and buffalo ghee were examined by Raman spectroscopy using an exposure of nearly 48 h to collect a spectrum. Bands at 1302, 1469, 1661, and 2873 cm-1 were identified and assigned to C-H, C-O-C, and C=C groups. Other early work by van Den Hende examined various saturated fatty acids and identified cis- and trans-isomers in oleic acid (articles in French) (9,10). Additional early work studying oleic acid was described in papers written in 1945 and 1951, which focused on the chemistry of lipids and contained references to research papers written in 1943 and 1950 that were on Raman spectroscopy. However, those research papers could not be obtained by the authors. An experimental challenge that may have limited the number of Raman-based studies, in addition to the long exposure times, was the ability to purify samples (9). Thus, we can also draw on conclusions from relevant work that was performed in long chain hydrocarbons (11,12), small-chain carboxylic acids (13), and other model compounds (14).
The perception that oil or fat purification was a limitation of the Raman technique resulted in few papers being published in this application again until the 1970s. In the 1970s, studies using Raman spectroscopy to examine lipids received little attention relative to other biopolymers such as proteins, amino acids, and nucleic acids (15). However, the papers that were published in this decade demonstrated an increased sophistication of the Raman technique, including the use of Fourier-transform (FT)–Raman spectroscopy, and the scientific questions that Raman spectroscopy was trying to address. Some example applications include biophysics on mixed lipid-protein systems, measurement of chain length, cis- and trans-isomer composition, lipids in natural products, and classification of lipids (16–20).
Today, dispersive Raman, FT-Raman, enhanced Raman, and nonlinear Raman techniques are used to measure lipids. In particular, dispersive and non-linear techniques are growing in basic science and industrial applications. Readers are referred to excellent reviews by Li and others on coherent anti-Stokes Raman spectroscopy and by Prince and others on stimulated Raman scattering (21,22). This paper focuses on dispersive Raman spectroscopy of oils and fats in food and beverage applications.
Materials and Methods
A review of the literature was performed in Google Scholar using the terms Raman spectroscopy, Raman, and Raman scattering to describe the technology, and the search terms lipids, oils, fats, and fatty acids were used to describe the target molecule family. The references in several review papers were used to retrace the history of Raman spectroscopy to the earliest papers.
For experiments performed by the authors, such as the fats and oils identification and the salmon and chocolate studies, a Raman Rxn2 (Endress+Hauser) Raman analyzer operating at 785 nm or 1000 nm was used. Raman measurements were performed with a Rxn-10 collimated probe equipped with a non-contact optic, immersion optic, or a Rxn-20 large volumetric probe (Endress+Hauser). Measurements were performed at ambient laboratory conditions of commercially available samples with no additional sample preparation. Data were preprocessed using Grams/AI spectroscopy software (Thermo Scientific) and using routines written in-house.
Industrial Applications of Dispersive Raman
More recent applications have expanded on the historical uses to now include structure elucidation, the role of lipids in health and disease, and lipidomics (23). Within food and beverage applications, there has been an increased use of portable, benchtop, and process Raman spectroscopy in edible oil measurements. We highlight a few applications in oil and fat quality, and oils and fats in foods demonstrate the utility of Raman spectroscopy in the field. They establish scientific feasibility for additional tests on polymorphism, accelerated stability, or coproducts.
Oil Quality Understanding
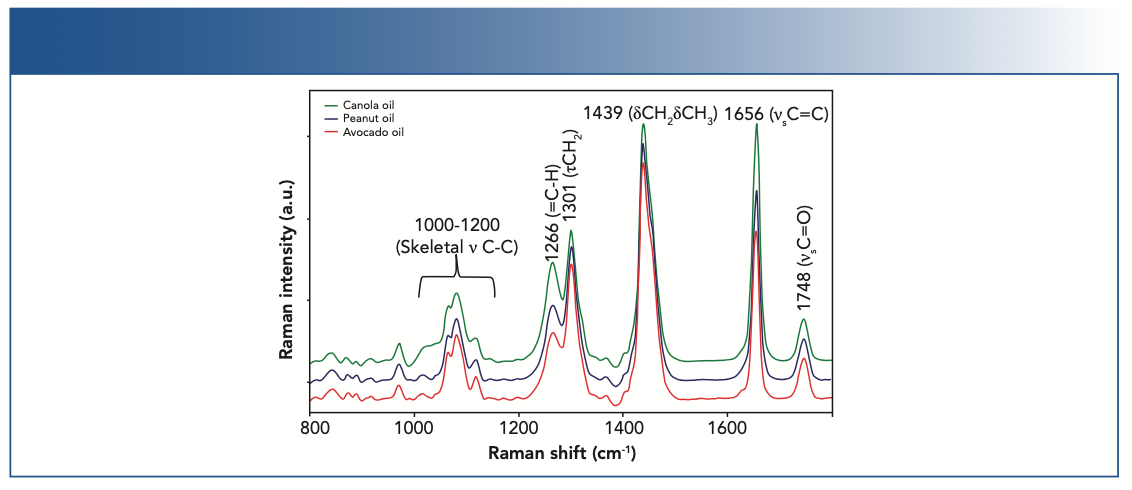
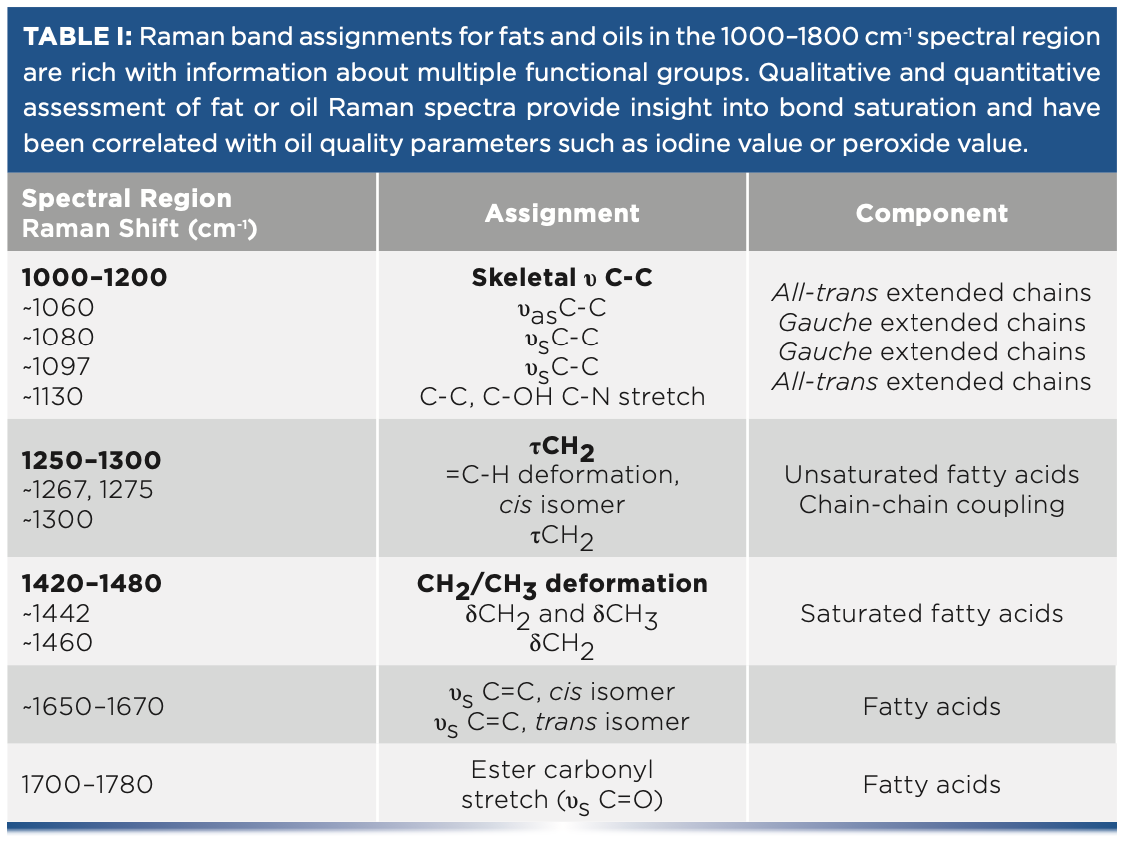
Figure 1 shows the Raman spectra of canola, peanut, and avocado oils between 600 and 1775 cm-1 as representative oils. Visual inspection of the band position, width, and intensity provides an initial understanding of multiple functional groups. The main bands of fats and oils are noted in Figure 1, with the band assignments referenced in Table I. A parameter of interest is saturation. The position and width of the band at ~1444 cm-1 and ~1661 cm-1 shifts to a lower Raman shift and becomes more narrow with increasing saturation. Total unsaturation can be determined quantitatively by measuring the ratio of the C=C stretch (υC=C) centered at 1661 cm-1 to the CH2 scissoring deformation (δCH2) at 1444 cm-1. Calculating band intensity ratios is a straightforward approach to quantifying total unsaturation. Cis-isomer content can also be determined from the Raman spectrum. The band at 1272 cm-1 is attributed to in-plane =C–H deformation in an unconjugated cis double bond. The intensity of this band ratioed to the in-phase methylene twisting vibration at 1306 cm-1 provided a direct cis-isomer measurement, which is illustrated by comparing the Raman spectrum of vegetable oil with that of partially hydrogenated vegetable shortening. Hydrogenation results in a preferential decrease in the cis- or trans-isomer ratio.
FIGURE 1: Raman spectra of canola, peanut, and avocado oils were collected from commercially available samples. Major bands in the oil spectra are noted and assigned.
Authentication, Adulteration, and Blending
An early application was in oil discrimination and identification of adulterated oils. Adulteration is the deliberate and undeclared substitution of low-quality, but indistinguishable using senses, ingredients to hide poor quality or increase the volume of high-value foods. Adulteration represents a significant food safety, labeling, and product quality concern. Olive oils are frequently adulterated because they are high-quality foods, and adulterated oils often are indistinguishable through physical or chemical constants such as iodine value, saponification, refractive index, or density. A 1994 review by Li-Chan summarized advances in chromatographic and spectroscopic techniques to measure chemical composition markers of adulteration including Raman spectroscopy (24). Since the time the review was published, studies have reported application success using FT-Raman spectroscopy, Raman microscopy, handheld Raman, and fiberoptic Raman for a variety of adulterants and data analysis approaches (25–29). A comprehensive three-year longitudinal study by Kwofie and others enabled an understanding of supplier variations and yearly variations for 15 varieties of oils (30). As hardware and chemometric techniques improved along with a better understanding about the field, we saw many sophisticated questions answered. Two recent papers that used Raman spectroscopy to authenticate geographical location, identify adulterants, and discriminate cultivars demonstrate how the hardware and chemometric techniques have significantly improved (31,32).
Univariate or multivariate analyses are useful for Raman-based oil adulteration measurements. Univariate analyses are straightforward and allow for chemical changes to be easily interpreted. Univariate markers of total unsaturation and cis isomer content have been proposed in the literature. Partial least squares (PLS) analysis was successful in identifying canola oil, rapeseed oil, and spent oil adulterants. The principles of measurement for adulteration can be applied toward blending because both involve the identification and quantification of a mixed product. Blending is the deliberate and declared substitution of different ingredients to improve labeling claims or sensory attributes. Some common examples of a blended product are butters blended with margarine or olive oil. Butter blended with margarine, starch, or plant-based oils is also common practice. An important aspect to blending is accurate and rapid quantification because errors can lead to product giveaway or reduce process efficiency. Similar to adulterated products, blended products generally do not change the taste of butter and detection relies upon analysis. Laboratory-based measurements can be expensive and require specially trained staff and consumables. A paper by Nedeljković and others demonstrates the Raman-based identification of margarine in butter–margarine mixtures (33). The motive behind the study was for adulteration purposes, but the study can also be viewed in the context of a product blending application.
In the study by Nedeljković and others, margarine was distinguished from butter using bands at 1268 and 1656 cm-1 associated with the C=C double bond and at 973 cm-1 associated with the choline group in the phospholipid. Raman-based calculations were similar to known values measured by weight. PLS regression further confirmed the very good overall performance of the model, with the coefficient plot showing large positive values at the locations of the peaks discussed above. For the calibration data, R2 = 0.991 and RMSECV = 3.199. For the test data, R2 = 0.994 and RMSEP = 2.757. Principal component analysis (PCA) data showed a relationship between the second principal component and the margarine content. The loading plot confirms that the known chemical moieties of margarine (the C=C double bond and the choline group) vary together with margarine concentration because of the consistently negative peaks at 973, 1268, and 1656 cm-1, the intensity of which closely follow the margarine content in the calibration samples. The PCA of model mixtures demonstrate that the three Raman peaks at 973, 1268, and 1656 cm-1 can be attributed entirely to vegetable fat in margarine and those peaks can be used to quantify margarine content in butter. This important feature means that the fat does not have to be isolated from the rest of the sample as was necessary in a chromatographic method. The removal of the fat-extraction step is an improvement toward streamlining the analysis for the laboratory or process environment.
Dairy Goods
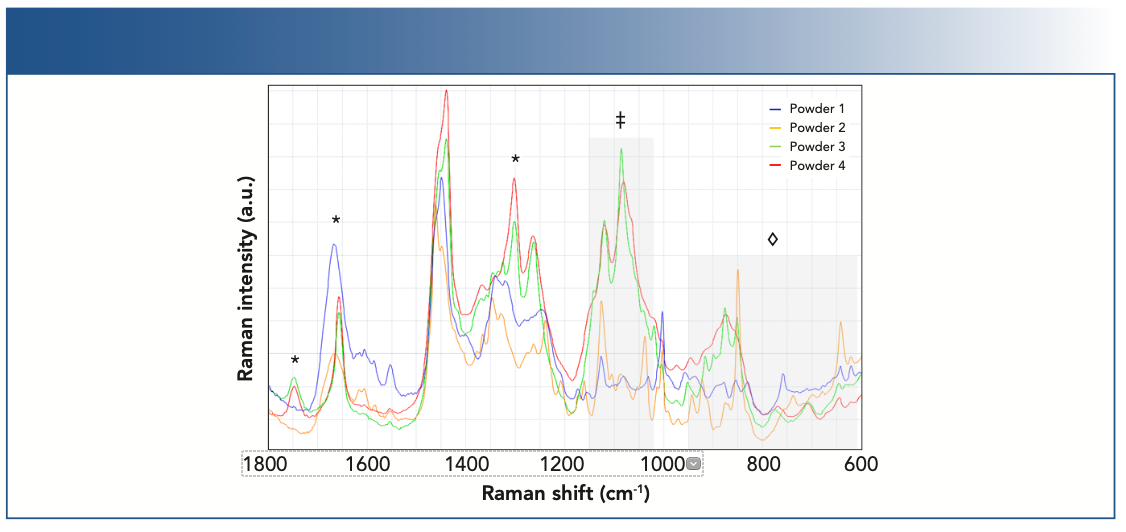
Different types of macronutrients are commonly found in foods, with fats, proteins, and carbohydrates being the main macronutrients. Measurement of these macronutrients in a heterogeneous matrix can be achieved using Raman spectroscopy. Milk powders is an example of a common food that contains fats, protein, and carbohydrates. Cheese is another dairy product that contains fats and proteins. Solid milk powders with various concentrations of fats, carbohydrates, and proteins as shown in Table II were obtained and analyzed as-received. All milk powder samples were analyzed in a laboratory using a Raman Rxn2 Hybrid analyzer (λ = 785 nm). The analyzer was equipped with a 6-mm Rxn-20 probe, which provided a 6-mm spot size. The Rxn-20 probe was positioned approximately 25 cm from the solid powder samples. Raman measurements of the milk powders were collected for 2 min directly from open containers or as loosely packed in a plastic container.
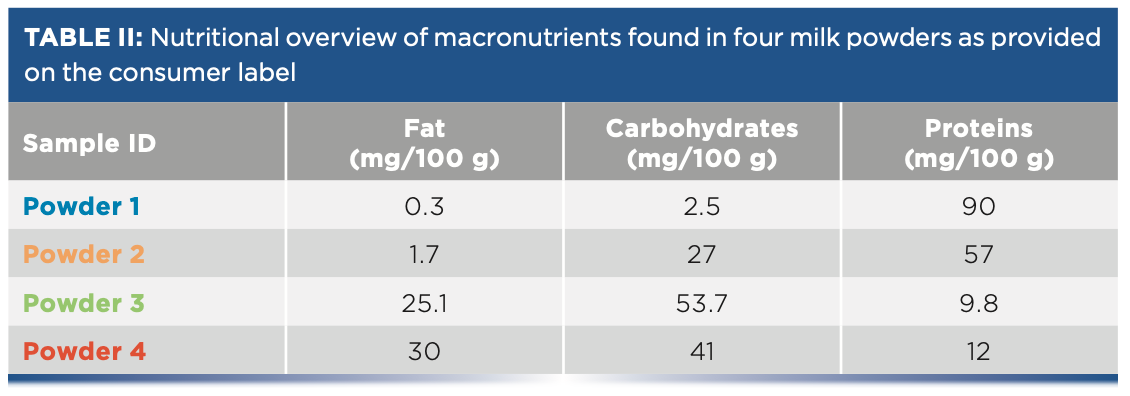
Figure 2 shows the representative Raman spectra from four different milk powders. Bands on the spectra arising from lipids (or fats), proteins, and carbohydrates were identified using known literature values (15,34). Importantly, bands from the individual components were well-resolved and enable univariate models for quantification. Although there is spectral overlap of the constituents, the noted areas in Figure 2 can be used to monitor changes in macronutrients. In the example of the 1620–1800 cm-1 region, a more narrow shape of the carbonyl stretch envelope at ~1650 cm-1 and the emergence of relatively narrow bands at ~1740 and 1301 cm-1 indicates a preponderance of lipids in powders 3 and 4. More intense and broader bands in the 1040–1120 cm-1 region is indicative of a higher carbohydrate amount in powders 3 and 4. By contrast, a broader carbonyl stretch envelope at ~1650 cm-1 and a narrow ring breathing band at ~1005 cm-1 indicates an observable presence of proteins in powders 1 and 2.
FIGURE 2: Milk powders of varying protein, carbohydrate, and fat concentrations were measured by Raman spectroscopy. The specificity of the Raman spectrum enabled simultaneous measurement of the three macronutrients and contributions from fats (*), protein amino acids (◊), and carbohydrates (‡) were observed.
Salmon
Fish and meats are other common foods where there are different types of macronutrients, which are mostly proteins and fats. Raman spectra were collected from store-bought samples of Atlantic salmon, wild coho, and smoked salmon. Two experiments were performed. In the first experiment, laboratory tests were performed using a benchtop Raman analyzer (Endress+Hauser) operating at 1000 nm equipped with a small-area (measured area ~100 μm2) contact probe. The probe was manually placed on the surface of the fish and signal collected for 10–60 s. In the second experiment, a large volumetric noncontact probe (measured volume ~3–6 mm3) was used to assess compatibility with processing plant conditions. Spectra were presented without any preprocessing. The initial tests performed on the store-bought salmon indicated a feasibility of 1000 nm excitation for laboratory measurements. The small-area probe was able to collect the signal from each of these zones without significant interference from adjacent zones. Figure 3 shows the representative Raman spectra from Atlantic salmon, where there were visually apparent fat-rich and muscle-rich zones. The Raman spectra were also visually different. The top spectrum contained features from mostly lipids in fat, and the bottom spectrum contained the protein features. The approach of using a small-area contact probe was applicable when more precise zonal measurements were required for quality control purposes. Notably, there were no bands observed from carotenoid pigments in spectra from Atlantic salmon. By contrast, the spectra of wild coho salmon contained a signal from carotenoid pigments in addition to lipid and protein bands (data not shown).
FIGURE 3: Raman spectra showing main protein (black) and fat (red) related bands for fresh salmon. Contributions from fats (‡) and protein amino acids (*) are shown.
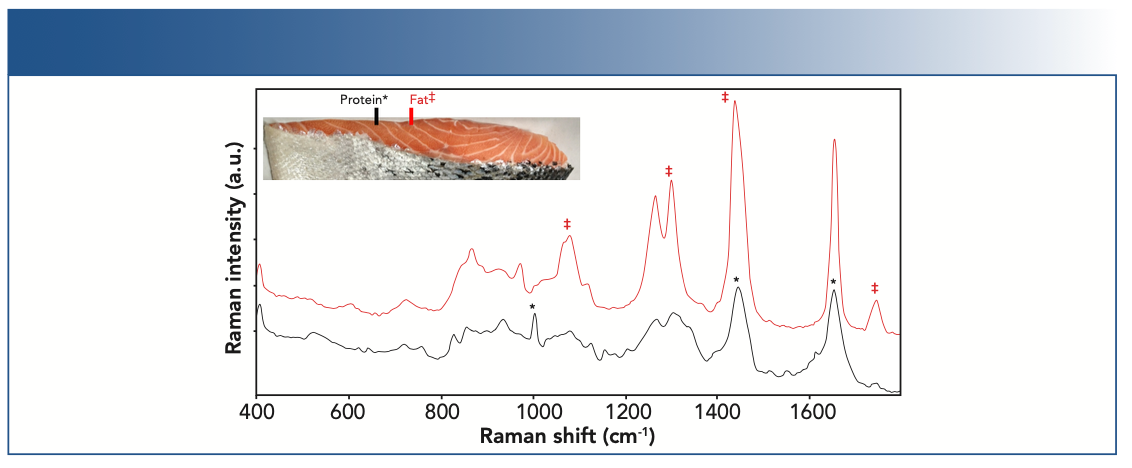
Mock process measurements were performed on Atlantic salmon. The large volumetric probe provides a noncontact measurement over a large volume, and the resulting spectra had contributions from the fatty and muscle portions of the tissue. Measurement times were optimized to be compatible with conveyor belt speeds. The Raman spectra collected at 1, 3, and 5 s were suitable for input into a univariate or multivariate model with good signal-to-noise (S/N) and spectral resolution. Similar to the measurements collected in dairy solids, the width of the amide I envelope at ~1660 cm-1 and the presence of the ring breathing band at ~1000 cm-1 were used as protein markers.
Chocolate
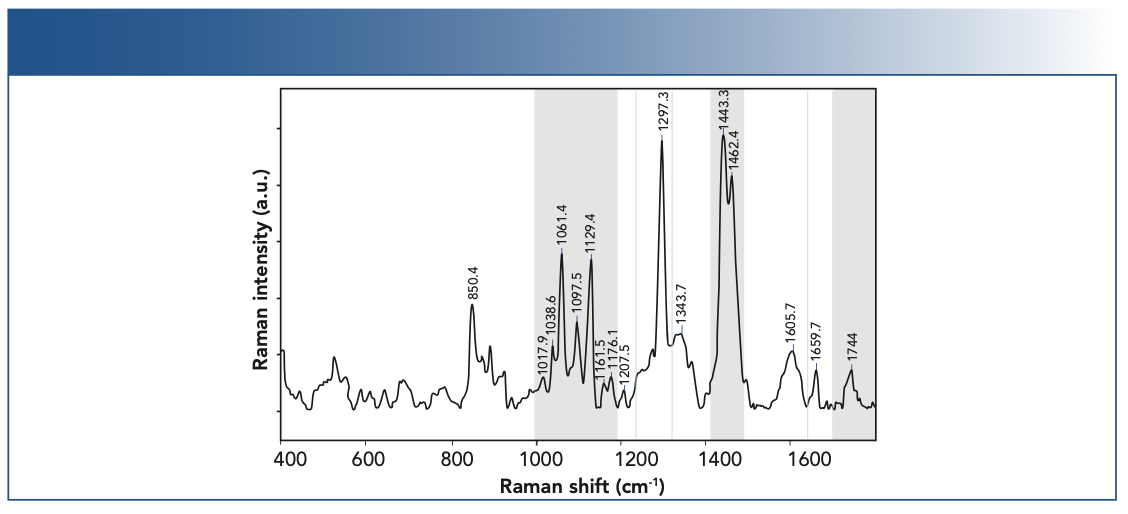
The primary constituents of chocolate are cocoa butter and sugar, and measurement of dark or milk chocolate is a challenge for Raman spectroscopy performed in the visible or shortwave NIR because cocoa solids strongly fluoresce (35). To mitigate fluorescence, FT-Raman and surface-enhanced Raman spectroscopy (SERS) was used to study chocolate, cocoa butter, and fermented cocoa beans (36–39). Recent studies reporting dispersive unenhanced Raman with 1064 nm excitation piqued our curiosity to use a benchtop 1000 nm Raman system for chocolate measurements (40). A 1000 nm Raman Rxn2 analyzer (laser intensity = 100 mW), equipped with an Rxn-10 probe and non-contact optic that resulted in a spot size of 150 μm, was used to collect Raman spectra from commercially available white-, milk-, and dark-chocolate samples (41). Raman spectra were compared with literature studies in cocoa butter polymorphs, lipid extractions of chocolate, and chocolate samples (35,36,42). Figure 4 shows an example dark-chocolate spectrum collected with 1000 nm excitation. Qualitative and quantitative analysis of several functional groups of cocoa butter and sucrose was performed directly from the chocolate Raman spectrum without further sample preparation. Our initial results showed that Raman spectra collected at 1000 nm demonstrated sufficient background reduction to enable observation of bands throughout the fingerprint region for cacao nibs and white-, milk-, and dark-chocolate samples.
FIGURE 4: Raman spectrum of chocolate sample showing the major band positions.
Conclusions
Raman spectroscopy is well suited for measuring oils and fats because it provides a highly specific, multicomponent measurement in a process or laboratory environment. The specificity of Raman spectroscopy enables a simple visual inspection or spectral library comparison for qualitative insight or quantification using univariate or multivariate models. Examples in the historical literature and recent laboratory-to-process studies show that there is still much potential in the technique for basic science to process control applications. We are enthusiastic about emerging nonlinear techniques, new applications in darkly colored foods, and their increased use in manufacturing.
References
(1) M.R. Wenk, Cell. 143(6), 888–895 (2010). DOI: https://doi.org/10.1016/j.cell.2010.11.033.
(2) J.J.A. Wijs, Analyst 54(634), 12–14 (1929). DOI: https://doi.org/10.1039/AN9295400012.
(3) American Oil Chemists Society, Official Methods and Recommended Practices of the AOCS (American Oil Chemists Society, Champaign, IL, 7th Ed., 2017).
(4) R.L. McCreery, Raman Spectroscopy for Chemical Analysis (John Wiley & Sons, Inc., Hoboken, NJ, 2000) Vol. 157.
(5) R. Manoharan, J.J. Baraga, M.S. Feld, and R.P. Rava, J. Photochem. Photobiol. B. 16(2), 211–33 (1992). DOI: https://doi.org/10.1016/10111344(92)80009-K
(6) A. Kienle, L. Lilge, M.S. Patterson, R. Hibst, R. Steiner, and B.C. Wilson, Appl. Opt. 35(13), 2304–2314 (1996). DOI: https://doi.org/10.1364/AO.35.002304
(7) S.L. Jacques, Phys. Med. Biol. 58(11), R37–R61 (2013). DOI: https://doi.org/10.1088/00319155/58/11/R37
(8) C. Jogarao, Proc. Indian Acad. Sci. 4(4), 459–462 (1936).
(9) A. van Den Hende, Bull Sociétés Chim. Belg. 54(1), 88–95 (1945). DOI: https://doi.org/10.1002/bscb.19450540108
(10) A. van Den Hende, Bull Sociétés Chim Belg. 56(9–12), 328–338 (1947). DOI: https://doi.org/10.1002/bscb.19470560907
(11) K.S. Pitzer, J. Chem. Phys. 8(9), 711–720 (1940). DOI: https://doi.org/10.1063/1.1750742
(12) J.W. McCutcheon, M.F. Crawford, and H.L. Welsh, Oil Soap. 18(1), 9–11 (1941). DOI: https://doi.org/10.1007/BF02544221
(13) P. Koteswaram, J. Chem. Phys. 7(1), 88 (1939). DOI: https://doi.org/10.1063/1.1750332
(14) J.E. Kilpatrick and K.S. Pitzer, J. Res. Natl. Bur. Stand. 38(2), 191 (1947). DOI: https://doi.org/10.6028/jres.038.009
(15) J.L. Koenig, J. Polym. Sci. Macromol. Rev. 6(1), 59–177 (1972).
(16) K. Larsson and R.P. Rand, Biochim. Biophys. Acta BBA - Lipids Lipid Metab. 326(2), 245–255 (1973). DOI: https://doi.org/10.1016/0005-2760(73)90250-6
(17) G.F. Bailey and R.J. Horvat, J. Am. Oil Chem. Soc. 49(8), 494–498 (1972). DOI: https://doi.org/10.1007/BF02582487
(18) C.H. Warren and D.L. Hooper, Can. J. Chem. 51(23), 3901–3904 (1973). DOI: https://doi.org/10.1139/v73-581
(19) S.K. Freeman, J. Agric. Food Chem. 21(4), published online only (1973). Available from: https://pubs.acs.org/doi/pdf/10.1021/ jf60188a001. DOI: https://doi.org/10.1021/ jf60188a001
(20) V. Baeten, P. Hourant, M.T. Morales, and R. Aparicio, J. Agric. Food Chem. 46(7), 2638–2646 (1998). DOI: https://doi.org/10.1021/jf9707851
(21) S. Li, Y. Li, R. Yi, L. Liu, and J. Qu, Front Phys. 8, available online only (2020). Available from: https://www.frontiersin.org/article/10.3389/ fphy.2020.598420. DOI: https://doi.org/10.3389/ fphy.2020.598420
(22) R.C. Prince, R.R. Frontiera, and E.O. Potma, Chem. Rev. 117(7), 5070–5094 (2017). DOI: https://doi.org/10.1021/acs.chemrev.6b00545
(23) K. Czamara, K. Majzner, M.Z. Pacia, K. Kochan, A. Kaczor, and M. Baranska, J. Raman Spectrosc. 46(1), 4–20 (2015). DOI: https://doi.org/10.1002/jrs.4607
(24) E. Li-Chan, Trends Food Sci. Technol. 5(1), 3–11 (1994). DOI: https://doi.org/10.1016/0924-2244(94)90042-6
(25) V. Baeten, M. Meurens, M.T. Morales, and R. Aparicio, J. Agric. Food Chem. 44(8), 2225–2230 (1996). DOI: https://doi.org/10.1021/jf9600115
(26) N. McReynolds, J.M. Auñón Garcia, Z. Guengerich, T.K. Smith, and K. Dholakia, Appl. Spectrosc. 70(11), 1872–82 (2016). DOI: https://doi.org/10.1177/0003702816645931
(27) T.K. de Lima, M. Musso, and D. Bertoldo Menezes, Food Chem. 333, 127454 (2022). DOI: https://doi.org/10.1016/j.foodchem.2020.127454
(28) H. Jin, H. Li, Z. Yin, Y. Zhu, A. Lu, D. Zhao, et al, Food Chem. 362, 130191 (2021). DOI: https://doi.org/10.1016/j.foodchem.2021.130191
(29) Y. Lee, J. Kim, H. Jeong, and H. Chung, Appl. Spectrosc. Rev. (2022). DOI: https://doi.org/10.1080/05704928.2022.2051535
(30) F. Kwofie, B.K. Lavine, J. Ottaway, and K. Booksh, Appl. Spectrosc. 74(6), 645–654 (2020)
(31) E. Kakouri, P.K. Revelou, C. Kanakis, D. Daferera, C.S. Pappas, and P.A. Tarantilis, Foods 10(7), 1565 (2021). DOI: https://doi.org/10.3390/foods10071565
(32) S. Portarena, C. Anselmi, C. Zadra, D. Farinelli, F. Famiani, C. Baldacchini, et al, Food Control 96, 137–145 (2019). DOI: https://doi.org/10.1016/j.foodcont.2018.09.011
(33) A. Nedeljković, P. Rösch, J. Popp, J. Miočinović, M. Radovanović, and P. Pudja, Food Anal. Methods 9(5), 1315–1320 (2016). DOI: https://doi.org/10.1007/s12161-015-0317-1
(34) J. De Gelder, K. De Gussem, P. Vandenabeele, and L. Moens, J. Raman Spectrosc. 38(9), 1133–1147 (2007). DOI: https://doi.org/10.1002/jrs.1734
(35) I.A. Larmour, K. Faulds, and D. Graham, Anal. Methods 2(9), 1230–1232 (2010). DOI: https://doi.org/10.1039/C0AY00320D
(36) L.N. de Oliveira, J.C. de R. Castro, M.A.L. de Oliveira, and L.F.C. de Oliveira, J. AOAC Int. 98(6), 1598–607 (2015). DOI: https://doi.org/10.5740/jaoacint.15-083
(37) P. Vargas Jentzsch, V. Ciobotă, W. Salinas, B. Kampe, P.M. Aponte, P. Rösch, et al, Food Chem. 211, 274–280 (2016). DOI: https://doi.org/10.1016/j.foodchem.2016.05.017
(38) H.G.M. Edwards, S.E.J. Villar, L.F.C. de Oliveira, and M.L. Hyaric, Anal. Chim. Acta. 538(1), 175–180 (2005). DOI: https://doi.org/10.1016/j.aca.2005.02.039
(39) N. Devos, D. Reyman, and S. Sanchez-Cortés, Food Chem. 342, 128301 (2021). DOI: https://doi.org/10.1016/j.foodchem.2020.128301
(40) J. Heuler, S. He, S. Ambardar, and D.V. Voronine, Sci. Rep. 10(1), 9833 (2020). DOI: https://doi.org/10.1038/s41598-020-66820-1
(41) K. Esmonde-White, M. Lewis, and I. Lewis, “Raman Spectroscopy of Chocolate using 1000 nm Excitation,” presented at SciX Conference, Providence, RI (2021).
(42) S. Bresson, D. Rousseau, S. Ghosh, M.E. Marssi, and V. Faivre, Eur. J. Lipid Sci. Technol. 113(8), 992–1004 (2011). DOI: https://doi.org/10.1002/ejlt.201100088
Karen Esmonde-White, Mary Lewis, Thomas Perilli, Tomaso Della Vedova, and Ian Lewis are with Endress+Hauser. Direct correspondence to: karen.esmonde-white@endress.com.

Nanometer-Scale Studies Using Tip Enhanced Raman Spectroscopy
February 8th 2013Volker Deckert, the winner of the 2013 Charles Mann Award, is advancing the use of tip enhanced Raman spectroscopy (TERS) to push the lateral resolution of vibrational spectroscopy well below the Abbe limit, to achieve single-molecule sensitivity. Because the tip can be moved with sub-nanometer precision, structural information with unmatched spatial resolution can be achieved without the need of specific labels.
AI-Powered SERS Spectroscopy Breakthrough Boosts Safety of Medicinal Food Products
April 16th 2025A new deep learning-enhanced spectroscopic platform—SERSome—developed by researchers in China and Finland, identifies medicinal and edible homologs (MEHs) with 98% accuracy. This innovation could revolutionize safety and quality control in the growing MEH market.
New Study Reveals Insights into Phenol’s Behavior in Ice
April 16th 2025A new study published in Spectrochimica Acta Part A by Dominik Heger and colleagues at Masaryk University reveals that phenol's photophysical properties change significantly when frozen, potentially enabling its breakdown by sunlight in icy environments.