Infrared Dynamic Imaging for the Examination of Chemical Reactions
The use of imaging to study the reaction process involved in the curing of a cyanoacrylate adhesive is investigated.
The analysis of dynamic systems such as chemical reactions has generally been relegated to "macro" analysis methods. Infrared imaging techniques can provide chemical and spatial information about a sample on a microscale and as the speed of imaging methods improves it is only natural to apply imaging to the analysis of samples that are changing chemically within a defined time scale. This "dynamic imaging" method could be used to probe many different kinds of samples on a defined time scale, providing insights to the kinetics of chemical reactions on a microscopic basis. This paper investigates the use of imaging to study the reaction process involved in the curing of a cyanoacrylate adhesive.
The use of "time-resolved" or "dynamic imaging" methods for various samples has been described previously in various texts (1–7). To our knowledge, however, there has not been a comparison of the reaction rates for a macro observation of a chemical kinetics reaction to the same reaction observed on the micro scale. It was of interest to us to review the chemical kinetics observed for the curing of a cyanoacrylate adhesive compound in both the macroscale and microscale (Figure 1) to see if the reaction rates would compare for both observation methods.
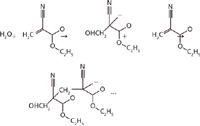
Figure 1: Polymerization reaction sequence of ethylcyanoacrylate adhesive.
Figure 1 outlines the polymerization reaction of the cyanoacrylate adhesive as it cures. The reaction is initialized by an absorption of an OH group from atmospheric water by the adhesive and the polymerization reaction proceeds continuously until the unpolymerized ethylcyanoacrylate molecules are depleted. The analysis of the polymerization reaction was determined by utilizing Fourier transform infrared (FT-IR) spectroscopy in a time-resolved mode. The spectra were collected as individual macro- or microspectra of the adhesive in a time-based sequence. By collecting several sets of spectra of the adhesive until the completion of the curing reaction, which can take as long as 1300–1800 s, the degree of polymerization was observed in the infrared spectra as the reaction progressed.

Figure 2: Mid-infrared spectra of ethylcyanoacrylate adhesive at 0 s (blue) and 1000 s (red).
For the macro experiment, the cyanoacrylate adhesive was spread on a 10 × 10 mm KBr window and another window was placed on top of the adhesive to obtain a uniform layer of the adhesive. Infrared sample spectra were collected using a Jasco FT-IR-6300 instrument at 8 cm-1 resolution, utilizing four sample scans per spectrum ratioed against a 256-scan background spectrum. A time resolution of 4 s between sample scans was used to obtain spectra for approximately 1800 s (30 min).
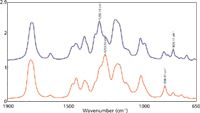
Figure 3: Fingerprint region of mid-IR spectra at 0 s (blue) and 1000 s (red).
For the microscopy experiments, the adhesive was prepared in the same manner, but discrete microscope spectra were collected of the adhesive in a "lattice mapping" mode. For the mapping experiments, mid-infrared spectra were collected using a Jasco IRT-7000 FT-IR microscope system equipped with a 16 × 1 linear-array MCT detector. Mapping spectra of four co-added sample scans of 8 cm-1 resolution ratioed vs. 256 background scans were obtained for the adhesive sample as it cured. Mapping data were collected from a 16 × 16 point matrix of 187.5 × 187.5 μm, with an effective spatial resolution of 12.5 μm per sample spectrum. A time resolution of 20 s per sample mapping was utilized for observations of the mapping area during a total observation time of approximately 1400 s.
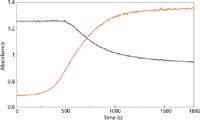
Figure 4: Extracted absorption traces observed during the macro reaction for the 1290 cm-1 (blue) and 1254 cm-1 (red) mid-IR peaks.
Results and Discussion
Figure 2 outlines the mid-infrared spectra of the adhesive at the beginning of the reaction (blue trace) and near the end of the curing (red trace). Figure 3 is a closer examination of the fingerprint region, with specific peaks labeled in the traces. The C-H and C-C peaks at 1254 and 858 cm-1, respectively, are increasing during the reaction, indicating the increase in the number of the CH2-C-CH2 bonds as the polymerization proceeds. Conversely, the C-H and C=C modes at 1290 and 804 cm-1, respectively, are decreasing as the bonds associated with the C=C group are rearranged during the curing reaction.
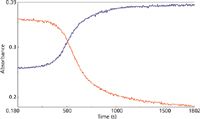
Figure 5: Extracted absorption traces observed during the macro reaction for the 858 cm-1 (red) and 804 cm-1 (blue) mid-IR peaks.
The changes in the vibrational modes were observed for multiple examples of the cyanoacrylate curing reaction and the reaction kinetics calculated for the increasing and decreasing peak absorbance in the infrared spectra for the 1290 and 1254 cm-1 peaks (Figure 4) and the 858 and 804 cm-1 peaks (Figure 5) for the macro experiment. Additional plots of the 1290 and 1254 cm-1 peaks (Figure 6) and the 858 and 804 cm-1 (Figure 7) peaks for the micro experiment are also displayed. These figures all display the increasing and decreasing absorbance values for the vibrational motions outlined earlier. The reaction kinetics values are calculated for these peak absorbance changes and the results for these calculations are displayed as Table I.
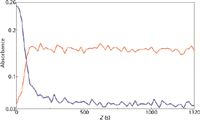
Figure 6: Extracted absorption traces observed during the micro reaction for the 1290 cm-1 (blue) and 1254 cm-1 (red) mid-IR peaks.
As outlined in Table I, the macro and micro sampling methods provide reaction rate values of the time constant, reaction rate, and half-life values that agree well within each experiment. However, there is a significant disagreement between the macro and micro sampling methods themselves. Presumably this may be because of the thickness of the adhesive layer prepared for the experiments or changes in the atmospheric water levels during the reaction, but these variables were unable to be verified in the current study.
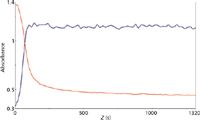
Figure 7: Extracted absorption traces observed during the micro reaction for the 858 cm-1 (red) and 804 cm-1 (blue) mid-IR peaks.
Conclusions
The macro and micro sampling methods for observation of an ethylcyanoacrylate adhesive curing reaction can provide useful kinetics data for the adhesive curing. Although the reaction data calculated from the mid-infrared data does not compare well between the macro and micro observation methods, it was felt that this could be caused by thickness of the adhesive preparation. These experiments demonstrate that additional information can be gained by using an infrared imaging method so that the reaction kinetics on a microscale can be investigated for other chemical systems. In this instance, standard commercial instrumentation was used for the imaging experiments and no special instrumentation or accessories were required.
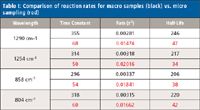
Table I: Comparison of reaction rates for macro samples (black) vs. micro sampling (red)
References
(1) C.A. Coutts-Lendon, N.A. Wright, E.V. Miseo, and J.L. Koenig, J. Con. Rel. 93, 223 (2003).
(2) G. Srinivasan and R. Bhargava, Spectrosc. 22, 30 (2007).
(3) T. Tadokoro, T. Fukazawa, and H. Toriumi, Jpn. J. Appl. Phys. 36, 1207 (1997).
(4) R. Bhargava and I.W. Levin, Appl. Spectrosc. 57, 357 (2003).
(5) R. Bhargava and I.W. Levin, Macromolecules 36, 92 (2003).
(6) R. Bhargava and I.W. Levin, Appl. Spectrosc. 58, 995 (2004).
(7) H. Sugiyama, J. Koshoubu, S. Kashiwabara, T. Nagoshi, R.A. Larsen, and K. Akao, Appl. Spectrosc. 62, 17 (2008).
Richard A. Larsen, PhD, is a spectroscopy products manager with Jasco, Inc., in Easton, Maryland. John Carriker is a chiroptical spectroscopy products manager with Jasco, Inc. Direct correspondence to: rlarsen@jascoinc.com

Introduction to Satellite and Aerial Spectral Imaging Systems
April 28th 2025Modern remote sensing technologies have evolved from coarse-resolution multispectral sensors like MODIS and MERIS to high-resolution, multi-band systems such as Sentinel-2 MSI, Landsat OLI, and UAV-mounted spectrometers. These advancements provide greater spectral and spatial detail, enabling precise monitoring of environmental, agricultural, and land-use dynamics.
AI Shakes Up Spectroscopy as New Tools Reveal the Secret Life of Molecules
April 14th 2025A leading-edge review led by researchers at Oak Ridge National Laboratory and MIT explores how artificial intelligence is revolutionizing the study of molecular vibrations and phonon dynamics. From infrared and Raman spectroscopy to neutron and X-ray scattering, AI is transforming how scientists interpret vibrational spectra and predict material behaviors.
Real-Time Battery Health Tracking Using Fiber-Optic Sensors
April 9th 2025A new study by researchers from Palo Alto Research Center (PARC, a Xerox Company) and LG Chem Power presents a novel method for real-time battery monitoring using embedded fiber-optic sensors. This approach enhances state-of-charge (SOC) and state-of-health (SOH) estimations, potentially improving the efficiency and lifespan of lithium-ion batteries in electric vehicles (xEVs).