Infrared Spectroscopy of Polymers XIII: Polyurethanes
We continue our survey of the spectra of nitrogen containing polymers with a look at polyurethanes. Polyurethanes are widely made into foam rubber, elastic, and wood coatings, amongst other things. The spectra of polyurethanes are similar to polyamides since both polymer types contain C=O and N-H bonds. Therefore, we will begin with a review of the spectra of polyamides.
The structure and infrared spectra of polyurethanes and polymeric amides or polyamides are similar, hence a review of polyamides is in order. We studied polyamides in a couple of previous columns (1,2). We saw that most polyamides have a secondary amide group in their backbone. The molecular structure of a secondary amide is seen in Figure 1.
Figure 1: The molecular structure of a secondary amide.
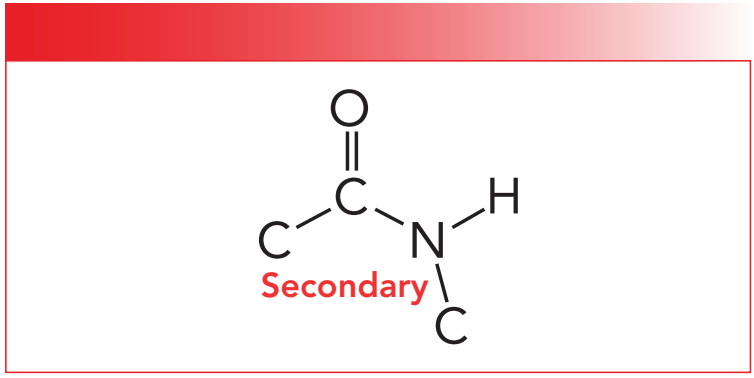
Recall that the primary, secondary, and tertiary nomenclature for amides counts the number of C-N bonds in the functional group. Also, as the number of C-N bonds goes up the number N-H bonds goes down (1). As you can see in Figure 1, a secondary amide has two C-N bonds and one N-H bond. Table I shows the group wavenumbers for secondary amides (1).
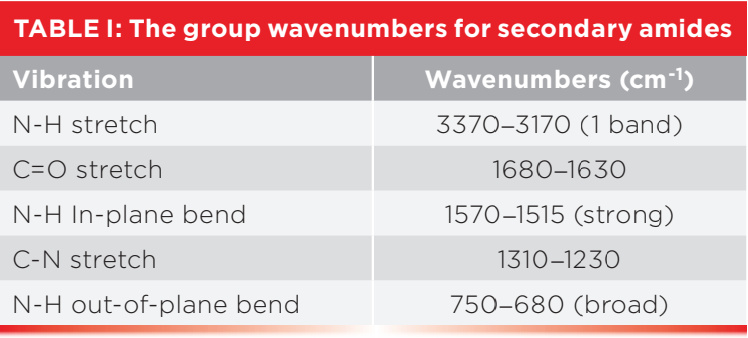
Since secondary amides have only one N-H bond they have only one N-H stretching vibration that falls from 3370 to 3170 cm-1 (going forward, assume all peak positions are in cm-1 units even if not so noted). The N-H in-plane bend for secondary amides is found from 1570 to 1515 and is unusually strong for an in-plane bending vibration peak (1). The N-H out-of-plane bend (wag) for secondary amides falls in the range 750 to 680. Recall that N-H stretching and bending peaks are broadened by hydrogen bonding, but are medium in width and intensity compared to O-H stretching and bending peaks because hydrogen bonds formed by N-H groups are weaker than hydrogen bonds formed by O-H groups (1). The C=O bond in all amides conjugates with the lone pair of electrons on the amide nitrogen, so all amides have their C=O stretching peak in the same region from 1680 to 1630 (1).
What are Polyurethanes?
The structural framework of the secondary urethane functional group is seen in Figure 2.
Figure 2: The molecular structure of the secondary urethane group. The red circle denotes an ester linkage, while the blue circle denotes an amide linkage.
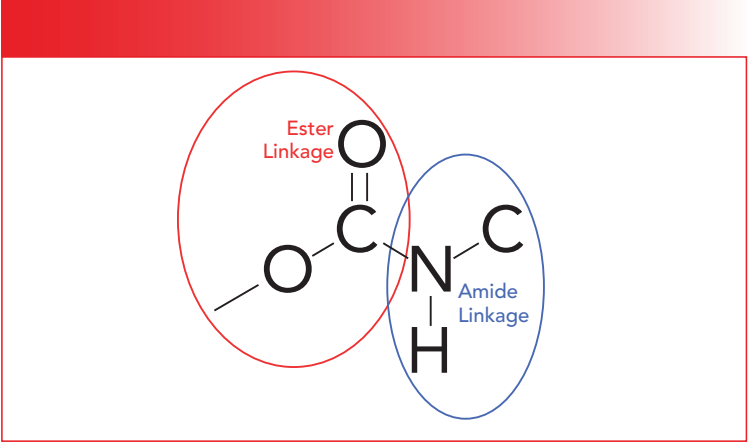
Like amides, urethanes are characterized as primary, secondary, and tertiary, depending upon whether there are one, two, or three C-N bonds. Additionally, the number of N-H bonds in urethanes decrease from two, to one, to none as we go from primary to tertiary structures, which is, again, similar to amides.
Like polyamides, most polyurethanes contain secondary urethane groups in their backbones. Note in Figure 2 that the left hand side of the secondary urethane functional group contains an ester linkage circled in red. As we have seen, ester groups have C=O and C-O stretching vibrations. The right hand side of the secondary urethane functional group, denoted by the blue circle in Figure 2, contains an amide linkage (3). Note however that both the ester and amide linkages share the same carbonyl group. Thus, we might expect the spectrum of urethanes to be a combination of the spectra of an ester and an amide. This turns out to be the case for the most part, as seen in the spectrum of a polyurethane-polyether foam presented in Figure 3.
Figure 3: The infrared spectrum of a polyurethane-polyether foam.
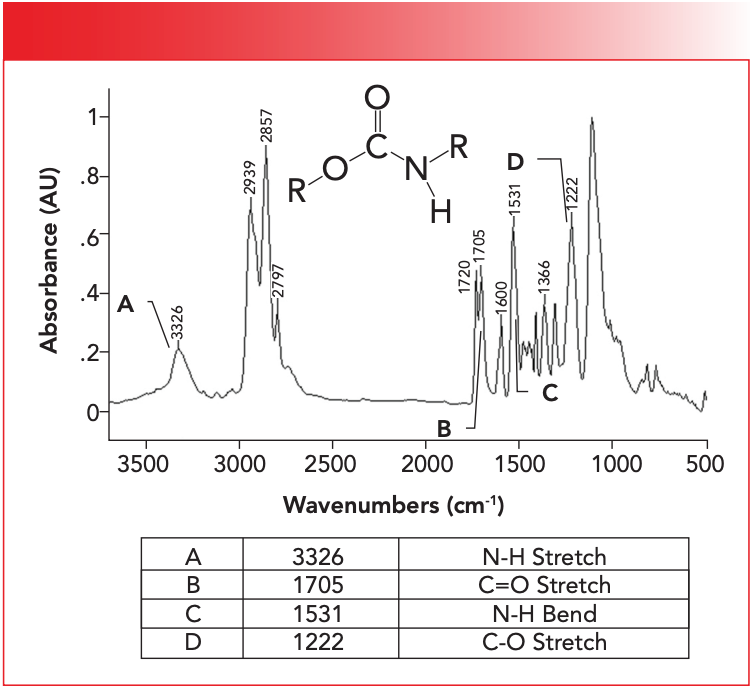
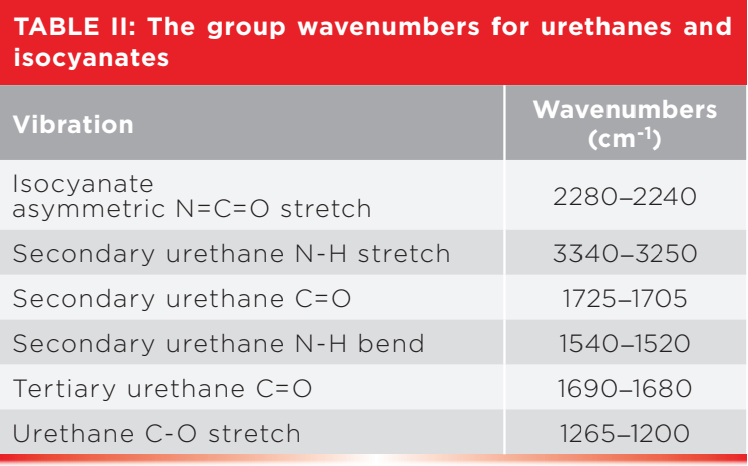
The single N-H stretch in Figure 3 is found at 3326 and is labeled A. For secondary urethanes, this peak generally falls from 3340 to 3250. Note the medium peak width typical of other N-H stretches we have studied (1,2). Both esters and amides have C=O stretching peaks, so where will the C=O stretch of a urethane fall? In Figure 3 it is at 1705 and is labeled B. The carbonyl stretch in Figure 3 labeled B is split, with peaks at 1720 and 1705. The cause of this split carbonyl peak is that some urethane C=O groups engage in hydrogen bonding, whereas others don’t. The 1720 peak is from non-hydrogen bonded or “unassociated” carbonyls, whereas the 1705 peak is from the hydrogen bonded or “associated” carbonyl groups (4). This pair of secondary urethane C=O stretching peaks is usually found from 1725 to 1705. Note from Table I that amide C=O stretches fall from 1680 to 1630. Amides and urethanes do have similar spectra, but for amides the C=O stretch is 1680 or lower, whereas for urethanes it is 1705 or higher. Thus, the position of the C=O stretching peak can be used to distinguish a polyamide from a polyurethane.
Recall that, for polyamides, there is an unusually intense N-H in-plane bending vibration (1,2). Urethanes also exhibit this peak. In Figure 2, it is found at 1531 and is labeled C. This peak is usually found from 1540–1520, overlapping the range for secondary amides. The main structural difference between amides and urethanes is that urethanes contain a C-O bond, whereas amides do not. We have studied the spectroscopy of functional groups containing C-O bonds extensively, and found that the spectral signature of a C-O bond is a big peak between 1300 and 1000 (3,5). Urethanes do not disappoint here, as the C-O stretch of the polyurethane in Figure 3 is labeled D, and falls at 1222. This peak is normally seen in urethanes from 1265 to 1200 (4). The big peak near 1000 in Figure 3 is from the ether linkages in this polyurethane/polyether foam rubber material. Table II summarizes the group wavenumbers for urethanes.
The Synthesis of Urethanes
Polyurethanes are made by reacting a diol and a diisocyanate, as seen in Figure 4 (6).
Figure 4: The synthesis of a polyurethane from a diisocyanate and a diol.
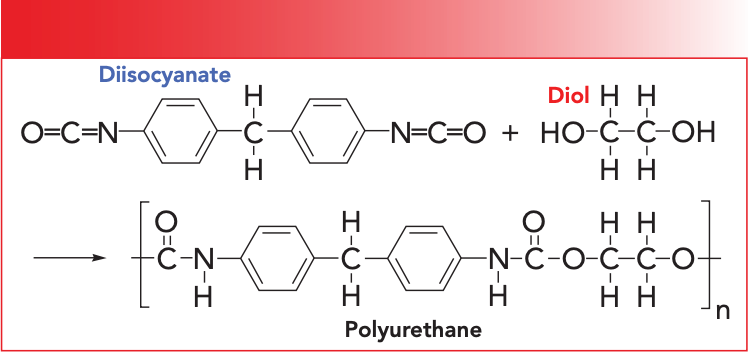
A diol is simply a molecule with two alcohol groups in it. Their infrared spectra are similar to those of mono-alcohols that we have studied previously (5).
An isocyanate is a molecule with one -N=C=O linkage in it, while a diisocyanate contains two of these groups. The synthesis seen in Figure 4 is called a condensation reaction, because the driving force is the splitting off of a water molecule. Polyurethane foam, also known as foam rubber, is made by copolymerizing urethanes with other functional groups such as ethers. The infrared spectrum of such a material is seen in Figure 3.
The Infrared Spectra of Diisocyanates
As mentioned above, diisocyanates contain two -N=C=O functional groups. This linkage is reminiscent of CO2 in that is mostly planar and linear (7). The infrared spectrum of a diisocyanate is shown in Figure 5.
Figure 5: The infrared spectrum of a diisocyanate.
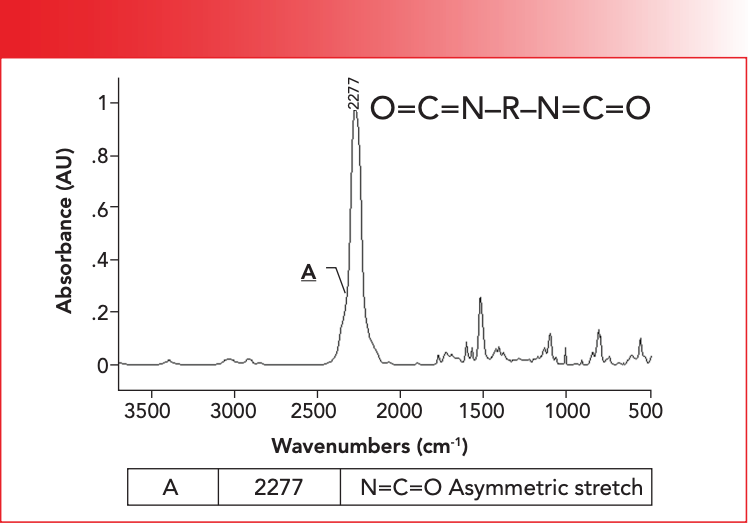
Note that the spectrum is dominated by the peak labeled A at 2277 cm-1. This peak is due to the asymmetric stretch of the -N=C=O group, which normally falls from 2280 to 2240, as noted in Table II. This peak is unusually intense and broad because of the large dipole moment of the -N=C=O group. The -N=C=O asymmetric stretching peak is the perfect example of a group wavenumber, because it is intense and shows up in a region where very few other functional groups absorb. Throughout the many installments of this column, you may have noticed that much of our attention is focused on the 3500 to 2800 and 2000 to 400 regions. This is because there are very few useful group wavenumbers between 2800 and 2000 (8).
The only other infrared peak we have seen that absorbs near diisocyanates is the C≡C stretch of disubstituted alkynes, which fall from 2260 to 2190 (9). These two functional groups are easily distinguished, because the diisocyanate -N=C=O asymmetric stretching peak is broader and stronger than a typical C≡C stretch. This is because the dipole moment for the isocyanate group is much larger than for the C≡C bond of alkynes.
There are two reasons why have included a discussion of the spectroscopy of isocyanates here. First, most of the other polymers we have studied were made from starting materials we have studied before, so I felt the need to discuss isocyanates here because there would be no other appropriate place to do so. Second, isocyanate end groups are present in polyurethanes. In polymer chemistry, end groups are unreacted functional groups found at the end of polymer chains (10). Because of the unique position and intense absorbance of the -N=C=O linkage, isocyanate end group peaks show up more commonly than the end groups of other polymers.
Conclusions
Polyurethanes are important polymers that contain C=O, C-O, and C-N linkages, and most polyurethanes contain the secondary urethane linkage. The spectra of secondary urethanes are reminiscent of the spectra of secondary amides, so the spectroscopy of secondary amides was reviewed. We then studied the spectrum of a polyurethane foam and found that they have four useful groups wavenumbers; the N-H stretch, C=O stretch, N-H in-plane bend, and C-O stretch. The spectra of secondary amides and urethanes can be distinguished from each other because urethanes have a higher wavenumber C=O stretch than urethanes, and the spectra of urethanes contain a C-O stretching peak whereas the spectra of amides do not. We wrapped up with a discussion of the spectra of isocyanates, a functional group used to make urethanes. Isocyanates contain a unique -N=C=O linkage and exhibit a strong and uniquely located asymmetric stretching vibration. Isocyanate end groups are sometimes seen in the infrared spectra of polyurethanes.
References
(1) Smith, B. C. Infrared Spectroscopy of Polymers, XI: Introduction to Organic Nitrogen Polymers. Spectroscopy 2023, 38 (3), 14–18. DOI: 10.56530/spectroscopy.vd3180b5
(2) Smith, B. C. Infrared Spectroscopy of Polymers XII: Polyaramids and Slip Agents. Spectroscopy 2023, 38 (5), 16–18. DOI: 10.56530/spectroscopy.np7466n5
(3) Smith, B. C. Infrared Spectroscopy of Polymers, VIII: Polyesters and the Rule of Three. Spectroscopy 2022, 37 (10), 25–28. DOI: 10.56530/spectroscopy.ta9383e3
(4) Socrates, G. Infrared and Raman Characteristic Group Frequencies; Wiley, 2001.
(5) Smith, B. C. Alcohols—The Rest of the Story. Spectroscopy 2017, 32 (4), 19-23.
(6) Polyurethane - Wikipedia, en.wikipedia.org/wiki/Polyurethane
(7) Isocyanate - Wikipedia, en.wikipedia.org/wiki/Isocyanate
(8) Smith, B. C. Infrared Spectral Interpretation: A Systematic Approach; CRC Press, 1999.
(9) Smith, B. C. An IR Spectral Interpretation Potpourri: Carbohydrates and Alkynes. Spectroscopy 2017, 32 (7), 18-24.
(10) Endgroup - Wikipedia, en.wikipedia.org/wiki/End_group
About the Author
Brian C. Smith, PhD, is the founder and CEO of Big Sur Scientific, a maker of portable mid-infrared cannabis analyzers. He has over 30 years experience as an industrial infrared spectroscopist, has published numerous peer-reviewed papers, and has written three books on spectroscopy. As a trainer, he has helped thousands of people around the world improve their infrared analyses. In addition to writing for Spectroscopy, Dr. Smith writes a regular column for its sister publication Cannabis Science and Technology and sits on its editorial board. He earned his PhD in physical chemistry from Dartmouth College. He can be reached at: SpectroscopyEdit@MMHGroup.com


AI Shakes Up Spectroscopy as New Tools Reveal the Secret Life of Molecules
April 14th 2025A leading-edge review led by researchers at Oak Ridge National Laboratory and MIT explores how artificial intelligence is revolutionizing the study of molecular vibrations and phonon dynamics. From infrared and Raman spectroscopy to neutron and X-ray scattering, AI is transforming how scientists interpret vibrational spectra and predict material behaviors.
Real-Time Battery Health Tracking Using Fiber-Optic Sensors
April 9th 2025A new study by researchers from Palo Alto Research Center (PARC, a Xerox Company) and LG Chem Power presents a novel method for real-time battery monitoring using embedded fiber-optic sensors. This approach enhances state-of-charge (SOC) and state-of-health (SOH) estimations, potentially improving the efficiency and lifespan of lithium-ion batteries in electric vehicles (xEVs).
New Study Provides Insights into Chiral Smectic Phases
March 31st 2025Researchers from the Institute of Nuclear Physics Polish Academy of Sciences have unveiled new insights into the molecular arrangement of the 7HH6 compound’s smectic phases using X-ray diffraction (XRD) and infrared (IR) spectroscopy.