Ingredient-Specific Particle Sizing of Aerosolized Nasal Spray* Using Wide-Field Raman Chemical Imaging
Application Notebook
Raman Chemical Imaging technology is able to identify and differentiate multiple components in complex formulated nasal spray suspensions based on chemical makeup. Particle size distribution statistics for the ingredient of interest are produced in a rapid, objective and semi-automated manner. Both solitary and aggregated drug particle sizing information may be obtained.
ChemImage Corp.
Raman Chemical Imaging technology is able to identify and differentiate multiple components in complex formulated nasal spray suspensions based on chemical makeup. Particle size distribution statistics for the ingredient of interest are produced in a rapid, objective and semi-automated manner. Both solitary and aggregated drug particle sizing information may be obtained.
Intranasal drug delivery is an attractive and beneficial delivery method for a broad range of pharmaceuticals. Drug particle size distribution (PSD) in aqueous nasal spray formulations directly correlates to bioavailability and effectiveness of final product. It is critical but challenging to correctly determine drug-specific PSD in the aqueous suspensions due to the presence of multiple insoluble excipients. Commonly used particle sizing techniques cannot objectively discriminate drug particles; thus, in vitro methods are preferred over in vivo methods.
ChemImage conducts on-going studies using the FALCON II™ Wide-Field Raman Chemical Imaging System to develop efficient methods for determination of PSD of micronized drug substances in aqueous suspension nasal spray formulations. These studies are performed in collaboration with the FDA with the long-term goal of establishing a fully validated in vitro particle sizing method for measuring bioequivalence of nasal drug delivery products or batch release testing.
Experimental Conditions
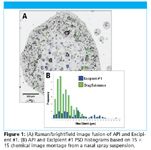
Spectroscopy, optical microscopy, and Raman chemical imaging of a formulated nasal spray sample was performed on FALCON II™ System equipped with 532 nm laser excitation. Raman chemical images were collected over 15 X 15 fields of view yielding a sampling area of 565 X 565 µm2 in size. Images were analyzed using ChemImage Xpert™ software.

Figure 1
Results
The Raman/brightfield image fusion in Figure 1A is comprised of approximately 3,686,400 individual spectra collected at a rate of >220 spectra/second providing very specific chemical identification in a fast, automated manner. It illustrates the ability to identify ingredient-specific particles based on unique Raman spectra. The histograms in Figure 1B show the distribution of 313 API (green) and 96 Excipient #1 (blue) particles in 225 fields of view. The median maximum chord is 3.5 ± 3.1 µm for the API particles and 6.1 ± 5.8 µm for the Excipient #1 particles.
Conclusions
The FALCON II™ System efficiently collects millions of spectrally unique data points at sub-micron spatial resolution. Acquisition rates surpass the speed of competing point and line mapping systems and provide more accurate, objective information than optical microscopy. The substantial time and labor savings are ultimately transformed into cost savings and a reduced product time to market.
* Work performed in collaboration with the US Food and Drug Administration. This application note represents the personal opinions of ChemImage Corp. and does not necessarily represent the views or policies of the US Food and Drug Administration.
References
(1) Doub, W.H. et al., "Raman Chemical Imaging for Ingredient-Specific Particle Size Characterization of Aqueous Suspension Nasal Spray Formulations," Pharm. Res.24(5), 934–945 (2007).

ChemImage Corp.
7301 Penn Avenue, Pittsburgh, PA 15208
Tel. (877) 241-3550, Fax (412) 241-7311
Website: www.chemimage.com

Thermo Fisher Scientists Highlight the Latest Advances in Process Monitoring with Raman Spectroscopy
April 1st 2025In this exclusive Spectroscopy interview, John Richmond and Tom Dearing of Thermo Fisher Scientific discuss the company’s Raman technology and the latest trends for process monitoring across various applications.
A Seamless Trace Elemental Analysis Prescription for Quality Pharmaceuticals
March 31st 2025Quality assurance and quality control (QA/QC) are essential in pharmaceutical manufacturing to ensure compliance with standards like United States Pharmacopoeia <232> and ICH Q3D, as well as FDA regulations. Reliable and user-friendly testing solutions help QA/QC labs deliver precise trace elemental analyses while meeting throughput demands and data security requirements.