Rapid Micro-Sampling by ATR/FT-IR
Application Notebook
In ATR/FT-IR, magnified visual monitoring of a sample benefits many applications. For micro-sampling and defect analysis, viewing capabilities decrease overall measurement time by allowing the user to locate the desired sampling area quickly and enhance confidence in the collected data by assuring the sampling point. Visual changes in the sample also may be easily monitored during testing. As an example application, the ease of micro-sampling is shown through fiber analysis and the results are discussed.
Jenni L. Briggs, Ph.D. and Kenneth D. Kempfert, PIKE Technologies
In ATR/FT-IR, magnified visual monitoring of a sample benefits many applications. For micro-sampling and defect analysis, viewing capabilities decrease overall measurement time by allowing the user to locate the desired sampling area quickly and enhance confidence in the collected data by assuring the sampling point. Visual changes in the sample also may be easily monitored during testing. As an example application, the ease of micro-sampling is shown through fiber analysis and the results are discussed.
Fiber analysis via FTIR can be challenging. In transmission sampling, fiber flattening often is required to achieve a quality spectrum. One method of accomplishing this is to use a compression cell. However, aperturing the sampling area is usually necessary, which reduces the IR throughput significantly impacting spectral quality. ATR, on the other hand, requires no sample preparation or special sample holders. Instead, applying pressure from the accessory's clamp creates intimate contact between the ATR crystal and the fiber. Due to the focused pressure on the ATR crystal by a fiber after it has been secured, especially when testing a rigid fiber, a hard ATR crystal such as diamond is recommended.
Whichever sampling technique employed, proper sample placement across the ATR crystal or in the beam path in the case of transmission is critical. The PIKE GladiATR Vision (Figure 1) offers an easy sampling solution for fiber analysis by combining microscopic capabilities with ATR.
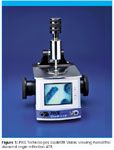
Figure 1
Instrumentation
The GladiATR Vision provides an image of the sample at 110X magnification, which may be monitored with the integrated 4" LCD screen. A camera, incorporated within the accessory's body, is focused through the diamond ATR crystal. Images remain true to color due to the all reflective optical design, and are easily saved through an optional USB image capture interface. In some applications, electronic documentation of the sample image is desirable. Other attributes of the GladiATR Vision include full spectral range from the mid-IR to the far-IR, and a monolithic diamond capable of withstanding extreme applied pressure for enhanced sample-crystal contact. Moreover, the PIKE GladiATR platform offers the highest throughput for a monolithic diamond ATR accessory, which reduces sampling time and results in superior spectral quality.
Measurement Parameters
Natural fibrous materials, cotton and wool, were analyzed. A few fiber strands were quickly positioned across the diamond ATR crystal by monitoring sample positioning on the LCD image screen. Using the GladiATR high pressure clamp, delivering a pressure of 30,000 psi, the fiber was pressed flush to the crystal surface. All spectra were collected at 4 cm–1 spectral resolution over the range of 4000–400 cm–1 . 64 scans were co-added. A DTGS detector was used.
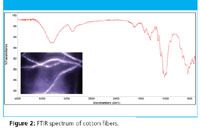
Figure 2
Application Results
The GladiATR Vision viewing area is 770 X 590 micron. Sample images of cotton and wool fiber are shown as an inset in Figures 2 and 3, respectively. The fiber diameters were approximately 30 microns. The quality of the spectra were excellent when testing only a couple of fiber strands. The spectrum of cotton clearly shows the cellulose band at 1100 cm–1 and additional absorbance bands in the fingerprint region. The amide I and II bands and several other bands including the C-H stretch and bending regions of the wool fiber spectrum are strong.
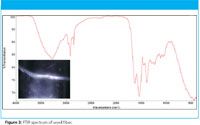
Figure 3
The methods presented show the convenience and ease of determining the spectral signature of natural fibers. Such data may be used in determining maturity of the fiber; eluding value added possibilities for specific end uses; investigating the impact of dyes and coatings on the final product; and selecting genetic lines. The FTIR sampling technique described here may also be applied to synthetic fibers to optimize processes and product quality. Furthermore, spectral analysis on a single or few fibers is valuable for applications such as forensic studies and contamination evaluation.
Summary
The high throughput of the GladiATR Vision results in exceptional spectral quality even with a single fiber in contact with the crystal surface. Moreover, the GladiATR platform increases efficiency and offers versatility for the dynamic laboratory handling a wide range of material types such as liquids, pastes, gels, and solids.
PIKE Technologies
6125 Cottonwood Drive, Madison, WI 53719
Tel. (608) 274-2721, Fax (608) 274-0103

Thermo Fisher Scientists Highlight the Latest Advances in Process Monitoring with Raman Spectroscopy
April 1st 2025In this exclusive Spectroscopy interview, John Richmond and Tom Dearing of Thermo Fisher Scientific discuss the company’s Raman technology and the latest trends for process monitoring across various applications.
A Seamless Trace Elemental Analysis Prescription for Quality Pharmaceuticals
March 31st 2025Quality assurance and quality control (QA/QC) are essential in pharmaceutical manufacturing to ensure compliance with standards like United States Pharmacopoeia <232> and ICH Q3D, as well as FDA regulations. Reliable and user-friendly testing solutions help QA/QC labs deliver precise trace elemental analyses while meeting throughput demands and data security requirements.