Integrated FT-IR and Raman Imaging on the Same Microscope
The authors discuss the use of instruments that combine FT-IR and Raman microscopy on a single platform, enabling synergistic studies of many materials.
Vibrational spectroscopy provides abundant analytical information on materials, which can be utilized in product development, material evaluation, and failure analysis. For technical reasons, measurements of direct vibrational absorption (FT-IR) developed more rapidly as a reliable tool in this area. Again for technical reasons, Raman scattering measurements have now achieved analytical quality and convenience. However, while the two techniques both measure vibrational spectra of materials, the spectra are quite different — different functional groups tend to be stronger in one measurement rather than the other; the two techniques provide different information. Polar functional groups provide strong IR absorptions, whereas aromatics and double bonds provide strong Raman signals. Consequently, the ability to acquire Raman and IR signals on the same sample provides a synergism over the sum of the individual measurements.
All that is said in the above paragraph can be repeated for spectroscopic microscopy (or microscopic spectroscopy, depending on your preference). But here the interest is in the microscopic heterogeneity and distribution of the various components in a sample. The ability to record Fourier transform (FT)-IR and Raman spectra sequentially on the same sample, using the same nosepiece so that the sample does not have to be disturbed, means that the synergism of the two spectroscopies can be used to characterize the nature of the samples. The Raman and the FT-IR spectra can be measured on exactly the same spot; well, not exactly because the limiting spot size depends on the wavelength of the probe (about 10–30 μm for FT-IR and 0.5 μm for Raman, depending on the optics).
Then, after anyone starts to use a microscope for spectroscopic measurements, the immediate interest is in measuring the components' distribution — that is, collect a map. Because FT-IR and dispersive Raman instruments normally are manufactured by different companies, the software interface for the two systems does not work together. However, the results that will be shown here were acquired on a LabRAM HR high-resolution Raman microscope equipped with a Smith's Detection interferometer mounted on top of the microscope, all controlled by LabSpec software (Horiba Jobin Yvon, Edison, New Jersey) (1).
There are different methods of implementing vibrational mapping. They essentially fall into two categories, with hybrid variations in between: illuminate a point on the sample, collect a spectrum, then move to the next point; and illuminate the entire region of interest, take a snapshot at one wavelength, and then move to the next wavelength. In both cases, a hyperspectral cube is created: for each X,Y point on the sample, there is a spectrum with intensity as a function of wavelength. The chemical map is then constructed using features of the spectra. Plotting intensities of selected bands is the simplest method, but others are also available. The modeling function is useful in cases where the spectra are complicated and unique bands are difficult to identify. In this case, each data point in the map is decomposed into a linear combination of "pure" spectra that are selected from the data set, acquired from pure samples, or calculated by the software algorithm. It is also possible to "bandfit" the spectra to Gaussian–Lorentzian functions and then plot characteristics reported by this program, which include peak position, peak width, peak amplitude, and integrated area.
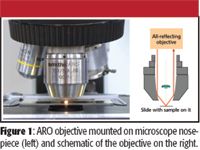
Figure 1
FT-IR Map of a Bone Specimen
The following example was taken from a brief study that was done on bone tissue. While the FT-IR microscope can accommodate both an attenuated total reflectance (ATR) accessory and an all-reflecting objective (ARO), it is the ARO that is used for mapping studies. Figure 1 shows the microscope nosepiece with ARO objective mounted, and a schematic of the second generation of the objective. Figure 2 shows the spectra of the bone and the polymer matrix.
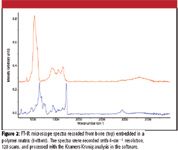
Figure 2
A captured image of the mapped region is shown in Figure 3. The sample is unstained so the contrast is entirely determined by the materials themselves. Major features are discernable, but detailed information on the molecular content in the image field can only be inferred. On the other hand, Figure 3 shows the FT-IR image using the intensity of the phosphate band of the bone just above 1000 cm–1, and the polymer's carbonyl band near 1735 cm–1, to provide contrast.
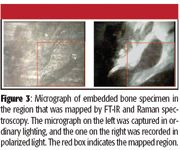
Figure 3
In reality there is more information in these measurements than what is shown in Figure 5. The spectrum of the bone is composed essentially of the phosphate mineral (major band at 1036 cm–1) and protein (amide I and II bands near 1650 and 1550 cm–1), and the phosphate is carbonated (indicator band at 888 cm–1). Images of each of these species can also be constructed, as shown in Figure 4. Not surprisingly, all three chemical components in the bone overlap, but careful inspection of the images indicates that the relative contributions of mineral to protein vary over the image.
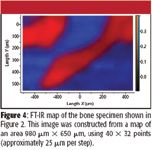
Figure 4

Figure 5
Raman Microscopy of the Same Bone Specimen
As in the FT-IR mode, it is simple to distinguish the bone from the matrix by Raman spectroscopy. Figure 6 shows the spectra of these two components and Figure 7 shows the positive–negative images of the two species constructed by using the intensity of the bone phosphate stretch at 960 cm–1 and the polymer band at 812 cm–1 .
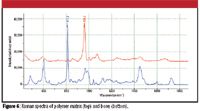
Figure 6
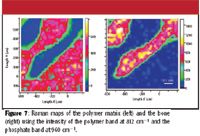
Figure 7
As with the FT-IR, there are spectral characteristics of the bone that show the carbonate (approximately 1080 cm–1), collagen amide I (1660 cm–1), and phenylalanine in the protein (approximately 1000 cm–1). Figure 8 shows the ratio of the phosphate (960 cm–1) to phenylalanine ring mode (1000 cm–1) intensities. In this image, the mineral content of the bone is highest in the center, suggesting that as the bone grows out from the center, first protein is deposited and then the mineral.
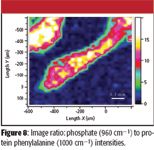
Figure 8
Note that the two sets of results (FT-IR and Raman microscopes) shown here yield similar information — distribution of bone and polymer embedding medium. The question is why would one bother with the two techniques? It is actually possible to extract more information from both spectroscopies. The group of Rick Mendelsohn at Rutgers University in Newark, New Jersey, has been doing FT-IR profiles of bone for years (2). By applying sophisticated analytical methods, they have been able to extract chemical and structural information from spectral variations.
What the maps shown above do not show is the trade-offs between the two techniques. In general, FT-IR results are acquired much more rapidly than Raman, as was the case here. But a Raman microscope provides higher spatial resolution and spectra with sharper bands. At least two groups are active in utilizing Raman microscopy to characterize bone (3,4), also extracting information such as mineral to matrix ratio, degree of carbonation, and protein structure, which can be related to disease states and to aging.
Summary
With the maturation of FT-IR and Raman microscopies, there are now several instruments on the market that integrate the two measurements on a single platform, enabling synergistic studies of many materials. As an example, some simple maps of bone have been shown.
Fran Adar, Andrew Whitley, Eunah Lee, and Gwen LeBourdon are with Horiba Jobin Yvon, Edison, New Jersey.
References
(1) F. Adar, A. Whitley, and J. Reffner, LabRAM IR with Same Spot Technology, Pittcon 2002.
(2) E.P. Paschalis, E. DiCarlo, F. Betts, P. Sherman, R. Mendelsohn, and A.L. Boskey, Calcif. Tissue Int. 59, 480–487 (1996).
(3) C.T. Tarnowski, M.A. Ignelzi, W. Want, J.M. Taboas, S.A. Goldstein, and M. Morris, J. Bone Miner. Res. 17, 1118–1126 (2002).
(4) O. Akkus, A. Polyakova-Akkus, F. Adar, and M.B. Schaffler, J. Bone Miner. Res. 18, 1112–1119 (2003).
AI-Powered SERS Spectroscopy Breakthrough Boosts Safety of Medicinal Food Products
April 16th 2025A new deep learning-enhanced spectroscopic platform—SERSome—developed by researchers in China and Finland, identifies medicinal and edible homologs (MEHs) with 98% accuracy. This innovation could revolutionize safety and quality control in the growing MEH market.
New Raman Spectroscopy Method Enhances Real-Time Monitoring Across Fermentation Processes
April 15th 2025Researchers at Delft University of Technology have developed a novel method using single compound spectra to enhance the transferability and accuracy of Raman spectroscopy models for real-time fermentation monitoring.