IR Spectral Interpretation Workshop
There is a continuing need for Fourier transform infrared (FT-IR) users to receive training in how to interpret the infrared spectra they measure. This new column will provide practical advice about how to do this. This first installment will present why this type of column is important, discuss some basic IR theory, and lay out a blueprint for future installments.
There is a continuing need for Fourier transform infrared (FT-IR) users to receive training in how to interpret the infrared spectra they measure. This new column will provide practical advice about how to do this. This first installment will present why this type of column is important, discuss some basic IR theory, and lay out a blueprint for future installments.
Infrared (IR) spectroscopy is widely used to determine the structures of unknown molecules, give a fingerprint of a sample, and measure the concentrations of molecules in samples (1–4). When a molecule absorbs infrared light, it undergoes a spectroscopic transition from a lower to an upper vibrational energy level, as seen in Figure 1.
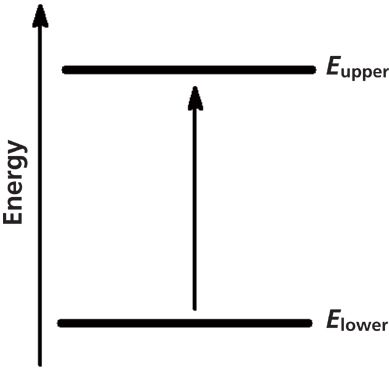
Figure 1: A spectroscopic transition occurs when infrared light is absorbed by a molecule and it is excited from a lower to an upper vibrational energy level.
The absorbed infrared energy causes the molecule's bonds to stretch and bend. In most cases, these vibrations are localized to specific portions of a molecule called functional groups. Examples of functional groups include the methyl group (CH3–), the carbonyl group (C=O), and benzene rings (C6H6).
The x-axes of most infrared spectra are plotted in wavenumber (cm-1) units. The wavenumber of electromagnetic radiation is proportional to energy (1). When infrared light of the same energy as a vibrational transition impinges upon a molecule, the energy may be absorbed. The corresponding decrease in light energy at the absorption wavenumber gives rise to a peak in the measured infrared spectrum of the molecule. The peak positions in an infrared spectrum thus disclose the vibrational energy levels of the functional groups in a molecule, and when infrared spectra are analyzed, the peaks are assigned to specific vibrations of specific functional groups. Thus, infrared spectroscopy is a type of functional group spectroscopy, and infrared spectrometers are used to detect functional groups. The peak positions in an infrared spectrum are used to distinguish different functional groups from each other.
Different functional groups can have peaks at about the same position. For example, both O–H and N–H stretches have peaks around 3350 cm-1 (4). In these cases, how can one distinguish the peaks of different functional groups from each other? The answer is that in addition to peak position information, infrared spectra contain peak heights and peak widths. Different functional groups have different peak intensities and peak widths. For example, one can distinguish O–H and N–H stretches from each other because normally O–H stretching peaks are more intense and broader than N–H stretching peaks. By integrating the peak position, height, and width information in a spectrum you will be more successful at interpreting spectra than just using the peak positions by themselves. The purpose of this installment is to teach why different functional groups have different peak positions, heights, and widths so that infrared interpreters can integrate this information to more readily distinguish different functional groups from each other.
Peak Positions
Given that the absorption of infrared light excites molecular vibrations, we need to understand these vibrations to make sense of infrared spectra. The constituent vibrations of a molecule (or any physical object for that matter) are referred to as its normal modes (4–7). An illustration of the symmetric and asymmetric stretching normal modes of carbon dioxide is seen in Figure 2.

Figure 2: Left: the symmetric stretch normal mode of the carbon dioxide molecule. Right: the asymmetric stretch normal mode of the same molecule. The arrows note the displacement of the oxygen atoms during the vibrations.
At equilibrium CO2 is symmetrical and both C=O bonds are the same length. During the symmetric stretch vibration the two oxygen atoms move in opposite directions, and at all points during the vibration the two C=O bonds have the same length, thus preserving the symmetry of the molecule. On the other hand, during the asymmetric stretch vibration the two oxygen atoms move in different directions, the bond lengths differ from each other, and the symmetry of the molecule is broken. To understand the relationship between molecular vibrations and peak positions it is easiest to begin by considering the generic diatomic molecule seen in Figure 3.
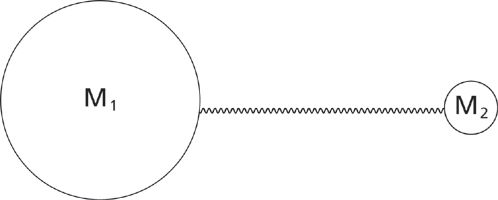
Figure 3: The ball-and-spring model for a generic diatomic molecule containing atoms of masses M1 and M2.
Shown is a ball-and-spring model where individual atoms are represented by balls and chemicals bonds by springs. The atoms in Figure 3 have masses M1 and M2, respectively. A real world example of such a molecule would be hydrogen chloride, H–Cl, where atom 1 would correspond to chlorine and atom 2 to hydrogen.
Diatomic molecules have only one vibration (4), the stretching of the single chemical bond, and hence have only one vibrational peak. Our goal is to derive an equation that will tell us the wavenumber of the vibrational peak in the spectrum of a diatomic molecule. To solve this problem we have to apply some physics to the matter. We define the reduced mass of our diatomic molecule as such:

where MR is the reduced mass, M1 is the mass of atom 1, and M2 is the mass of atom 2.
By using a single quantity to represent the mass of this two-mass system, the mathematics of the derivation is made easier. The second piece of physics we have to consider is Hooke's law (4), which describes the behavior of springs (and chemical bonds) as such:

where F is the restoring force of the spring, k is the force constant of the spring, and x is the distance the spring is stretched.
Anyone who has ever stretched a rubber band has an intuitive grasp of Hooke's law. F is the amount of force needed to stretch and maintain the rubber band at a given length and is equal to the amount of force the rubber band is putting on the person trying to stretch it (the restoring force). Experience shows that it takes more force to stretch a rubber band a long distance than a short distance, which is why the variable x appears in Hooke's law. Experience also shows that it takes more force to stretch a stiff rubber band than a weak one, which is why the force constant appears in Hooke's law.
If one takes the reduced mass, Hooke's law, applies one of Newton's laws, and solves the resulting differential equation, this result is obtained (4):

where W is the peak wavenumber position in cm-1, c is the speed of light, k is the force constant, and MR is the reduced mass.
Equation 3 predicts the position in wavenumbers of the single vibrational peak for the generic diatomic molecule seen in Figure 3. This peak position is determined by the force constant, hence the strength of the molecule's chemical bond, and the mass of the two atoms composing the bond. Since k is in the numerator, as the force constant goes up the peak position increases. This means strong chemical bonds have higher peak positions than weak chemical bonds. The denominator in equation 3 contains the reduced mass, thus molecules with heavy atoms in them have lower wavenumber peaks than molecules with light atoms in them.
If two molecules have different chemical structures, they will have different force constants, reduced masses, and hence different infrared spectra. Put another way, a molecule's infrared spectrum truly is its chemical fingerprint, and it is as unique to it as your DNA is to you. Of course, not all molecules are diatomic, and not all functional groups contain just two atoms. However, the ideas summarized in equation 3 are generally applicable to the functional groups in any molecule.
Infrared spectra have been measured for over a century (8). In this time, perhaps millions of samples have been analyzed, giving us a vast database of peak positions for known functional groups. This database has allowed the development of tables and charts noting the peak positions corresponding to specific functional groups (4–7). These tables are used to interpret the spectra of unknown samples and determine the functional groups present. Equation 3 thus explains why different functional groups have different peak positions.
Peak Heights
When plotted in absorbance units, the peak heights in an infrared spectrum are proportional to concentration, allowing infrared spectra to be used to determine the concentration of chemical species in samples. The relationship between absorbance and concentration is summarized in Beer's law (consult reference 3 for the assumptions behind the derivation of this equation):

where A is the absorbance, ε is the absorptivity, l is the pathlength, and c is the concentration.
The pathlength is simply the thickness of sample seen by the infrared beam. Nominally, the absorptivity is the proportionality constant between absorbance and concentration. The absorptivity is also a physical constant for a given pure molecule at a given wavenumber, which means absorptivity must be related to a molecule's chemical structure. To understand this connection we must first understand the concept of dipole moments, which is illustrated in Figure 4.
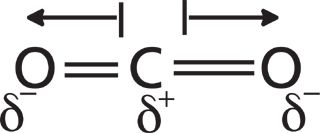
Figure 4: The dipole moments of the CO2 molecule. Partial positive and negative charges are represented by lower case deltas. Dipole moment vectors are represented by arrows.
In CO2 the electronegativity difference between the carbon and the oxygen atoms causes the electrons to be shared unevenly, leading to a partial positive charge on the carbon and negative charges on the oxygens. In Figure 4 the partial charges are represented by lowercase deltas. A dipole moment is simply two charges separated by a distance, so each of the bonds in CO2 has a dipole moment called a bond dipole. The dipole moment is a vector quantity, having both a magnitude and a direction. The length of the arrows in Figure 4 denotes the magnitude of each bond dipole, and the arrows represent their direction. A bond's dipole moment is equal to the size of the charges in a bond times the distance they are held apart as such:

where μ is the dipole moment, q is the charge, and r is the distance. (Please note: In physics the Greek letter μ is used to represent both reduced mass and dipole moment. To avoid confusion in these columns μ will always represent dipole moment, and MR will represent reduced mass.)
Thus, the dipole moment is a measure of charge asymmetry. Polar bonds such as O–H and C=O have large charge asymmetry and hence large dipole moments. Covalent bonds like C–C single bonds have little charge separation and hence small dipole moments.
The net dipole moment for a molecule is the sum of the bond dipoles for that molecule. For a CO2 molecule at equilibrium the net dipole is zero because the two bond dipoles are equal in magnitude and point in opposite directions, thus canceling each other. When the CO2 molecule stretches symmetrically, as seen in Figure 2, the symmetry of the molecule is maintained and the two C=O bond dipoles are at all times still equal in magnitude and opposite in direction. As a result, the change in dipole moment, dμ, with respect to bond length, dx, for the symmetric stretch of CO2 is zero. In other words

A close examination of the infrared spectrum of carbon dioxide shows that the intensity for this peak is zero, that is, there is no peak in the spectrum of CO2 assignable to this vibration.
On the other hand, when CO2 stretches asymmetrically, as seen in Figure 2, the symmetry of the molecule is broken, the bond dipoles no longer cancel at all points during the vibration, and there is a large change in dipole moment with respect to bond length during the vibration. In other words

The corresponding peak in the molecule's infrared spectrum falls around 2350 cm-1 and is quite intense. This peak is sometimes seen in sample spectra measured with a Fourier transform infrared (FT-IR) spectrometer.
Thus, there is a connection between dμ/dx and intensity, but how does this new discovery of ours fit in with Beer's law? I will skip the derivation here, but quantum mechanics tells us that (3,9)

where ε is the absorptivity, dμ is the change in dipole moment during a vibration, and dx is the change in bond length during a vibration.
Thus, the absorptivity, which is a fundamental constant for a pure molecule at a given wavenumber of absorption under standard conditions, depends on the electronic structure of a molecule and how it changes during a vibration. Polar functional groups will have large dipole moments, will frequently have vibrations for which dμ/dx is large, and will have intense peaks. Nonpolar functional groups will have small dipole moments, will frequently have vibrations for which dμ/dx is small, and will have infrared features that are weak or even nonexistent. This means that infrared spectroscopy is better at detecting some functional groups than others, and that polar functional groups are generally the easiest to detect. Equation 6 shows why different functional groups have different peak intensities.
Peak Widths
Infrared peak widths vary greatly across the spectrum of known molecules. Figure 5 shows the infrared spectrum of liquid water. The full width half maximum (FWHM) of the O–H stretching peak at 3300 cm-1 is about 500 cm-1. This is an unusually broad peak for an infrared spectrum. Figure 6 shows the infrared spectrum of the organic molecule benzonitrile. In this spectrum the FWHMs are less than 50 cm-1. There is an order of magnitude difference in peak width between these two spectra, but why? The answer lies in the strength of the intermolecular interactions for the two compounds. Water engages in hydrogen bonding, as seen in Figure 7, which is a strong type of intermolecular interaction.
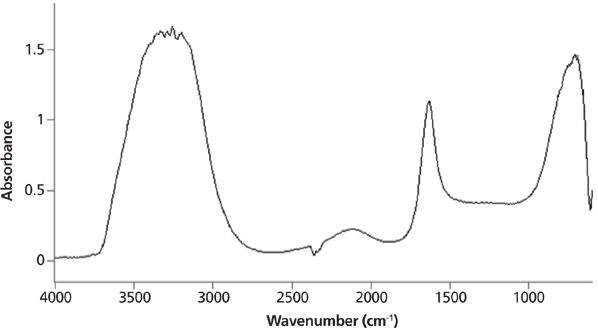
Figure 5: The infrared spectrum of liquid water. The O–H stretching peak centered near 3300 cm-1 has a full width half maximum of about 500 cm-1.
When intermolecular interactions are strong, the strength of the intermolecular bonds varies over a wide range, giving rise to a large number of energy states. Each of these states will absorb infrared light at a number of slightly different wavenumbers, giving rise to broad peaks. The intermolecular interactions in benzonitrile are weak because they are due to van der Waals forces, the corresponding number of energy states is small, infrared light is absorbed at a small number of wavenumbers, and hence the peak widths are narrow.
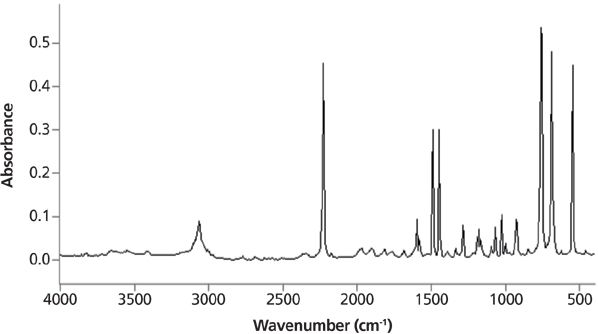
Figure 6: The infrared spectrum of benzonitrile. Note the narrowness of the peaks.
In general, functional groups that have strong intermolecular interactions will have broad peaks. For example, most molecules containing the O–H functional group engage in hydrogen bonding and have broad peaks. Functional groups that have weak intermolecular interactions such as aromatic rings will generally have narrow peaks. It is the varying strengths of intermolecular interactions that cause different functional groups to have different peak widths.
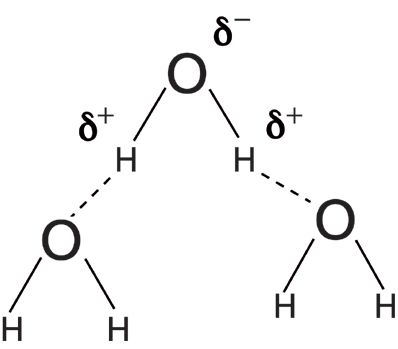
Figure 7: An illustration of the hydrogen bonding that takes place in liquid water.
Conclusion
Infrared spectroscopy is used to detect functional groups in samples. Infrared spectra contain information about peak position, height, and width. Peak positions are determined by the force constants and reduced masses of a vibrating functional group. Peak heights are determined by Beer's law, including absorptivity, pathlength, and concentration. Absorptivity depends upon (dμ/dx)2 for a given vibration of a given functional group. Peak widths are determined by the strength of intermolecular interactions in a sample. All of these pieces of information need to be understood and integrated properly to successfully distinguish the spectra of different functional groups from each other.
References
(1) B.C. Smith, Fundamentals of Fourier Transform Infrared Spectroscopy, 2nd Edition (CRC Press, Boca Raton, Florida, 2011).
(2) P. Griffiths and J. de Haseth, Fourier Transform Infrared Spectrometry, 2nd Edition (Wiley, New York, New York, 2007).
(3) B.C. Smith, Quantitative Spectroscopy: Theory and Practice (Academic Press, Boston, Massachusetts, 2002).
(4) B.C. Smith, Infrared Spectral Interpretation: A Systematic Approach (CRC Press, Boca Raton, Florida, 1999).
(5) N. Colthup, L. Daly, and S. Wiberley, Introduction to Infrared and Raman Spectroscopy (Academic Press, Boston, Massachusetts, 1990).
(6) D. Lin-Vien, N. Colthup, W. Fateley, and J. Graselli, The Handbook of Infrared and Raman Characteristic Frequencies of Organic Molecules (Academic Press, Boston, Massachusetts, 1991).
(7) G. Socrates, Infrared and Raman Characteristic Group Frequencies: Tables and Charts (Wiley, Boston, Massachusetts, 2001).
(8) W. Coblentz, Phys. Rev.16, 35 (1903).
(9) J.M. Hollas, Modern Spectroscopy 3rd Edition (Wiley, New York, New York, 1996).
Brian C. Smith, PhD, is a Senior Infrared Product Specialist for PerkinElmer, based in San Jose, California. Before joining PerkinElmer, he ran his own FT-IR training and consulting business for more than 20 years, and taught thousands of people around the world how to improve their FT-IR analyses and interpret infrared spectra. Dr. Smith has written three books on infrared spectroscopy: Fundamentals of FTIR and Infrared Spectral Interpretation, both published by CRC Press, and Quantitative Spectroscopy: Theory and Practice published by Academic Press. He has published a number of papers in peer-reviewed journals and is a co-inventor on a patent for an FT-IR method to monitor dust exposure in coal mines. Earlier in his career, Dr. Smith worked as a spectroscopy applications specialist at Princeton Instruments and Digilab, and as a research chemist at AT&T Bell Labs, IBM, and Xerox. Dr. Smith earned his PhD in Physical Chemistry from Dartmouth College.

Brian C. Smith

AI Shakes Up Spectroscopy as New Tools Reveal the Secret Life of Molecules
April 14th 2025A leading-edge review led by researchers at Oak Ridge National Laboratory and MIT explores how artificial intelligence is revolutionizing the study of molecular vibrations and phonon dynamics. From infrared and Raman spectroscopy to neutron and X-ray scattering, AI is transforming how scientists interpret vibrational spectra and predict material behaviors.
Real-Time Battery Health Tracking Using Fiber-Optic Sensors
April 9th 2025A new study by researchers from Palo Alto Research Center (PARC, a Xerox Company) and LG Chem Power presents a novel method for real-time battery monitoring using embedded fiber-optic sensors. This approach enhances state-of-charge (SOC) and state-of-health (SOH) estimations, potentially improving the efficiency and lifespan of lithium-ion batteries in electric vehicles (xEVs).
New Study Provides Insights into Chiral Smectic Phases
March 31st 2025Researchers from the Institute of Nuclear Physics Polish Academy of Sciences have unveiled new insights into the molecular arrangement of the 7HH6 compound’s smectic phases using X-ray diffraction (XRD) and infrared (IR) spectroscopy.