Laser-Induced Breakdown Spectroscopy for Soil Measurements: Recent Progress and Potential
The unique strengths of LIBS-sample preparation optional, stand-off detection, portability, speed, and sensitive light element detection-point to future directions and potential for LIBS as a tool for soil measurements in precision agriculture.
Laser-induced breakdown spectroscopy (LIBS) has been investigated for soil measurements for more than 20 years. Initial work was largely focused on detection of toxic metals in soils for environmental remediation, whereas recent work has expanded to include soil nutrients. In this column, we discuss some of the most recent work in the context of other methods for soil analysis, and point to future directions and potential for LIBS as a tool for precision agriculture.
As longtime readers of this column know, I’m always on the hunt for “killer applications” for laser-based spectroscopy, and one of my favorite emerging methods is laser-induced breakdown spectroscopy (LIBS). In recent years, LIBS applications have blossomed in diverse areas such as recycling, mining, and metals measurements, among others. Some commonalities among successful applications play to the unique strengths of LIBS: optional sample preparation, stand-off detection, mobility and portability, speed, and sensitive detection of light elements. Although, unlike inductively coupled plasma–mass spectrometry ( ICP-MS) and some other elemental analysis methods, there is a large “matrix effect” for LIBS that changes the elemental emission based on the underlying material (because of differences in ablation and in-plasma chemistry), we are learning to use analytical methods and machine learning to correct for these changes with sufficient calibration. We’ve reported earlier in this column that machine learning methods can be used with LIBS and other spectroscopies to derive material properties, beyond the atomic emission that is the fundamental output of LIBS (1).
In the five years since the last time we covered applications in soil analysis, a great deal of progress has been made (2). Some of the progress is around hardware, with compact and portable lasers and spectrometers becoming more available and capable. Another measure of progress has been made as a result of the proliferation of machine learning tools, which make data analysis both more powerful and more available. We’ll touch on both in this article. First, what makes soil analysis a compelling application?
Why Soil Analysis?
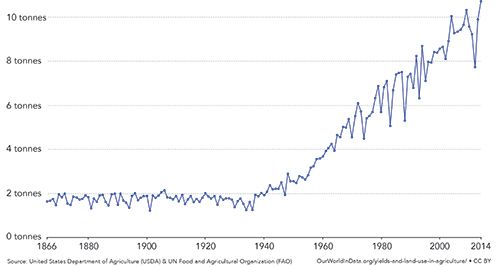
Soil analysis has been practiced for more than a century. In his 1960 article “History and Development of Soil Testing,” Anderson chronicles the advances in technology though that period, focusing primarily on phosphorous testing, but also considering potassium and nitrogen (3). He details methods developed for accurate extraction in a variety of soil types, and early evidence (as far back as 1890) of the relationship between soil nutrients and crop yield. Around the same time, in 1957, David Rice Gardner submitted his PhD thesis to Harvard University, entitled “The National Cooperative Soil Survey of the United States” (4). This was one of the first comprehensive surveys of soil science widely available to agricultural researchers. The post-World War II U.S. economy allowed a dramatic expansion of agricultural extension services at both the federal and the state level. An explosion of interest in soil science, as well as herbicides, insecticides, and more productive and disease resistant strains of crops, has led to dramatic increases in agricultural productivity from the mid-1950s through present day. An example of this productivity is shown in Figure 1.
Figure 1: Average corn yields per hectare in the United States,1866–2014, from Our World in Data, unmodified (5).
Naturally, soil analysis has evolved since 1960. Common practice over the past decade has been to collect samples in subsections of a field. Fifteen to twenty individual samples are collected from random places in a field subsection of less than 20 acres. The soil from that subsection is mixed. Tests report the pH level in the soil, the plant-available N, P, and K concentrations, Mg, Ca, and in some cases the percent organic matter in the soil and trace metals. Numerous methods are used in soil testing laboratories, from colorimetric methods to ICP-MS.
Recent trends in precision agriculture are for increasingly spatially-precise measurements of plant and soil health, acquired more frequently to provide increasingly localized irrigation, pest control, and fertilization. Rather than a single measurement for a field, or even for a 20-acre subplot, many local measurements are performed, perhaps supplemented by multispectral or hyperspectral imaging to assess plant health. These measurements feed into geospatial information systems on modern tractors and drip irrigation systems, all designed to provide the correct amount of water, pesticides, and nutrients to each part of the field.
LIBS for Soil Monitoring
Much of the early work in LIBS analysis of soils was focused on the detection of trace and heavy metals in soils (6,7). This followed from investments by the U.S. Department of Defense and U.S. Department of Energy exploring the use of LIBS for toxic metal detection in hazardous waste incinerators, in which the author was one of the participants. This application proved difficult because of a mismatch of detection limit requirements and a lack of analytical precision. For most toxic metals, the LIBS detection limit is between 1 and 20 ppm in a soil matrix, which is typically at least an order of magnitude higher than the required regulatory detection limit in soils. The changing (and unknown) matrix of soil at each site, and variable grain size of the soil, were also cited as potential issues for the measurement.
Over time, applications of LIBS for soil analysis have shifted toward analysis of higher-concentration elements, such as total carbon, as well as nitrogen, phosphorous, and potassium (referred to as NPK), magnesium, and calcium. These elements are at much higher concentration levels in soil than trace toxic metals, and are widely used in agronomy for measurement of soil health.
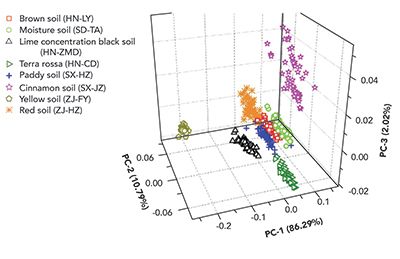
A theme of the more recent work on soil health using LIBS involves classification of the type of soil first, followed by application of a matrix-appropriate calibration. As an example of the ability to positively determine soil type, Yu and coworkers reported in 2016 on the use of soft independent modeling of class analogy (SIMCA) and least-squares support vector machines (LS-SVM) to discriminate between soil types (8). Seven primary emission lines from Al, Fe, Mg, Ca, Na, K, and Si were selected and used by the chemometric methods to predict soil type. Work with both algorithms revealed that SIMCA had a 90% correct classification rate, while LS-SVM had a 100% correct rate of classification with the training data. Following this, the trained LS-SVM model was applied to a set of eight unknown soil samples, and achieved nearly 100% discrimination. For visualization, Figure 2 illustrates the scores plot of the first three principal components of a principal component analysis (PCA) model on the unknown soil spectra.
Figure 2: The scores plot from the first three principal components of PCA applied to eight unknown soil samples from different regions of China. From (8), shared under the Creative Commons Attribution 4.0 International License.
This classification work was recently extended by a group from the Institute of Soil Science of the Chinese Academy of Sciences in Nanjing, China (9). They used LIBS, along with partial least squares regression, to predict some soil properties, pH, cation exchange capacity (CEC), and soil organic matter (SOM), as well as concentrations of total nitrogen, total phosphorus, total potassium, available phosphorous, and available potassium. The soil property measurements illustrate the ability of LIBS to measure more than simply elemental concentrations. The authors use both the full LIBS spectra and individual spectral lines to predict the soil properties and nutrients.
The authors took 200 soil samples from four different regions, pressed them into pellets, and acquired 75 spectra from each sample, using a 5 x 5 matrix of 25 points. They used 75% of the samples for training and 25% of the samples for validation, following baseline subtraction and a wavelet transform for de-noising.
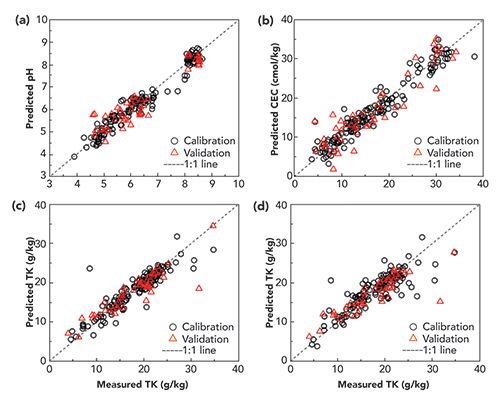
Figure 3 illustrates a subset of the results. Soil pH and CEC are both a function of the mineral composition of the soil, which influences the pH and “acid-neutralizing capacity” of the soil. Key emission lines related to pH, for example, were shown to be those related to K, Ca, Mg, Al, Si, Fe, and O. Full spectra, rather than individual elemental lines, proved much better at predicting total phosphorus or total potassium. Available phosphorous and available potassium were only weakly predicted. The authors suggest that these results justify application to a larger dataset with more soil types, and development of “simple and convenient” LIBS instruments and algorithms for field use.
Figure 3: (a) Soil pH and (b) soil CEC predicted from the entire LIBS spectrum. (c) Total K predicted by the entire LIBS spectrum, and (d) the K emission line alone. Adapted from (9), figures unchanged, shared under the Creative Commons Attribution 4.0 International License.
The studies discussed in references (8) and (9) show that it is quite possible to use LIBS to determine soil type, and to determine NPK and soil properties such as pH. A recent study by Sun and colleagues combines these features to predict trace quantities of metals in different soil types, by explicitly concatenating information about the soil type with the spectra vector during the training and validation steps. They then continuously change the adjustable parameters in the model during training, until the relative error of calibration is below a fixed threshold that they set. During the training, data points from spectra with different soil types and the same concentration are randomly exchanged, building a model that is sturdy in the face of experimental fluctuation and general for all soil types. This yields general models.
The authors applied this method to a LIBS data set covering four different soil types, six different concentrations, and with six replicates of each measurement. Preprocessing included picking the best spectral features to include in the model using a scoring criterion. The machine learning method was a back-propagating neural net with a single hidden layer. Stochastic gradient descent iterations were used to train the model.
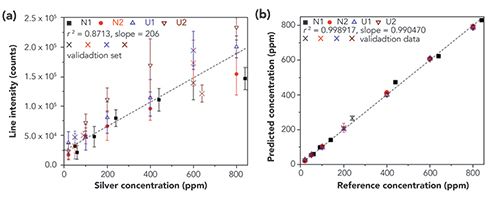
Figure 4 illustrates the result. Ag was spiked into two standard NIST soils and two collected soils. The univariate curve on the left illustrates the result using standard peak integration analysis on the Ag 328.1 nm neutral line. There is a non-zero y-intercept, and significant curvature in the line intensities due to self-absorption, and intensities for the same concentration of Ag may differ by as much as a factor of two. In contrast, the curve on the right shows nearly perfect agreement between the predicted concentration and the measured reference concentration using the generalized model.
Figure 4: Ag concentration in four different soil matrices as measured (a) by univariate peak integration, and (b) using a generalized model for all four matrices, building a model independent of soil type. From (10), shared under the Creative Commons Attribution 4.0 International License.
Prospects for LIBS-based Soil Testing
A few commercial efforts have begun to take root. One company, LogiAg, has spun out a solution called LaserAg that uses LIBS to measure key parameters of soil and foliage, including NPK values. Based in Quebec, Canada, they are employing their LIBS-based solution with local laboratories who have regionally specific calibrations to accommodate soil types. Calibrations require 500 samples collected from the region with a range of soil types and nutrient values. Once calibrated, customers send samples to the LaserAg laboratory for analysis.
SciAps is also offering its Z300 LIBS handheld for measurement of total organic carbon in soil. They used 87 soil samples from around the United States and Canada to build a calibration for total organic carbon. The R2 value of the calibration curve they present is 0.8825, with a root mean square error of 0.44% over the range 0-7% organic carbon, indicating that the portable LIBS system may be useful for local checks of carbon content with moderate precision.
The research and commercial results to date clearly indicate the promise for LIBS-based solutions in soil testing. Other portable methods of analysis such as X-ray fluorescence (XRF) cannot measure light elements such as nitrogen or carbon (the latter also being important in some aspects of soil analysis). XRF also requires more sample preparation and physical contact with the soil to be measured. The transportable nature of LIBS systems, combined with the stand-off nature of the analysis, makes LIBS a clear possibility for next-generation soil analysis and further evolution toward precision agriculture.
Potentially standing in the way of LIBS adoption for soil analysis is the large number of soil samples that would be required to build a comprehensive database (allowing for the general model to be built), due to matrix effects that need compensation. There is also the large infrastructure of agricultural extension support and testing laboratories around the world that are familiar with current practices. However, it seems to be only a matter of time before LIBS-based soil analysis gains wider adoption. Stay tuned!
References
- S.G. Buckley, Spectroscopy32(10), 26–31 (2017).
- S.G. Buckley, Spectroscopy30(1), 24–31 (2015).
- M.S. Anderson, J. Agric. Food Chem.8(2), 84–87 (1960).
- Reformatted and re-released by the U.S. Department of Agriculture in 1998, retrieved from: https://www.nrcs.usda.gov/Internet/FSE_DOCUMENTS/stelprdb1044424.pdf
- Retrieved from https://ourworldindata.org/grapher/average-corn-yields-in-the-united-states-1866-2014?time=1866..2014, shared under the Creative Commons Attribution 4.0 International (CC by 4.0) license.
- G.A. Theiault, S. Bodensteiner, and S.H. Lieberman, Field Anal. Chem. Technol.2(2), 117–125 (1998).
- J.M. Vadillo et al., Quimica Analitica 18(2), 169–174 (1999).
- K.-Q. Yu et al., Sci. Rep.6, 27574 (2016).
- X. Xu et al., Soil Syst. 3(4), 66 (2019).
- C. Sun et al., Sci. Rep.9, 11363 (2019).

Steven G. Buckley, PhD, is the Vice President of Product Development and Engineering at Ocean Insight, an affiliate associate professor at the University of Washington, and has started and advised numerous companies in spectroscopy and in applications of machine learning. He has approximately 40 peer-reviewed publications and 6 patents. His work in practical optical spectroscopy, such as LIBS, Raman, and TDL spectroscopy, dovetails with the coverage in this column, which reviews methods (new and old) in laser-based spectroscopy and optical sensing. Direct correspondence to: SpectroscopyEdit@mmhgroup.com.

LIBS Illuminates the Hidden Health Risks of Indoor Welding and Soldering
April 23rd 2025A new dual-spectroscopy approach reveals real-time pollution threats in indoor workspaces. Chinese researchers have pioneered the use of laser-induced breakdown spectroscopy (LIBS) and aerosol mass spectrometry to uncover and monitor harmful heavy metal and dust emissions from soldering and welding in real-time. These complementary tools offer a fast, accurate means to evaluate air quality threats in industrial and indoor environments—where people spend most of their time.
Laser Ablation Molecular Isotopic Spectrometry: A New Dimension of LIBS
July 5th 2012Part of a new podcast series presented in collaboration with the Federation of Analytical Chemistry and Spectroscopy Societies (FACSS), in connection with SciX 2012 — the Great Scientific Exchange, the North American conference (39th Annual) of FACSS.
New Multi-Spectroscopic System Enhances Cultural Heritage Analysis
April 2nd 2025A new study published in Talanta introduces SYSPECTRAL, a portable multi-spectroscopic system that can conduct non-invasive, in situ chemical analysis of cultural heritage materials by integrating LIBS, LIF, Raman, and reflectance spectroscopy into a single compact device.