Mapping Protein Conformational Stability Using Automated CD
Application Notebook
This study describes a new automated technique for measuring protein conformation by CD spectroscopy and how changes can be followed in different pH environments. The study confirms the robustness of the technique and superb sample-to-sample reproducibility.
David Gregson and Lindsay Cole, Applied Photophysics Ltd
This study describes a new automated technique for measuring protein conformation by CD spectroscopy and how changes can be followed in different pH environments. The study confirms the robustness of the technique and superb sample-to-sample reproducibility. The improvements in productivity enable experiments to be undertaken that were previously thought to be too time consuming or laborious.
Correct protein function is critically dependent upon conformation — if a protein is not correctly folded, it will not execute its function or worse, it may be toxic. Circular dichroism (CD) spectroscopy is an exquisitely sensitive probe of protein conformation but it is often perceived as a technique limited to more specialised applications. This is to some extent because, up until now, CD spectrometers have remained resolutely manual in operation which has now been overcome by new automation technology.
Experimental Conditions
Solutions of BSA, sodium phosphate, and sodium citrate were used to prepare a series of buffered protein samples from pH 2.2 to pH 8. The samples were prepared directly in a 96-well plate and each protein solution was paired with its buffer. Buffers and samples were transferred to the spectrometer using a fixed-probe x, y, z robot and CD and absorption spectra measured simultaneously and in duplicate. Each complete measurement, including washing, took 7.5 min to perform.
Results
The baseline-corrected CD data showed that there were two phase transitions, one occurring in the range pH 2.2 to pH 3.8 and the second between pH 4 and pH 8 (Figure 1), with isosbestic points at 201 nm and 206 nm, respectively.


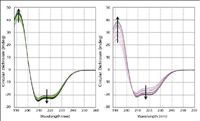
Figure 1: Buffer-subtracted CD spectra for BSA (260 nm ⥠λ ⥠188 nm) from pH 8 to pH 4 (left) and pH 3.8 to pH 2.2 (right). Arrows indicate increasing pH.
Plotting the raw data as a contour map gives an immediate semi-quantitative feel for the stability of the protein. Using quantitative methods, such as the global fitting of a model to the data, make it clear even to the untrained eye where regions of conformational stability exist (Figure 2). A three state model was used because the data suggest two transitions and this agrees with the well known behavior of serum albumin proteins (1). End point spectra for high-, intermediate-and low-pH were calculated as was the pKa of the transitions between them.


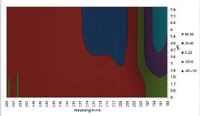
Figure 2: Calculated conformational stability map (CD contours). The conformation is stable at pH > 5.8.
Conclusion
The automated sample preparation and measurement of CD and absorption spectra have been shown to be reliable, giving quantitative results with minimum effort using robust global analysis techniques. Excellent reproducibility and sample economy together with the ability to carry out an unattended measurement at a rate of 200 samples per day considerably improves the productivity of CD measurements. These improvements offer the opportunity to study relative protein stabilities with ease, for example, in protein biotherapeutic development and clone selection procedures.
References
(1) D.C. Carter and J.X. Ho, "Structure of Serum Albumin." Advances in Protein Chemistry 45, 153–203. Lipoproteins, Apolipoproteins and Lipases, Academic Press 1994, Ed. Verne Schumaker. ISBN: 0-12-034245-6.
Applied Photophysics Ltd
1 Mole Business Park, Leatherhead, Surrey, United Kingdom
tel. +44 1372 386537, fax +44 1372 386477
Email: sales@photophysics.com, Website: www.photophysics.com


New Study Reveals Insights into Phenol’s Behavior in Ice
April 16th 2025A new study published in Spectrochimica Acta Part A by Dominik Heger and colleagues at Masaryk University reveals that phenol's photophysical properties change significantly when frozen, potentially enabling its breakdown by sunlight in icy environments.