Mass Analysis from Kilodaltons to Megadaltons Using Macroion Mobility Spectrometry
Special Issues
Mass spectrometry (MS) has advanced to analyze ever-larger biomolecules with the invention of soft ionization techniques like electrospray ionization (ESI). Although ESI has provided a method of generating ions of high mass, mass spectrometers generally suffer both lower sensitivity and lower resolution as the mass-to-charge ratio of an ion increases. To extend the mass range of ionized macromolecules beyond the limits of MS, macroion mobility spectrometry utilizes ion mobility sizing to characterize charge-reduced ESI-generated macroions from >5 kDa to beyond megadalton masses. One prominent application of macroion mobility spectrometry, highlighted here, is the high sensitivity analysis of intact proteins, antibodies, and conjugates in which molecular masses range from antibody light-chain fragments to high mass immunoglobulin multimers.
There is an increasing need for the analysis of high molecular weight compounds as pharmaceutical and biotechnology companies focus more attention on exploring protein therapeutics and biologics. Traditional analytical methods for macromolecules have included techniques such as size-exclusion chromatography and various forms of light-scattering measurements; however, chromatography separations are slow, and light-scattering detection can bias against lower molecular weight compounds. Both of these methods also require sophisticated calibration. Mass spectrometry (MS) also encounters difficulties at high molecular masses. Electrospray ionization (ESI) creates broad charge distributions that even with high-resolution MS are complicated to interpret for samples with multiple analytes. Matrix-assisted laser desorption ionization time-of-flight (MALDI-TOF) detection at high mass requires complex chemical derivatization for ionization, and microchannel plate detectors have decreased sensitivity with macroions because of their slower velocities.
An alternative method to analyzing macromolecules that emerged out of technology originally used to size nanoparticles is gas phase electrophoretic mobility molecule analysis (GEMMA) (1,2). In contrast to conventional ion mobility spectrometers, which separate small molecules (<1 kDa) by drift times, the GEMMA technique applies mobility separation in space for macromolecules (> 5 kDa). Today, GEMMA has evolved into macroion mobility spectrometry, which combines the resolution of chromatography, the speed of MS, and picomolar (attomole per microliter) detection limits for kilodalton to megadalton compounds.
High-Mass Ion Mobility Spectrometer
Conventional ion mobility spectrometry (IMS) systems employ atmospheric pressure TOF tubes to separate low-mass gaseous ions. These IMS systems, while affordable, simple, and sensitive, have poor dynamic range and low resolution when compared to MS. In the higher mass range, at which MS performance deteriorates, a gaseous ion separation method such as IMS would be complementary to MS. The macroion mobility spectrometer used in this study (MacroIMS 3980C, TSI Inc., Shoreview, Minnesota) employs charge-reduced nanoelectrospray ionization to simplify charge distributions to a singly charged state, fast ion mobility separations, and single ion counting to achieve high mass analysis.
A schematic of the macroion mobility spectrometry system is shown in Figure 1. The front-end of the system uses a standard nanoelectrospray configuration applying a fused-silica capillary, tapered at the spray end to help produce a sharp Taylor cone. Monodisperse droplets of ~150 nm are created from the spray and are transported from the spray region into the charge-stripping region, where bipolar air ions neutralize the surface charge on the droplet, preventing droplet explosion that would otherwise occur as the solvent evaporates. The charge-stripping region is designed such that analytes exiting the source have reached an equilibrium charge distribution, and analyte ions carry ± 1 charge or are neutral. When the samples being electrosprayed are at a concentration range in which there is one analyte per droplet or lower, charge competition and artificial aggregates are avoided; thus, quantitative results can be generated.
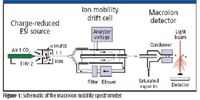
Figure 1
Gaseous analytes leaving the ion source are then separated by their size-to-charge ratio in the mobility cell. The mobility cell is cylindrical in geometry, and it consists of concentric tubes. Macroion separation occurs in an annular gap where there is a laminar flow of air and an electric field perpendicular to the airflow. The drag force on the particle in the flow and the electric force dictate the trajectory of ions in the mobility cell. With a constant and continuous flow of ions into the mobility cell, scanning the voltage on the central tube selects ions of different size-to-charge to be scanned out at an exit slit, which is located downstream from where the ions entered. Neutrals are filtered out with the recirculating annular flow. At a set voltage, a single macroion mobility is selected with 100% duty cycle.
In contrast to conventional IMS, where mobility measurements require extensive calibration to interpret results, macroion mobility spectrometry applies Stokes and Cunningham slip equations (which govern the drag on particles in a viscous flow) to fundamentally derive an ion diameter (in nanometers) from the measured mobility. Only because macroions behave like aerosol particles, as opposed to gaseous molecules if they were smaller, can the macroion mobility spectrometry system derive this size information. Thus, based upon the laminar flow rate, mobility cell dimensions, and applied voltage, the macroion mobility spectrometry system can determine macroion size fundamentally.
After ion separation, ions move through an ambient pressure macroion detector. The detector works by condensing supersaturated vapor onto individual ions so that they are large enough to be detected when they pass through a visible light laser. The condensation is initiated on ions with mobility diameter of at least 2.5 nm (~5 kDa), and it applies butanol as a chemically independent condensing fluid. Because ions are simply counted by photon detection above a background threshold, the light detection is not complicated by chemical refractive index, the angle, the wavelength, or the intensity of light scatter. The high sensitivity of the condensation detector, in contrast to charge detectors that require significant minimal current, allows the one-analyte-per-droplet mode of nanoESI operation to be applied successfully.
The mass range of macroion mobility spectrometry has been demonstrated on macroions as light as insulin (~ 5.7 kDa) to IgM multimers (~ 1.9 MDa) to the vault ribonucleoprotein (~ 12 MDa) (2,3). The correlation between measured macroion diameters to molecular weight shows a third-order fit with correlation coefficient R2 > 0.99 for proteins and biomolecules (Figure 2). This permits conversion between macroion diameter and molecular weight, and empirically indicates that the charge-reduced nano-ESI process generates spherical ions of constant density. Unlike liquid-based measurement methods, which measure a hydrodynamic or solvated ion radius, the macroion mobility spectrometer and its ion source do not appear to maintain such solvated shapes in the gas (4). Thus, measurements are related empirically to mass by a constant density, although fundamentally it measures diameter.
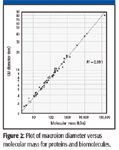
Figure 2
Figure 3 shows a typical macroion mobility spectrum, acquired in 3 min, for a high molecular weight standard (HMW electrophoresis kit, GE Healthcare, UK), prepared in 20 mM ammonium acetate and desalted with Zeba gel filtration kits (Pierce, Rockford, Illinois). An effective density of ~0.6 g/cc, in agreement with others (4,5), was determined based upon the known molecular weights of the compounds in this standard.
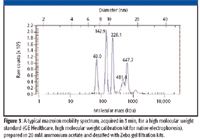
Figure 3
Dynamic Range and Quantitative Potential
The dynamic range of macroion mobility spectrometry spans 100 nM concentrations to low picomolar concentrations. The 100 nM upper concentration range maintains the one analyte per droplet operating regime. Choosing bovine catalase to focus on (from Figure 3) because of its stability and clear separation from the other peaks, the response curve in Figure 4 shows a linear relationship to over three orders of magnitude in concentration range, with R2 > 0.994. On the lower concentration end, the limit of detection is improved (Figure 4, upper trace) by increasing the scan time spent on an analyte of interest. The deviation of the area response at the lower concentration limits from the fitted equation with a y-intercept of zero suggests that background impurities can limit signal at these lower levels. The limit of detection is shown here to be <10 ng/mL. The application of low-bind vials, careful sample preparation, and a macroion detector (model 3776C, TSI Inc.) allowed the lower concentration limits to be investigated.
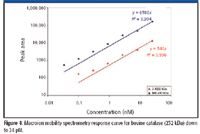
Figure 4
As a result of the operation of macroion mobility spectrometry under one-analyte-per-droplet conditions, application of the quantitation curve for bovine catalase to other proteins is possible. But this would require deconvoluting overlapping peaks and ensuring no analyte biases in the sample preparation. Furthermore, mass independencies on response would have to be verified, and certainly more samples will have to be analyzed.
Antibody Aggregate and Fragment Analysis
The analysis of protein aggregation and fragmentation is important for the biotechnology industry because it can adversely affect the efficacy of a drug and potentially cause problems in its intravenous administration. Aggregation and fragmentation can occur during protein purification, refolding, sterilization, shipping, and storage when physical and chemical stresses are present (6). Figure 5 shows the analysis of antibody (human IgG, reconstituted in 20 mM ammonium acetate, Sigma Aldrich,St. Louis, Missouri) stored, revealing dimer and trimer aggregation. The trimer peak was at about 2% of the peak intensity of the IgG monomer, and no tetramer, higher oligomers, or fragments above 0.1% of the IgG base peak intensity were detected.
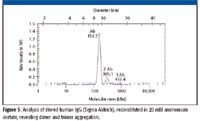
Figure 5
Figure 6 shows the antibody after partial enzymatic digestion at 37 °C for 2 h using immobilized papain (Pierce). Papain is a cysteine-endopeptidase that causes peptide cleavages of the IgG antibody, typically at the hinge region, generating mostly Fab and Fc fragments of ~50 kDa. The dominant peak in Figure 6 corresponds to the Fab and Fc fragments that resulted from the digestion. Light chain (~25 kDa) and F(ab')2 (~100 kDa) also were detected. Macroion mobility spectrometry readily differentiates antibody fragments, and it can even detect light chain at very low intensity in the presence of Fab and Fc, a challenge for light scattering.
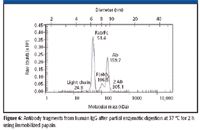
Figure 6
The study of antibody aggregates and conjugates as high as 25 MDa has been accomplished recently, demonstrating the high mass range and high sensitivity of macroion mobility spectrometry for protein aggregates (7,8).
Determining Binding Stoichiometries
The ratio at which proteins bind to form complexes can be studied by using macroion mobility spectrometry's ability to analyze intact complexes. In Figure 7, a biotinylated-antibody (goat) and streptavidin are combined and allowed to mix for over a week, to determine the equilibrium stoichiometry of the avidin-biotin complexes that are known to form. Interestingly, the spectrum of the mixture shows that the antibody is aggregated up to its trimeric form, while the streptavidin is present in both monomeric and dimeric forms. Although many possible stoichiometries exist theoretically, several are avoided due to steric hindrances, and ultimately, the streptavidin biotinylated-IgG clearly forms a stable 1:1 complex. The presence of both IgG and streptavidin, and the absence of higher ratio complexes, indicate that the IgG antibody was not likely fully biotinylated in the procedure we performed in-house on anti-biotin (B3640, Sigma-Aldrich).
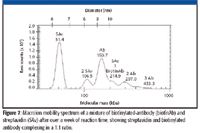
Figure 7
Other work on noncovalent protein complexes of avidin has been demonstrated (2). The ability to gently ionize these labile compounds and study their preferred stoichiometry allows a better understanding of macromolecular interactions.
The analyses demonstrated here with macroion mobility spectrometry are only a few of its possible applications. As the need to characterize high molecular weight compounds and complexes expands, it is expected that macroion mobility spectrometry will provide unique insights that complement MS and chromatography.
References
(1) S.L. Kaufman, J. Aerosol Sci. 29(5/6), 537–552 (1998).
(2) G. Bacher, W.W. Szymanski, S.L. Kaufman, P. Zollner, D. Blaas, and G. Allmaier, J. Mass Spectrom. 36, 1038–1052 (2001).
(3) C.S. Kaddis and J.A. Loo, Anal. Chem. 79(5), 1778–1784 (2007).
(4) C.S. Kaddis, S.H. Lomeli, S. Yin, B. Berhane, M.I. Apostol, V.A. Kickhoefer, L.H. Rome, and J.A. Loo, J. Am. Soc. Mass Spectrom. 18(7), 1206–1216 (2007).
(5) R. Rofougaran, M. Vodnala, and A. Hofer, J. Biol. Chem. 381(38), 27705–27711 (2006).
(6) O. Bermudez and D. Forciniti, J. Chromatogr., B 807, 17–24 (2004).
(7) L. Batta, K. Lancaster, B. Shyong, P.V. Tan, and V. Katta, ASMS 2007 poster presentation TPC053.
(8) B. Andrien, R. Patel, L. Willard, R. Alford, and P.V. Tan, ASMS 2007 poster presentation TPC047.
Phillip Tan and Shaun Kennedy are with TSI Incorporated, Shoreview, Minnesota. Axel Zerrath is with TSI GmbH, Aachen, Germany.

How Do We Improve Elemental Impurity Analysis in Pharmaceutical Quality Control?
May 16th 2025In this final part of our conversation with Harrington and Seibert, they discuss the main challenges that they encountered in their study and how we can improve elemental impurity analysis in pharmaceutical quality control.
High-Speed Laser MS for Precise, Prep-Free Environmental Particle Tracking
April 21st 2025Scientists at Oak Ridge National Laboratory have demonstrated that a fast, laser-based mass spectrometry method—LA-ICP-TOF-MS—can accurately detect and identify airborne environmental particles, including toxic metal particles like ruthenium, without the need for complex sample preparation. The work offers a breakthrough in rapid, high-resolution analysis of environmental pollutants.

.png&w=3840&q=75)

.png&w=3840&q=75)


.png&w=3840&q=75)


.png&w=3840&q=75)


