Micro-Raman Spectroscopy of Crystal Lattice Chemistry
Micro-Raman spectroscopy has been used to depth-profile a waveguide produced by an ion-exchange reaction in a single crystal of a ferroelectric metal oxide, and to reveal the changes in chemical bonding and atomic structure that occur in this process.

Topochemistry is a discipline within solid-state chemistry in which the chemical reaction is localized to the crystal surface of one of the reactants. In general, this means that the crystalline reactant undergoes a chemical transformation induced either by exposure to another reactant or light of a suitable wavelength to cause a photochemical reaction. Recently, the term crystal engineering has been used more frequently than topochemistry. This class of chemistry has allowed chemists to produce reaction products that otherwise could not be generated under any other conditions. Furthermore, it has led to the engineering of thin-film structures and waveguides whose chemical and physical properties differ to some degree from those of the reactant crystal. Micro-Raman spectroscopy is ideally suited to characterize and spatially resolve the chemical and physical changes that occur in topochemical reactions, particularly in thin films and waveguides.
In November of 1974, J.M. Thomas published a review lecture titled "Topography and Topology in Solid-State Chemistry." To my knowledge, this was the first review of the emerging field of topological chemistry or topochemistry (1), although the terminology was first used by Kohlschütter in 1919 (2). Topological chemistry is not the type of chemistry that most of us are familiar with where reactions occur in a beaker, flask, or perhaps turbulent or laminar flowing streams. Topological chemistry is a branch of solid-state chemistry. This type of chemical reaction generally falls into the category of crystal chemistry, in particular crystal-to-crystal chemistry. We might say that in these types of reactions, the reactant crystal functions as our beaker.
In a topological chemical reaction the crystalline reactant undergoes a chemical transformation induced either by exposure to another chemical reactant or light at an absorbing wavelength suitable to cause a photochemical reaction. It is important to distinguish between reactions that are localized, such as in liquid–solid or gas–solid reactions in which the solid reactant is consumed (for example, rust formation), and topochemical reactions in which the solid reactant phase undergoes a chemical transition to a solid product phase within the host crystal.
As you might imagine, the kinetics and thermodynamics of topochemical reactions are very much affected by the host crystalline environment. In some instances, compounds have been generated through crystal organic photochemistry that could not be produced in solution (3). The so-called reaction cavity must exist such that the intermolecular forces and structural arrangement of the atoms or molecules do not cause the crystal to simply break off or dissolve as the reaction occurs. At the same time, the crystal must allow for atomic or molecular movement sufficient for bond breaking and formation of the new compound as well as mass transport. One of the simpler topochemical reactions is an ion-exchange reaction in ferroelectric metal oxides.
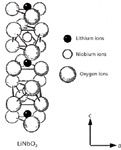
Figure 1: Atomic structure of LiNbO3 single crystal in the ferroelectric C3v phase, in which the niobium-oxygen octahedral (NbO6) is distorted and the Li+ is displaced above the oxygen planes along the c-axis.
One ferroelectric metal oxide that is of great technological importance is LiNbO3, which has a high optical nonlinear susceptibility and large electro-optic coefficient. The atomic structure of LiNbO3 is depicted in Figure 1. LiNbO3 has been used for decades to achieve frequency doubling and as an electro-optic switch. In general, individual crystals have been used in conjunction with other optical components to achieve the desired effect. However, in recent decades there has been extensive research on single crystals of LiNbO3 and other nonlinear optical single crystals to create integrated optical devices. This has largely been achieved through the fabrication of waveguides in single crystals through ion exchange. Waveguides fabricated in this fashion have made their way to the marketplace and are the active component in some commercially available optical modulators. In this installment, we discuss how micro-Raman spectroscopy has been used to depth profile a Li1-xHxNbO3 waveguide produced by an ion-exchange reaction in a single crystal of LiNbO3 and reveal the changes in chemical bonding and atomic structure that occur in this process (4).
The Example of Ion-Exchanged LiNbO3: Waveguide Fabrication
Hydrogen ion exchange of single crystal LiNbO3 with subsequent annealing of the chip has become a widely used method for the fabrication of waveguides with nonlinear optical and electro-optic capabilities. In the optics world, the process has become known as proton exchange (PE) when the ion being exchanged in the LiNbO3 crystal is H+for Li+. PE causes the formation of a step-like extraordinary refractive index (ne) profile in which Δne ~ 0.12. This region of higher refractive index allows optical confinement (waveguiding) when a laser beam is end-fired into this upper region of the chip. However, it has regularly been observed that the high optical nonlinearity of the LiNbO3 is significantly attenuated in the Li1-xHxNbO3 region and the device must be annealed to achieve partial recovery of the optical nonlinearity in the waveguide. An understanding of how annealing subsequent to proton exchange affects chemical bonding and crystal structure, which are related to refractive index and optical nonlinearity, has been the motivation for obtaining depth profiles of the Li1-xHxNbO3 region. Micro-Raman depth profiles reveal optimal conditions for the more efficient design and fabrication of PE waveguide devices.
Chips from Z-cut LiNbO3 single crystal wafers were subjected to proton exchange with pyrophosphoric acid at 260 °C and subsequently annealed at 300 °C for various times. (We use the nomenclatures of chemists and optical engineers in this article. The designations of a, b, and c crystallographic axes of the chemist in the reference literature correspond to the X, Y, and Z crystallographic axes of the optical engineer, respectively.) The X-faces of the proton exchanged LiNbO3 samples were polished to provide a side view of the Li1-xHxNbO3 region. Approximately 2 mm of material was removed from the X-faces, thereby ensuring that the analysis probed H+penetration and exchange that occurred with mass transport along the Z-axis. Micro-Raman maps of the PE region were obtained by stepping a 1.6-mW, 488.0-nm focused (0.6 µm diameter) laser beam at intervals as small as 0.2 µm. The sample was translated with an electronic stage such that the beam moved across the X-face starting below the PE region and moving parallel to the Z-axis towards the wafer surface. The incident beam was Z-polarized and no analyzer was used. A diagram of the experimental configuration with respect to laser polarization and crystal orientation is shown in Figure 2.
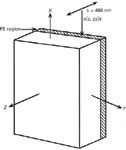
Figure 2: Diagram of a slab waveguide fabricated in a Z-cut LiNbO3
The Example of Ion-Exchanged LiNbO3: Depth Profiling by Micro-Raman Spectroscopy
All spectra were acquired under identical conditions with Z-polarized incident laser light. The micro-Raman depth profile of the unannealed sample (shown in Figure 3) reveals that the Li1-xHxNbO3 region is 3.0-µm thick and that chemical bonding is heterogeneous. The spatial variation in chemical bonding and atomic structure are revealed by the changing scattering strengths and band structures at different positions in the Li1-xHxNbO3 region. The bands at 153, 238, 254, 274, and 633 cm-1, which are all strong in LiNbO3, are significantly attenuated, and a strong band emerges at 690 cm-1and reaches its maximum intensity at a depth of 1.4 µm. In particular, the emergence of the 690-cm-1band reflects the change in NbO6 chemical bonding induced by the proton exchange; this band is very weak in the spectrum of the original LiNbO3. Two partially resolved bands at 640 and 670 cm-1are predominant in the infrared (IR) absorption spectrum (5) of LiNbO3, whereas the powder macro-Raman spectra of LiNbO3 and HNbO3 obtained by us contain very weak and strong bands at 695 and 680 cm-1, respectively.
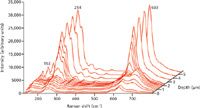
Figure 3: Micro-Raman depth profiles obtained from the X-face of Z-cut LiNbO3 single crystal
Therefore, proton exchange induces a change in the NbO6 chemical bonding such that a vibrational mode, which is Raman inactive but IR active in LiNbO3, becomes Raman active in Li1-xHxNbO3. Also, proton exchange causes the band resolution to diminish; note the near disappearance of the 153-cm-1band and the emergence of a broad shoulder on the high energy side of it. This can be attributed to the loss of long-range translational symmetry resulting from partial replacement of Li. The Raman depth profile of the unannealed Li1-xHxNbO3 region is approximately symmetric before and after the 1.4-µm position. The significant attenuation of the NbO6 bands is consistent with diminished nonlinear and electro-optic strength of the Li1-xHxNbO3 region because Raman scattering strengths are directly related to both of these properties (6,7).
Annealing an exchanged sample for 1 h reduces H+concentration by driving H+deeper into the wafer, thereby expanding the Li1-xHxNbO3 region to 4.9 µm, and alters chemical bonding and atomic structure in the NbO6 octahedra, which makes it more uniform through much of the Li1-xHxNbO3 region deeper than 1 µm. Inspection of Figure 4 reveals that the shoulders on either side of the 254-cm-1band increase, the NbO6 band strengths partially recover, and the 690 cm-1Li1-xHxNbO3 band shifts to 675 cm-1. The changes are related to the bonding and the degree of distortion in the NbO6 octahedra, and the partial recovery of the NbO6 band strengths correspond to the partial recovery of the optical nonlinearity with annealing that is observed through independent second harmonic generation measurements.
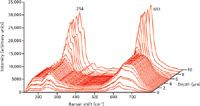
Figure 4: Micro-Raman depth profiles obtained from the X-face of Z-cut LiNbO3 single crystal
Heating another sample of proton exchanged LiNbO3 for 4 h generates a 5.3-µm Li1-xHxNbO3 region that is even more uniform throughout the waveguide, and the micro-Raman depth profile reveals that the Li1-xHxNbO3–LiNbO3 interface is not as sharp as in the 1-h and unannealed samples (see Figure 5). The shoulders of the 254-cm-1band are weaker, the 633-cm-1band is more resolved than in the spectra from the 1-h anneal, the 675-cm-1 Li1-xHxNbO3 band is now a moderate shoulder, and the NbO6 band strengths show further recovery. Perhaps most notable is that by increasing the anneal time from 1 h to 4 h the Li1-xHxNbO3 region expanded very little. However, the additional heating allowed significant restoration in the NbO6 chemical bonding and atomic structure to occur; the Raman spectra in the Li1 xHxNbO3 region appear much more like that of the substrate LiNbO3.
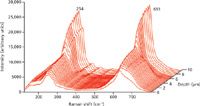
Figure 5: Micro-Raman depth profiles obtained from the X-face of Z-cut LiNbO3 single crystal
Heating an exchanged sample for 10 h generates a more uniform 5.3-µm Li1-xHxNbO3 region with a Li1-xHxNbO3–LiNbO3 interface that is even more gradual than that for the 4-h anneal (see Figure 6). The shoulders of the 254-cm-1 band have weakened such that the 153-cm-1 band can now be resolved, the 633-cm-1 band is further resolved, the 675-cm-1 shoulder has further weakened, and the NbO6 band strengths show additional recovery. Finally, the micro-Raman depth profile of the sample annealed for 15 h (not shown here) is almost identical to that for the 10-h anneal, suggesting that the fullest spectral recovery possible was obtained by 10 h of heat treatment.
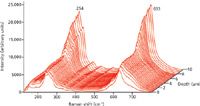
Figure 6: Micro-Raman depth profiles obtained from the X-face of Z-cut LiNbO3 single crystal
The need to consider chemical bonding and atomic structure (particularly long-range translational symmetry) in a characterization of Li1-xHxNbO3 is made clear by the Raman strength depth profiles of the OH stretch shown in Figure 7. Spectra from the OH stretching region were obtained at the same positions as the NbO6 region spectra, and therefore, correspond to their low-frequency counterparts in Figures 3–6. Spectra from the unannealed sample consist of strong, sharp, partially resolved bands at 3501 and 3508 cm-1 with a low-frequency tail. Annealing weakens the Raman strength and causes a single, slightly broader band to appear at 3507 cm-1 (1 h) and 3510 cm-1 (4, 10, and 15 h). These spectral changes can be attributed to changes in chemical bonding and H+ position relative to the NbO6 octahedron, both of which affect the vibrational mode frequency and Raman scattering cross-section. There have been attempts to estimate proton concentration in the waveguide region by measuring the IR absorption or Raman scattering strength of the OH band. However, this would appear unreliable because Raman and infrared strengths of the OH band can only be used to determine proton concentrations if the scattering cross-sections and absorptivities of the modes are known. Furthermore, the spectra clearly change with annealing duration without any evidence for the expansion, and therefore dilution, of the Li1-xHxNbO3 region.
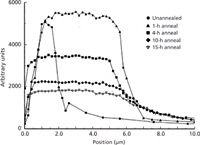
Figure 7: OH Raman band strength (integrated intensity) depth profiles obtained from the X-face of Z-cut LiNbO3 single crystals subjected to H+ exchange and subsequently annealed for the time indicated in the figure at 300 °C.
The depth profiles reveal that the primary effect of any annealing is to broaden the Li1-xHxNbO3 region and cause it to be more homogeneous. Annealing beyond a certain time does not substantially expand the Li1-xHxNbO3 region; however, it does produce progressive changes in chemical bonding, atomic structure, and the softening of the Li1-xHxNbO3–LiNbO3 interface. There is a direct correlation between the spectral changes in the OH stretching region and those in the NbO6 spectral region. Specifically, the attenuation of the OH Raman scattering strength as the band structure and Raman scattering strength from the NbO6 vibrational modes are partially restored to that of the original LiNbO3 band structure and its associated high optical nonlinear susceptibility.
Conclusions
Depth profiling by micro-Raman spectroscopy is clearly an effective method for the characterization of topological chemical reactions. Here, we have seen how micro-Raman spectroscopy has been used to depth profile for a Li1-xHxNbO3 waveguide produced by an ion-exchange reaction in a single crystal of LiNbO3 and reveals the changes in chemical bonding and atomic structure that occur in this process. This study demonstrates that annealing beyond 1 h does not significantly alter the Li1-xHxNbO3 region depth, but the duration of the anneal does affect the chemical bonding, atomic structure, long-range translational symmetry of the Li1-xHxNbO3 region, and the sharpness of the Li1-xHxNbO3–LiNbO3 interface. Consequently, the determination of proton concentration alone is insufficient for a characterization of Li1-xHxNbO3 waveguides and an understanding of how proton exchange affects refractive index and the optical nonlinear susceptibility of LiNbO3.
References
(1) J.M. Thomas, Philos. Trans. R. Soc.London, Ser. A 277, 251–286 (1974).
(2) V. Kohlschütter and P. Haenni, Z. Anorg. Allg. Chem. 105, 121–144 (1919).
(3) H.E. Zimmerman and E.E. Nesterov, Acc. Chem. Res. 35, 77–85 (2002).
(4) D.D. Tuschel and G.R. Paz-Pujalt, Ferroelectrics 151, 85–90 (1994).
(5) M.I. Díaz-Güemes, I. González Carreño, and C.J. Serna, Spectrochim. Acta A 45, 589–593 (1989).
(6) W.D. Johnston, Jr., Phys. Rev. B 1, 3494–3503 (1970).
(7) I.P. Kaminow and W.D. Johnston, Jr., Phys. Rev. 160, 519–522 (1967).
David Tuschel is a Raman applications manager at Horiba Scientific, in Edison, New Jersey, where he works with Fran Adar. David is sharing authorship of this column with Fran. He can be reached at david.tuschel@horiba.com

David Tuschel
AI-Powered SERS Spectroscopy Breakthrough Boosts Safety of Medicinal Food Products
April 16th 2025A new deep learning-enhanced spectroscopic platform—SERSome—developed by researchers in China and Finland, identifies medicinal and edible homologs (MEHs) with 98% accuracy. This innovation could revolutionize safety and quality control in the growing MEH market.
New Raman Spectroscopy Method Enhances Real-Time Monitoring Across Fermentation Processes
April 15th 2025Researchers at Delft University of Technology have developed a novel method using single compound spectra to enhance the transferability and accuracy of Raman spectroscopy models for real-time fermentation monitoring.
Nanometer-Scale Studies Using Tip Enhanced Raman Spectroscopy
February 8th 2013Volker Deckert, the winner of the 2013 Charles Mann Award, is advancing the use of tip enhanced Raman spectroscopy (TERS) to push the lateral resolution of vibrational spectroscopy well below the Abbe limit, to achieve single-molecule sensitivity. Because the tip can be moved with sub-nanometer precision, structural information with unmatched spatial resolution can be achieved without the need of specific labels.