Multichannel Raman Spectral Reconstruction and Fast Imaging Based on Global Weighted Linear Regression
Raman spectroscopy is a powerful, label-free spectral imaging technique for biomedical sample measurements. The chemometric approaches described here increase the speed of data acquisition and improve the resolution of Raman images.
Raman imaging is a nondestructive spectral imaging technique that is widely used in the biomedical field. However, slow data acquisition has seriously hindered the expansion of its application for fast dynamic systems. In this study, we completed the reconstruction of Raman spectra and imaging based on multichannel Raman imaging. First, we optimized the training samples, and made a global assignment weighted to the optimized samples to establish the linear regression function. Second, normalization and polynomial regression were introduced to improve the accuracy of reconstructed spectra based on the multichannel imaging of each pixel. Third, Raman imaging with high signal-to-noise ratio was established by the area or intensity of characteristic peak. Benzonitrile was used in the experiment and the accuracy of the reconstructed Raman spectrum was evaluated in terms of relative root mean square error (RMSE). The results show the accuracy of the Raman spectrum reconstructed by this algorithm is 58% higher than that of the pseudo-inverse, and 44% higher than the Wiener estimation. Therefore, this algorithm provides theoretical support for the application of Raman imaging technology in fast dynamic systems.
Raman spectroscopy is a powerful label-free spectral imaging technique for biomedical applications (1–2). As a result, it has become a diagnostic or analytical tool for various diseases (3–4). However, slow data acquisition of Raman spectra has seriously hindered the expansion of its application. As a result, we researched how to improve the speed of data acquisition of Raman spectra, and how to improve the resolution of Raman imaging.
To date, two methods (5) have been explored. The first method is line scanning: A laser spot is concentrated on the surface of the sample by scanning along a line, and the corresponding Raman spectral signals are imaged on the charged coupled device (CCD) of the spectrometer. Line scanning simultaneously collects multiple spectra and improves the speed of scanning. However, it is still a time-consuming process. Simultaneously, the resolution of Raman imaging can only reach the submicrometer level.
The second method is wide-field imaging. By exciting the sample in a wide field, Raman scattering is directly coupled to the surface of CCD, and the wavelength of the passed signal is converted to single wavelength imaging using a liquid crystal tunable filter (LCTF) (6). Compared to line scanning, wide-field imaging can achieve higher resolution and better dynamic performance. However, it can only collect spectra of a single wavelength at two spatial dimensions.
Therefore, it is important to develop a Raman imaging approach that is cost-effective and achieves fast data acquisition. Multichannel Raman imaging technology (7) is an effective way to solve this problem, and its principle is shown in Figure 1. First, the multichannel Raman spectroscopy images are simultaneously obtained using different filters and the area array CCD. Second, the full Raman spectrum of each pixel is quickly reconstructed based on the measurements of different narrow bands. Finally, Raman imaging with a high signal-to-noise ratio is obtained by the area or intensity of characteristic peak.
Figure 1: Schematic of the multichannel Raman imaging system.
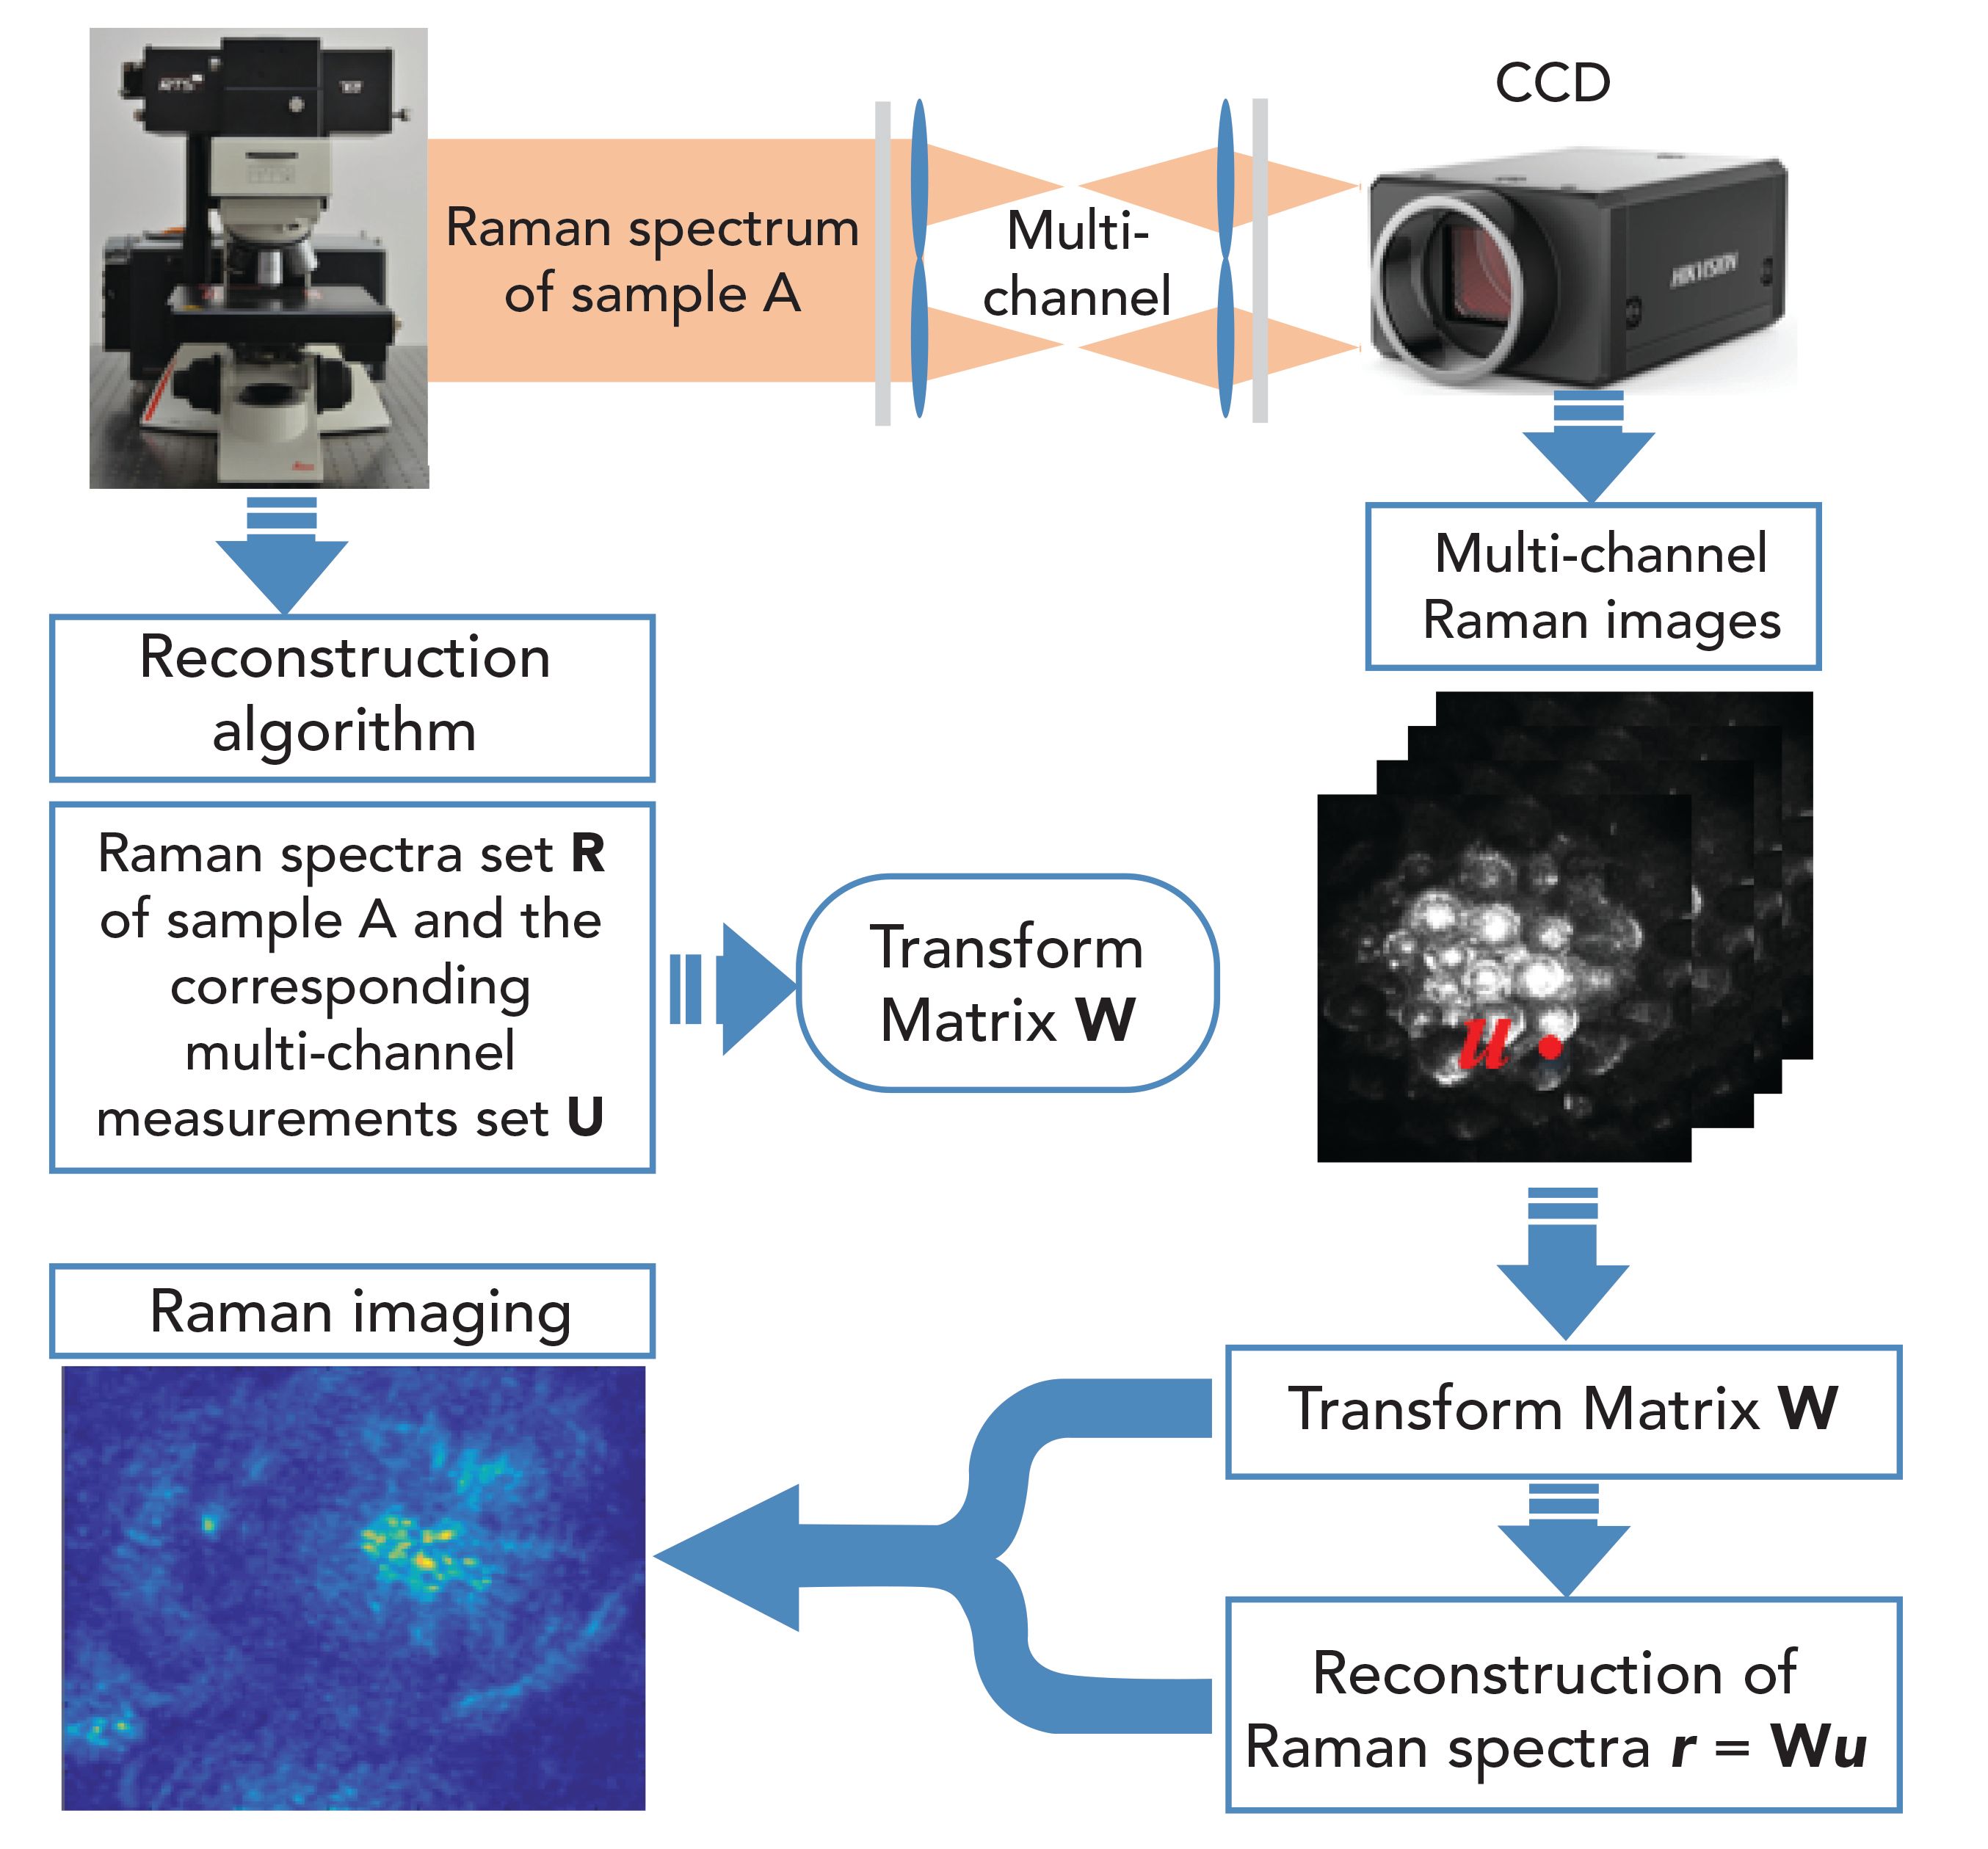
It can be seen from Figure 1 that the reconstruction of a Raman spectrum is the key to this system. At present, the algorithms capable of spectral reconstruction are pseudo-inverse (8) and Wiener estimation (9). Although these methods are simple and easy to carry out, they are susceptible to nonlinear factors such as noise and vibration when applied to the reconstruction. Because these algorithms are derived from the reconstruction of spectral reflectance simultaneously, the number of training samples is relatively large and bad samples will be included.
Therefore, we propose a specialized algorithm for the reconstruction of Raman spectra. First, we perform polynomial regression on the multichannel measurements to reduce the influence of nonlinear factors. Second, we establish a linear regression function by optimizing the training samples and making a global assignment weighted to the optimizing samples. Finally, we introduce normalization, and we achieve fast reconstruction of Raman spectra. In addition, the quality of the reconstruction of Raman spectra will be determined based on the root mean square error (RMSE).
Algorithm
The Raman spectra set R of sample A (as shown in Figure 1) is obtained by using a conventional Raman spectrometer, and these spectra are used as training samples. The corresponding multichannel measurements in set U are achieved by calculating the inner product between each Raman spectrum of R and the spectral response function matrix of the bandpass filters at the wavenumber of the characteristic peak. And so far, the preparation for solving the transform matrix W of sample A has been completed. In the process of solving for W based on global weighted linear regression, R goes through three phases: a preprocessing stage, a calibration stage, and a test stage
Preprocessing Stage
Polynomial Regression of Set U
In actual situations, multichannel measurements will be affected by various nonlinear factors such as noise and vibration. Those factors will reduce the accuracy of reconstructed spectra. Therefore, polynomial regression is introduced (10).
We can take second-order polynomial regression to any element uiof the U to get ūi. Given that the number of channels is four, the result of ūi is as shown in equation 1:
[1]

Optimizing Training Samples
If the spectrum of training samples is close to the spectrum of sample A, this spectrum will make a greater contribution to the Raman spectra reconstruction based on the Wiener estimation. Therefore, eliminating bad samples and simplifying the capacity of samples is very important before solving for W, and will improve the speed of calculation.
First, the reconstructed spectrum r is quickly reconstructed from the multichannel measurements u of sample A based on the Wiener estimation. Second, r is normalized. Third, introducing the Tanimoto coefficient (11) and calculating the degree of similarity λi between r and any spectrum of ri, we get the training samples set R:
[2]

Setting a threshold value λ0, if the degree of similarity of sample ri is less than λ0, sample riis directly deleted. Thereby, training sample set R is optimized, and turns into

. Simultaneously, the corresponding set U is also optimized and denoted as Ū. The λi is assigned to the corresponding element of the

, as well as Ū; that is,
ri = λiri,ui = λiui. After this operation, and Ūare defined as follows:
[3]

[4]

Calibration Stage
In this paper, we establish a linear regression (12–15) function between Rand
[5]

To get the values of W and e, we do as follows: Taking the element ui of Ū into equation 5, we get the corresponding Raman spectrum ri. That is, ri = W * ui + e.
We set a parameter of optimization judgment k Σ(ri - r )2 α = i = 1 , where k represents the sample size of R. When the value of α is the smallest, we can get the result as shown in equation 6:
[6]

According to equation 6, we get the values of Wand e:
[7]

where and the superscript “T” indicates the matrix transpose.
Test Stage
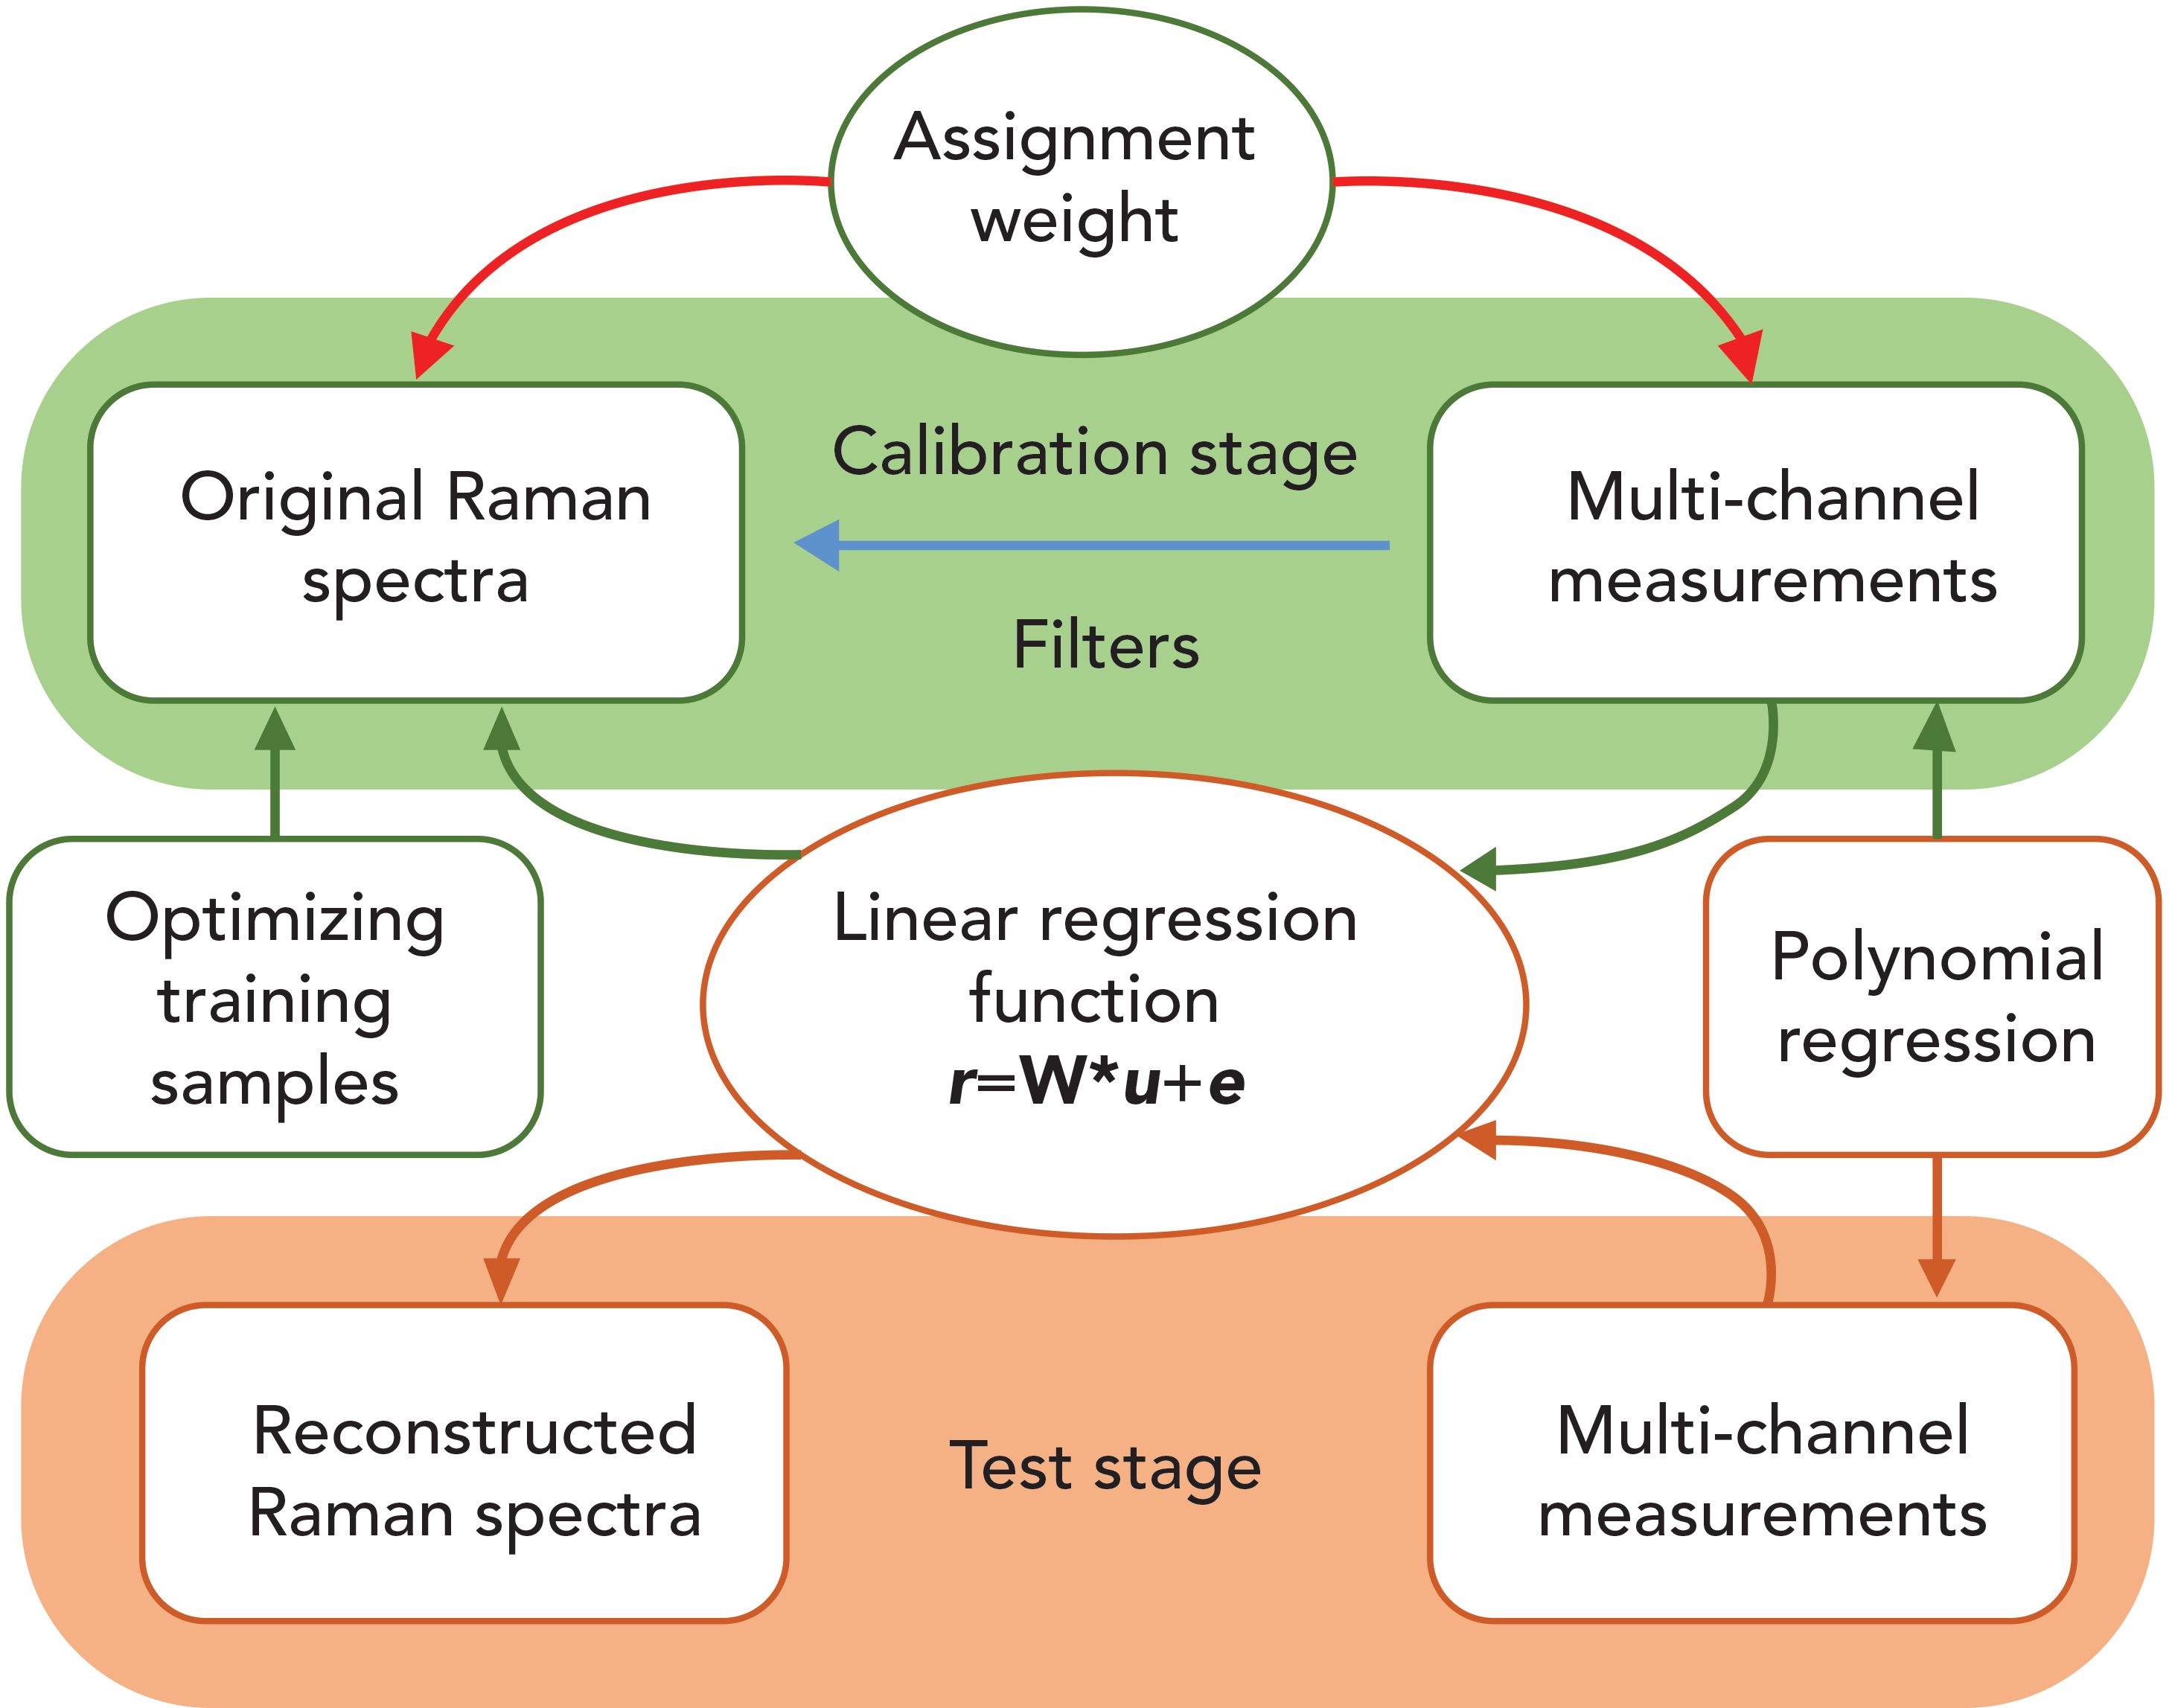
In the calibration stage, the Raman spectrum can be quickly reconstructed from the multichannel measurements of sample A, by using equation 5. The overall process is shown in Figure 2.
Figure 2: Process of a spectrum reconstruction based on global weighted linear regression.
Simulation and Experiment
Simulation
For the simulation, we used benzonitrile as an experimental sample, and measured the sample many times using a conventional Raman spectrometer (with a 532 nm laser source). The Raman spectra set is obtained, and k represents the number of measurements. To improve the accuracy of the experiment, the B-spline is used to eliminate the fluorescent background (16) and the processing results are shown in Figure 3.
Figure 3: Comparison of the original spectra of benzonitrile and the spectra after eliminating background fluorescence.
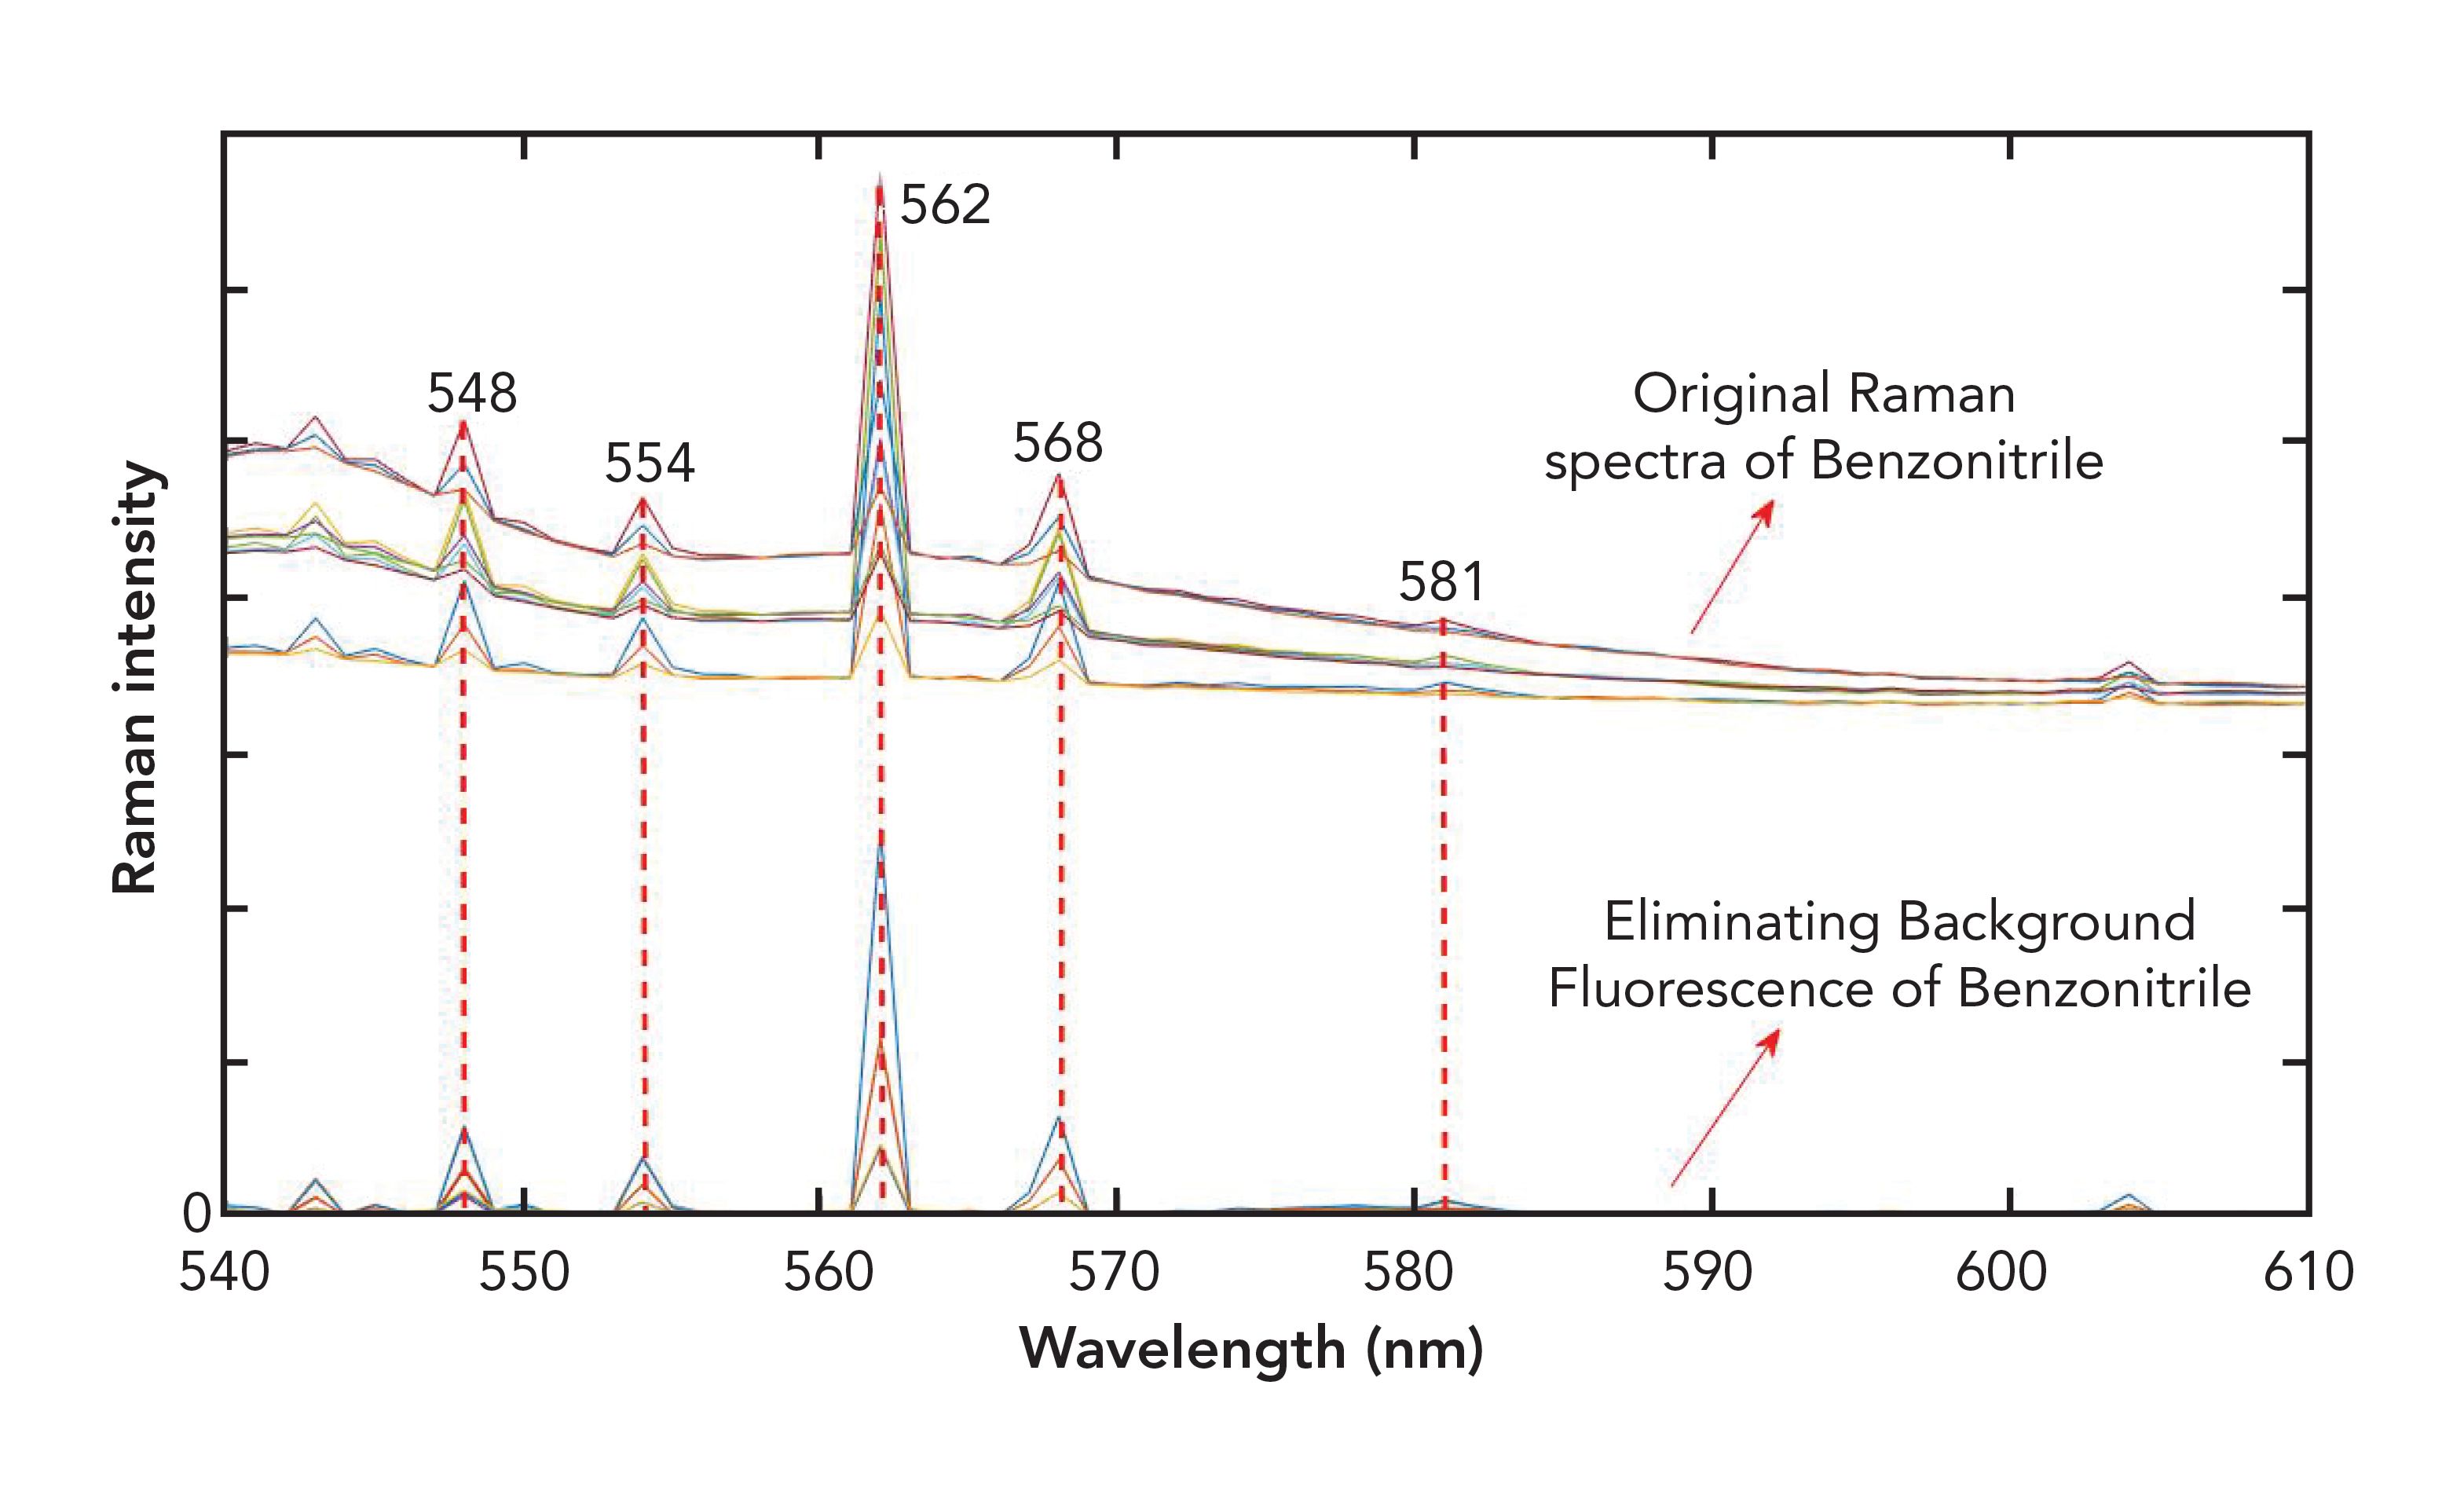
The characteristic peaks of benzonitrile are concentrated on the wavelength range of 540 to 610 nm, as shown in Figure 3. Four commercial narrow-bandpass filters with the central wavelengths (bandwidths) of 550 nm/10 nm (FB550-10, Thorlabs), 560 nm/10 nm (FB560-10, Thorlabs), 570 nm/10 nm (FB570-10, Thorlabs), and 580 nm/10 nm (FB580-10, Thorlabs) are selected to achieve the multichannel measurements set
U={u1,u2 ...,ui ...,uk}. The sets R and U become

and Ū following the preprocessing step, which we have proposed as above.
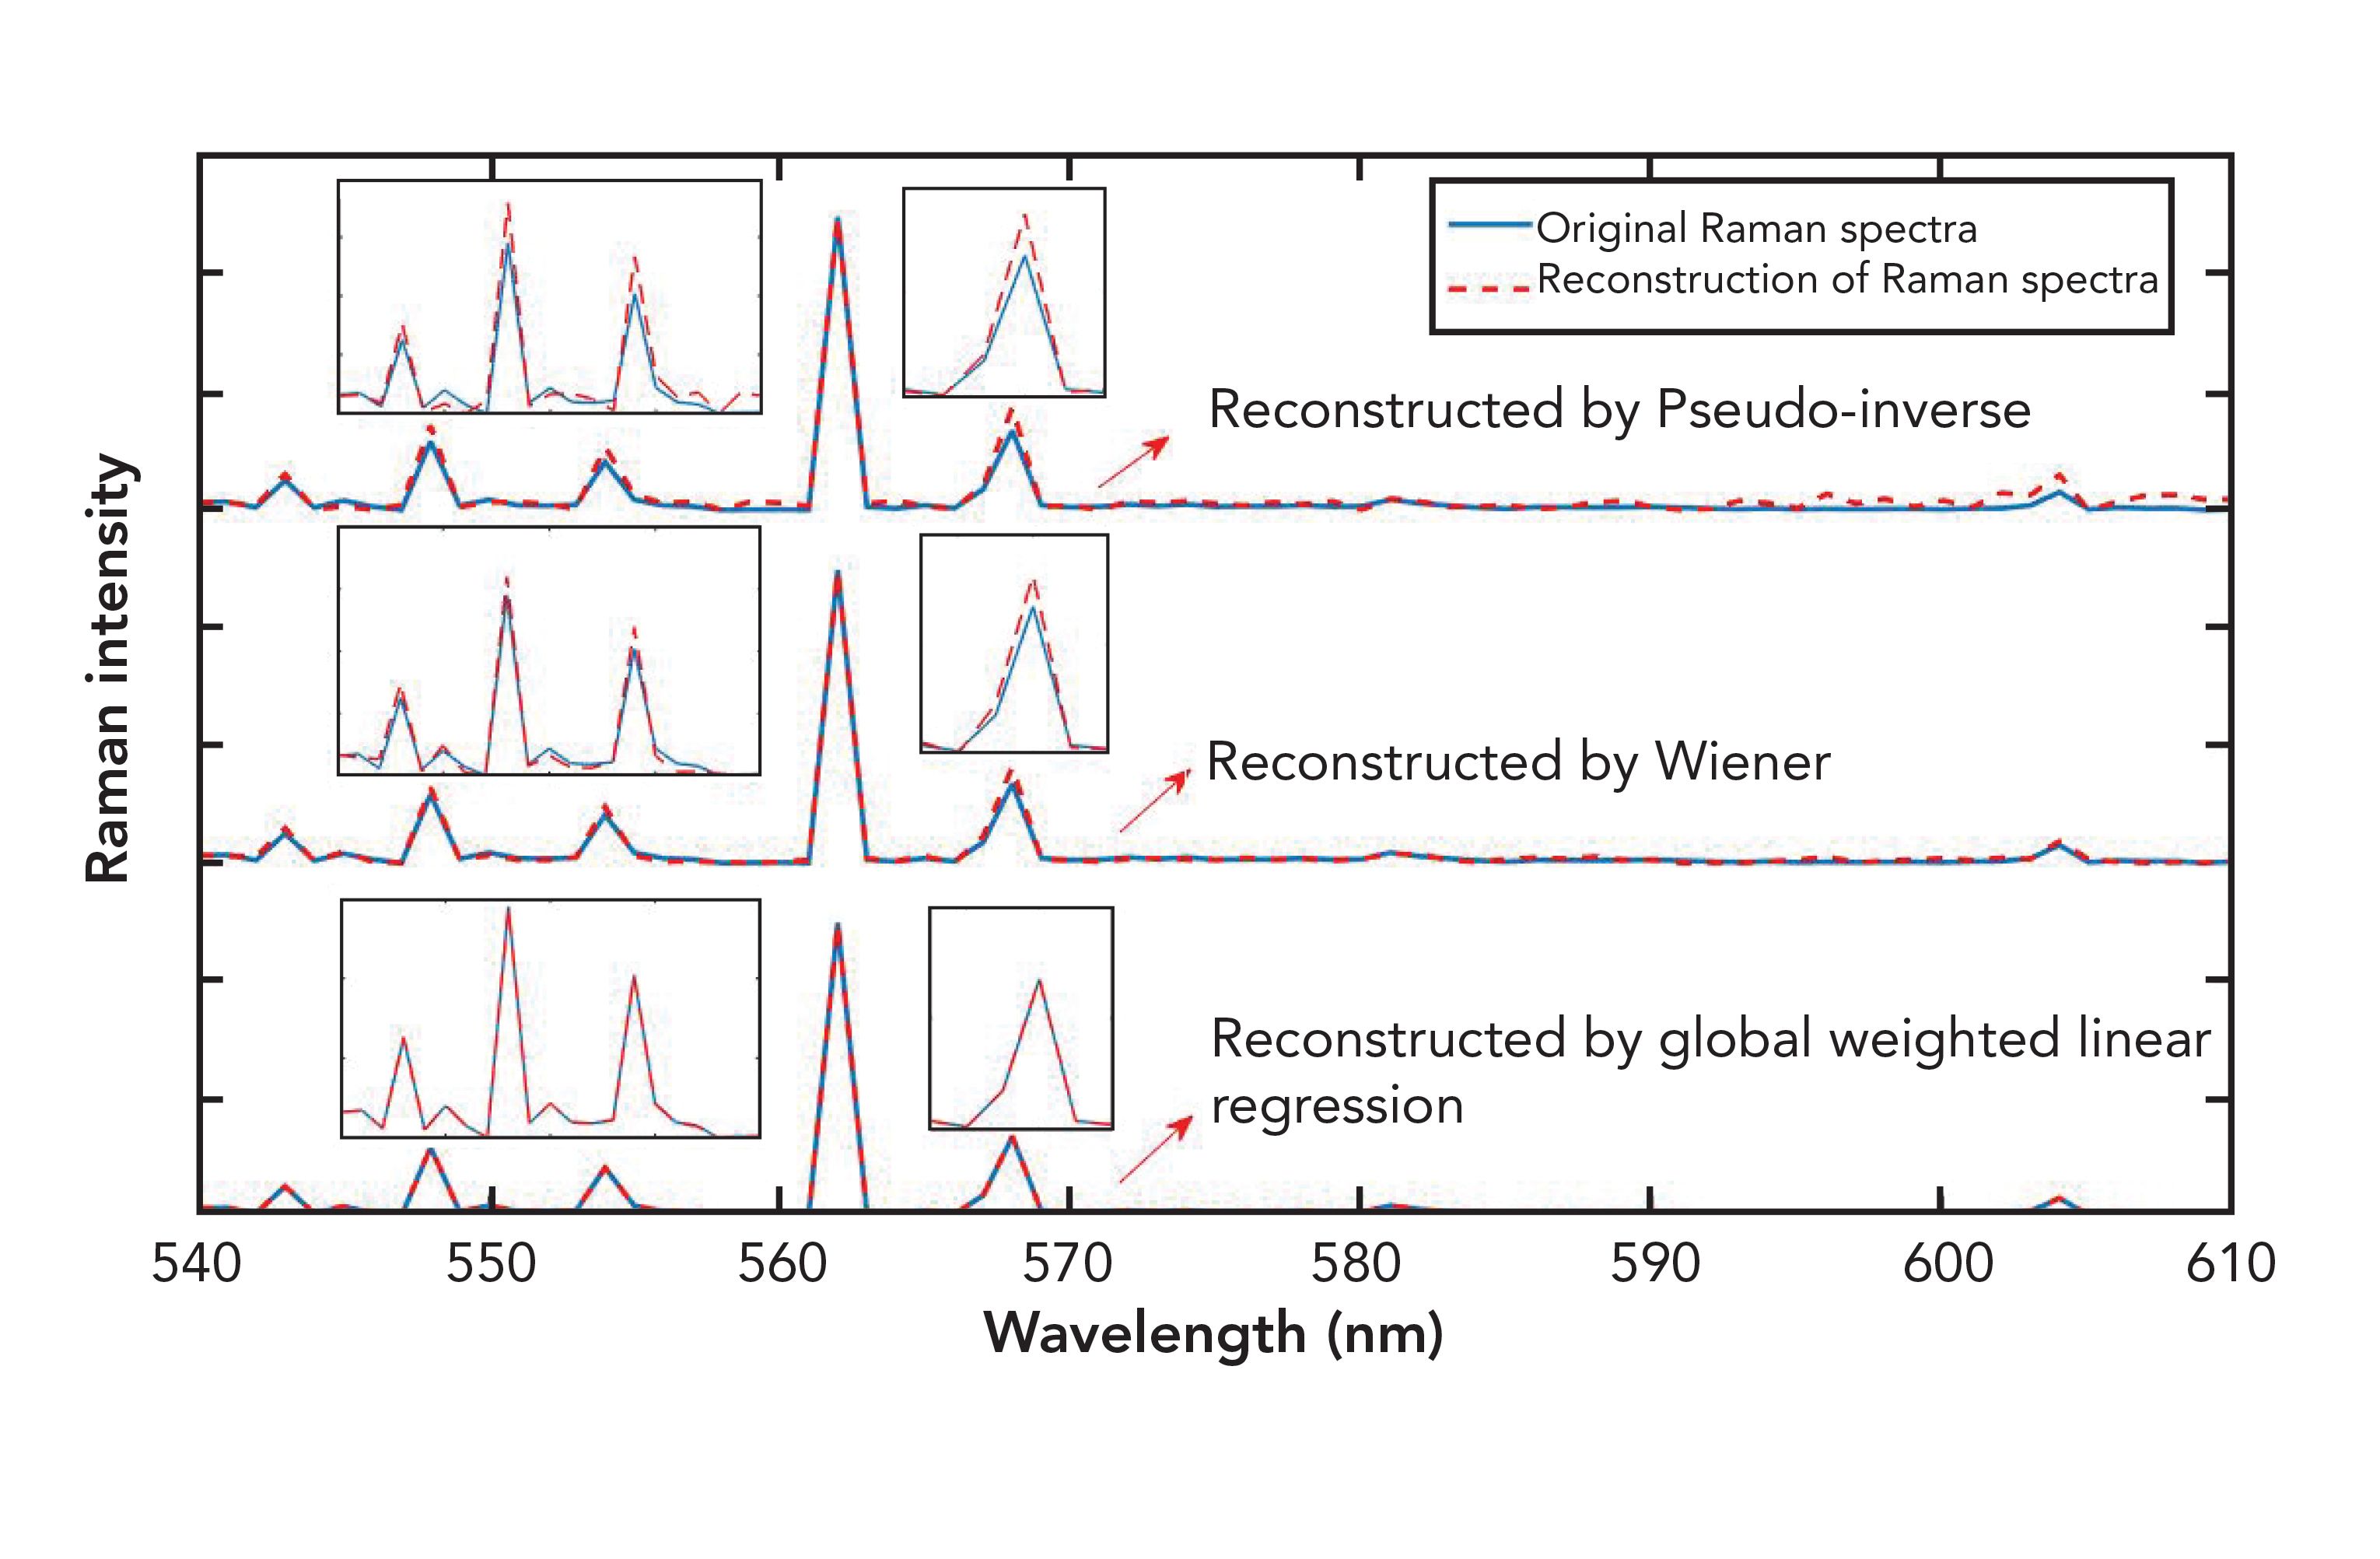
Inserting any multichannel measurement elements ūi of the optimized set Ū into equation 5, the Raman spectrum can be quickly reconstructed. Afterward, is normalized and compared with the actual spectrum ri. Simultaneously, the pseudo-inverse and Wiener estimation are also used to complete the reconstruction. The results of reconstruction are shown in Figure 4.
It can be seen from Figure 4 that our algorithm has better accuracy in the reconstruction of Raman spectra compared with pseudo-inverse and Wiener estimation. To make a quantitative evaluation of our algorithm, RMSE is introduced, where:

Figure 4: Reconstruction of Raman spectra in theory: comparison among spectra reconstruction of benzonitrile based on three algorithms in theory.
and where the superscript “T” indicates the matrix transpose. We then have:
[8]

where is the reconstructed spectrum, ri is the actual spectrum, and N is the length of the Raman spectrum. The average RMSE between reconstructed spectra by our algorithm and the sample is 0.0578, which is slightly better than the other two methods, as shown in Table I. The samples r1, r2, and r3, represent a random selection from the optimized training sample. Table I shows how our algorithm improves the accuracy of the reconstructed spectrum compared with the pseudo-inverse and the Wiener estimation, with the rates of improvement being 58% and 44%, respectively. It illustrates that our algorithm has better performance in suppressing nonlinear factors.

Experimental
For our research, we used a four-channel Raman imaging system built by our laboratory. The system is mainly composed of two sets of 2×2 lens arrays, one set of 2×2 bandpass filters—which are in different bands for a CCD camera (Dhyana95: Tucsen)—with 2048×2048 pixels, and a 532 nm laser with a power of 50 mW. Benzonitrile was used as an experimental material.
Results and Discussion
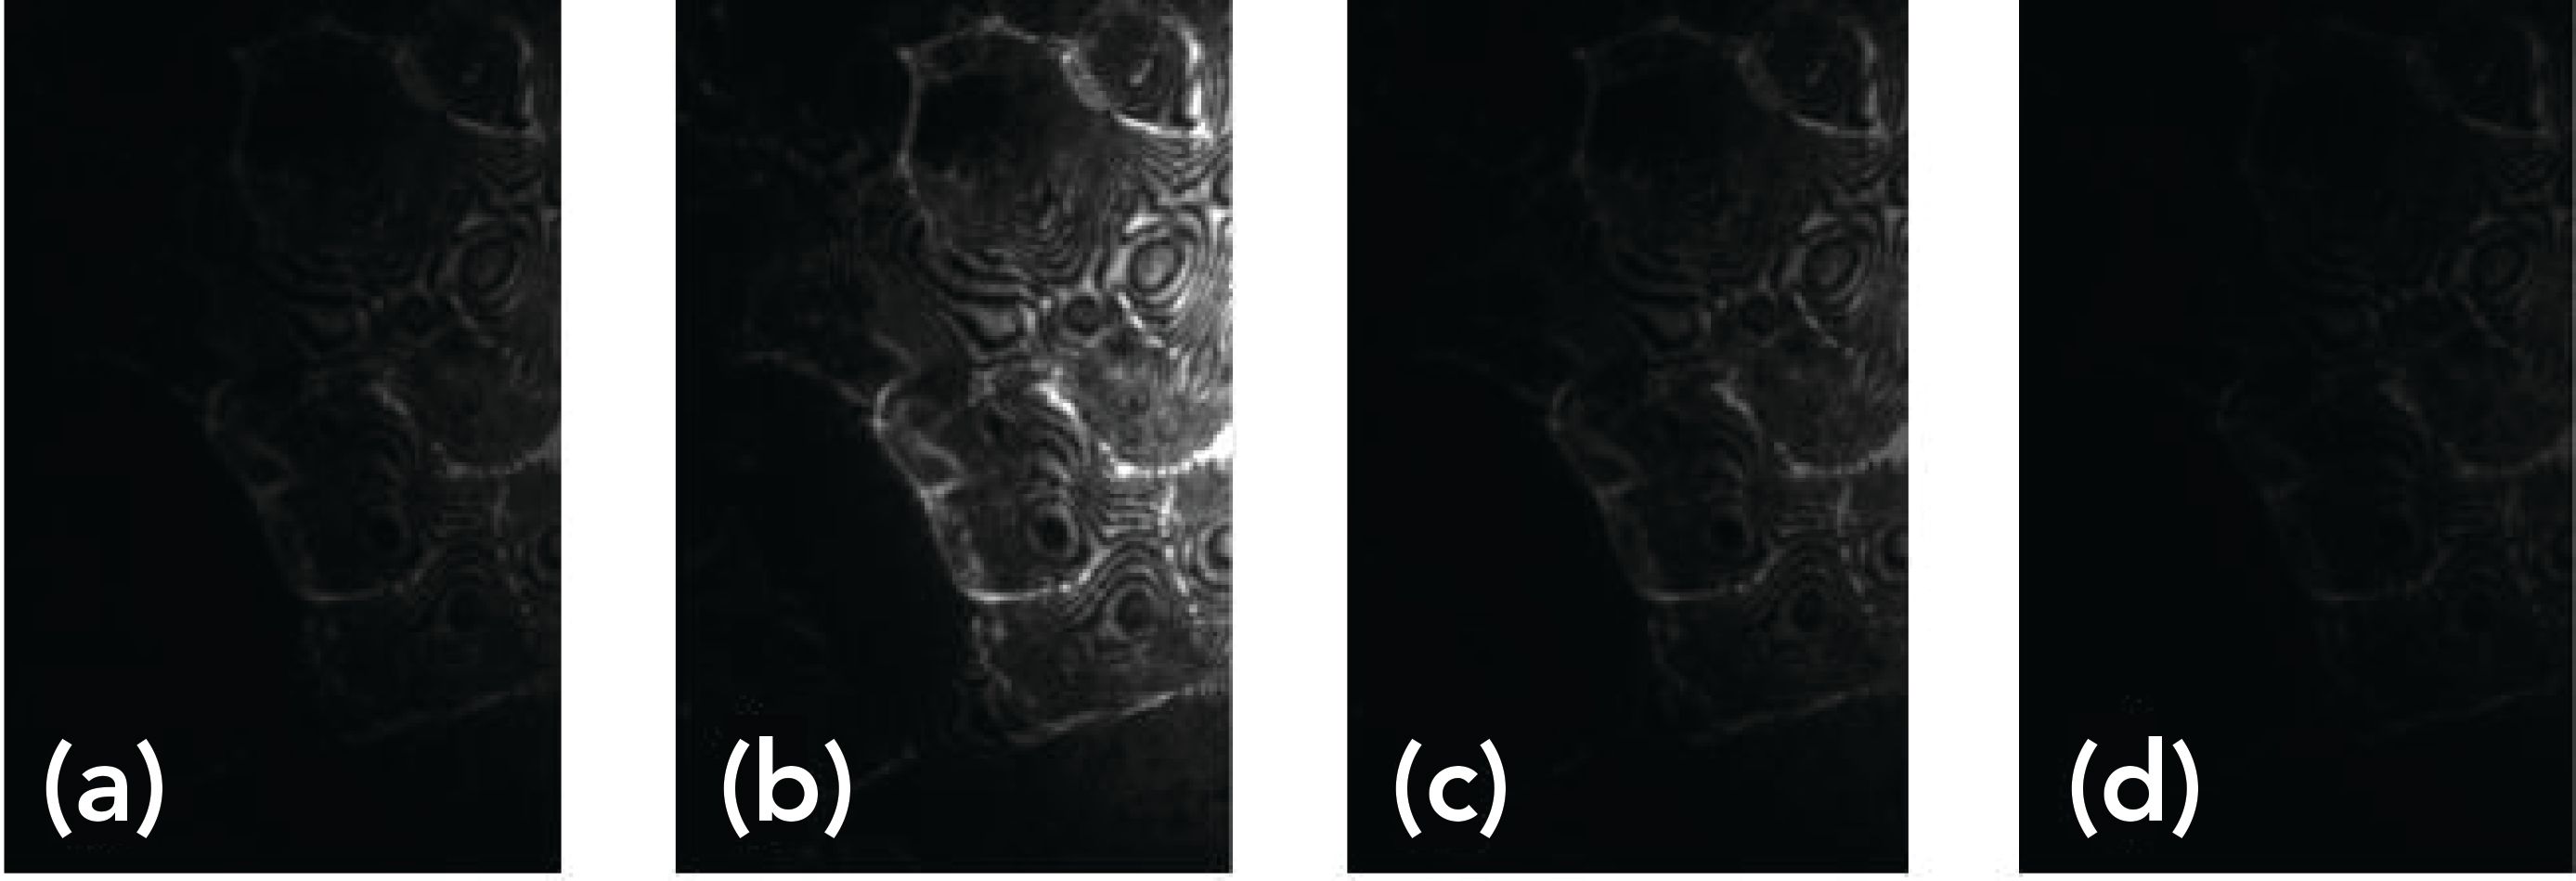
The narrow-band images of benzonitrile are simultaneously obtained based on the multichannel imaging system that is built by our laboratory, as shown in Figure 5. It can be clearly seen that the brightness of each narrow-band image is different and Figure 5b is the clearest because the peak of the benzonitrile Raman spectrum is mainly at a wavelength of ~560 nm. Because the sample is composed of solid particles and the particle density distribution is uneven, the narrow-band image exhibits bright and dark areas. Each pixel of the image represents a Raman spectrum; simultaneously, Raman imaging with different wavelengths can be obtained by accomplishing the complete reconstruction of Raman spectroscopy for each pixel. Therefore, the validity and accuracy of the reconstruction algorithm determines the quality of Raman imaging.
Figure 5: The multichannel narrow-band image of benzonitrile: (a) narrow-band image taken using filter 550 (10 nm); (b) narrow-band image taken using filter 560 (10 nm); (c) narrow-band image taken using filter 570 (10 nm); (d) narrow-band image taken using filter 580 (10 nm).
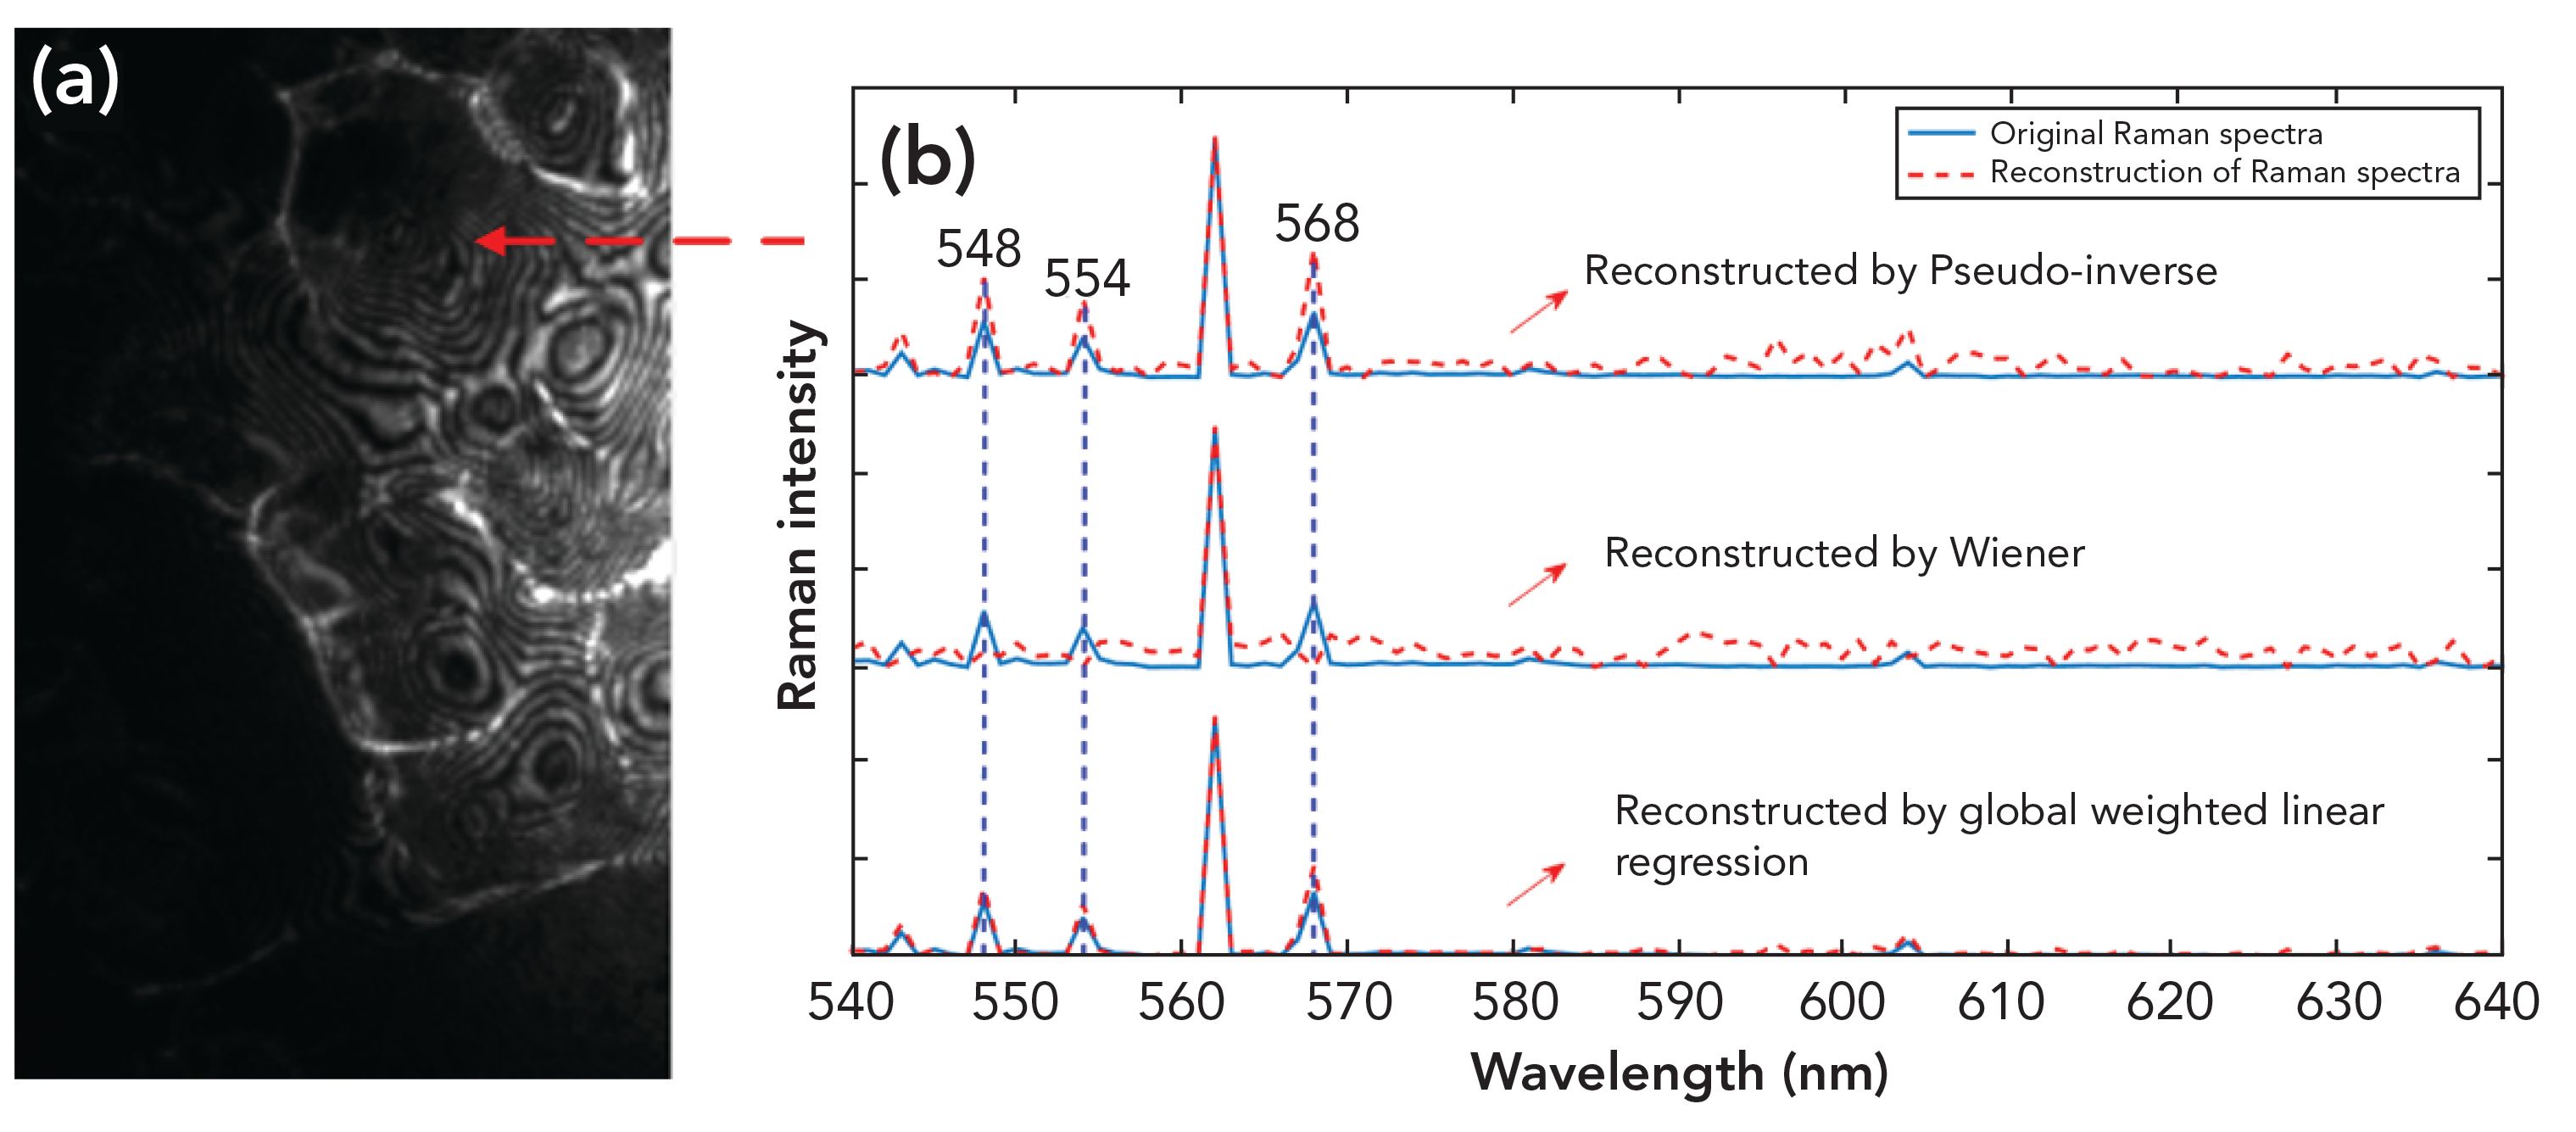
For the purpose of verifying the feasibility and accuracy of our algorithm, the four-channel narrow-band measurements u corresponding to one pixel in Figure 6a are taken to complete the reconstruction of Raman spectrum based on the global weighted linear regression, pseudo-inverse method, and Wiener estimation algorithm. Figure 6b shows that the peaks of the reconstructed spectrum based on pseudo-inverse appear to be higher than the actual spectrum at the wavelength of 548 nm, 554 nm, and 568 nm. Simultaneously, the peaks of the reconstructed spectrum based on Wiener estimation appear to be lost at the same positions. However, our algorithm does not have those problems, and shows a stronger anti-interference ability and better performance.
Figure 6: Reconstruction of Raman spectra in the experiment: (a) narrow-band image taken using filter 560 (10 nm); (b) reconstruction of Raman spectra in the experiment based on three algorithms.
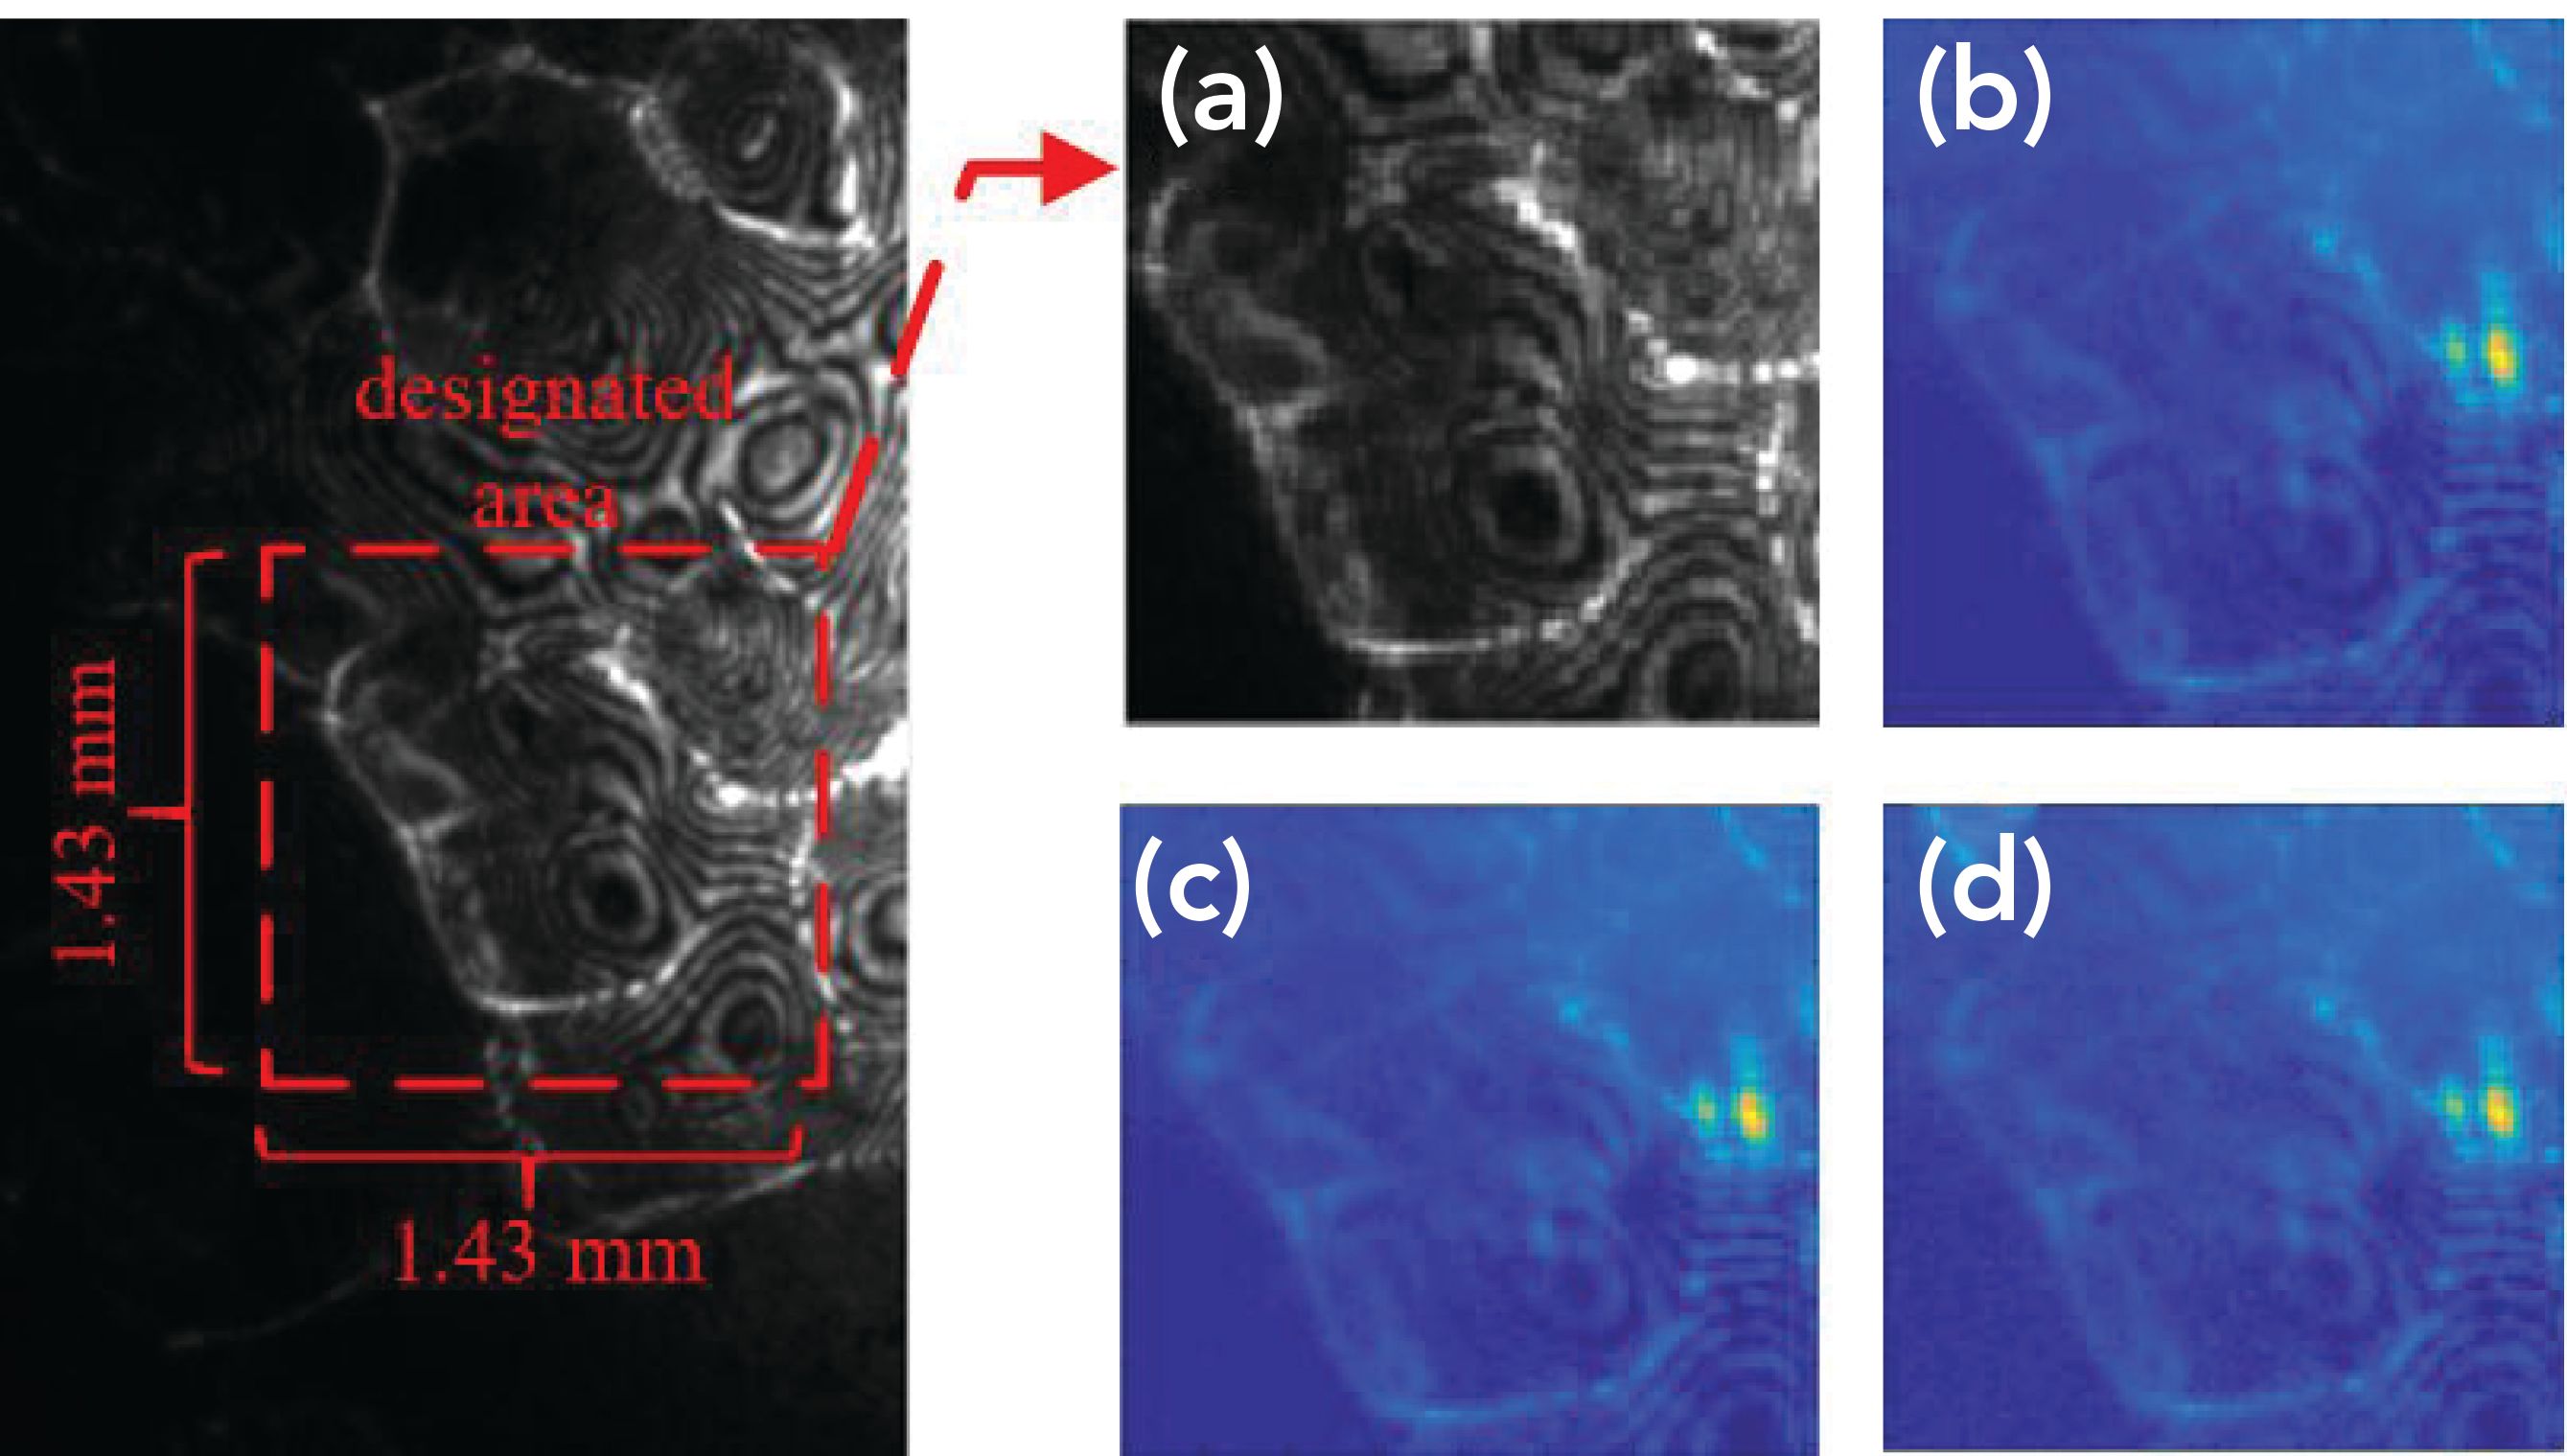
To verify the advantages of our algorithm for fast imaging, Raman imaging at wavelength 560 nm/10 nm has been reconstructed by pseudo-inverse, Wiener estimation, and our algorithm, as shown in Figures 7b, 7c, and 7d, respectively. Figure 7a represents the image area to be reconstructed, including 131×131 pixels. The overall variation in the Raman image obtained by the global weighted linear regression is averaged, and is most similar to the image to be reconstructed. Simultaneously, our algorithm reduces interference from the laser and the fluorescent background better than the other algorithms do, as seen in the results.
Figure 7: Reconstruction images of benzonitrile based on multichannel narrow-band measurements: (a) the area of Raman image to be reconstructed; (b) the reconstruction of Raman image based on pseudo-inverse; (c) the reconstruction of Raman image based on Wiener estimation; (d) the reconstruction of Raman image based on global weighted linear regression.
Simultaneously, the time required for reconstructed Raman imaging based on our algorithm is less than that of traditional imaging methods, such as point or line scanning imaging, as shown in Table II, providing a theoretical basis of studying the rapid changes in fast dynamic systems.

Conclusion
In this work, we developed a fast algorithm for the reconstruction of Raman spectra, based on global weighted linear regression from multichannel imaging measurements. This algorithm improves reconstruction accuracy by optimizing the training samples and making a global assignment weighted to the optimizing samples. According to the RMSE, the consistency between the reconstructed spectra and the original spectra is fine. Simultaneously, the Raman image reconstructed by the global weighted linear regression reduces interference from the laser and the fluorescent background better than pseudo-inverse and Wiener estimation. Therefore, the results of the study may promote the application of Raman imaging technology in fast dynamic systems and enhance researchers’ understanding of the dynamic processes.
Acknowledgment
The authors would like to acknowledge financial support from Natural Science Foundation of China (No.21874113, NO.21974118).
References
- Y.H. Ong, M. Lim, and Q. Liu, J. Opt. Express. 20(20), 22158–22171 (2012).
- Y. Li, J. Pan, G. Chen, C. Li, S. Lin, et al, J. Biomed. Opt. 18(2), 27–32 (2013).
- C. Krafft, G. Steiner, C. Beleites, et al., J. Biophotonics 2(1), 13–28 (2009).
- I. Nabiev, I. Chourpa, and M. Manfait, J. Raman Spectrosc. 25(1), 13–23 (1990).
- S. Schlucker, M.D. Schaeberle, S.W. Huffman, et al., Anal. Chem. 75(8), 4312–4318 (2003).
- N. Everall, Spectroscopy 19(11),16–24 (2004).
- D.R. Connah and J. Y. Hardeberg, J. SPIE 5667, 65–75 (2005).
- J.F.G. Poovathy and S. Radha. J. Wirel. Pers. Commun. 95(4), 4947–4966 (2017).
- S. Chen, Y.H.Ong, and Q. Liu, J. Raman Spectrosc. 44, 875–881 (2013).
- L. Costantini, E. Mammi, M. Teodori, et al., IET Netw. 6(5),125–132 (2017).
- T. Yanbin and X.R. Sheng, J. Comput. Appl. Software 28(9), 80–92 (2011).
- H. Yuan and Y.Y. Tang, IEEE Trans. Cybern. 47(4), 934–945 (2017).
- T.R.M. De Beer et al., Eur. J. Pharm. Sci. 30(3–4), 229–235 (2007).
- G. Leloup, P.E. Holvoet, et al., J. Oral Rehabil. 29(6), 510–515 (2002).
- T.R.M. De Beer et al., Anal. Chim. Acta 589(2), 192–199 (2007).
- X. Wang, F. Xian-Guang, X. Ying-Jie, et al., Spectrosc. Spect. Anal. 34(8), 2117–2121 (2014).
Xian-Guang Fan, Long Liu, Zhe-Ming Kang, Ying-Jie Zeng, Yu-Liang Zhi, and Xin Wang are with the Department of Instrumental and Electrical Engineering at Xiamen University, in Xiamen, Fujian, in the People’s Republic of China. Fan and Wang are also with the Xiamen Key Laboratory of Optoelectronic Transducer Technology at Fujian Key Laboratory of Universities and Colleges for Transducer Technology, in Xiamen, Fujian, China. Direct correspondence to:
xinwang@xmu.edu.cn

Geographical Traceability of Millet by Mid-Infrared Spectroscopy and Feature Extraction
February 13th 2025The study developed an effective mid-infrared spectroscopic identification model, combining principal component analysis (PCA) and support vector machine (SVM), to accurately determine the geographical origin of five types of millet with a recognition accuracy of up to 99.2% for the training set and 98.3% for the prediction set.
Authenticity Identification of Panax notoginseng by Terahertz Spectroscopy Combined with LS-SVM
In this article, it is explored whether THz-TDS combined with LS-SVM can be used to effectively identify the authenticity of Panax notoginseng, a traditional Chinese medicine.