Optimizing Productivity for Environmental Applications of ICP
Special Issues
Environmental applications of ICP and ICP-MS
Recent technological advances can improve profitability for environmental service laboratories. A programmable temperature spray chamber serves two purposes. First, by maintaining a stable temperature, a more consistent instrument response is achieved. Secondly, adjustment of the temperature can be used to control sample transport and thus have a pronounced effect on limits of detection. A discrete sample-introduction accessory can be combined with the programmable temperature spray chamber to reduce both carryover and the sample cycle time to lower the cost of analysis.
The analytical requirements for the measurement of trace metals in environmental applications are demanding. Whether using inductively coupled plasma–optical emission spectrometry (ICP-OES) or inductively coupled plasma–mass spectrometry (ICP-MS), the laboratory must demonstrate low detection limits, stability, accuracy, high precision, and low carryover. Because these analyses are typically carried out in commercial service laboratories, economics also plays a significant role, making metrics such as the number of samples run per hour important criteria. In this article, we will discuss components and parameters that facilitate and expedite the analysis of wastewater and drinking water for metals of environmental concern.
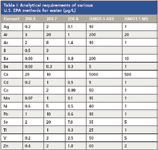
Table I: Analytical requirements of various U.S. EPA methods for water (μg/L)
Limits of Detection
Regulatory agencies in many countries specify maximum contaminant levels (MCL) that must be achieved in drinking waters. These agencies also specify instrument detection limits required to analyze samples. U.S. EPA Method 200.7 documents the criteria and instrumentation for analyzing water and waste by ICP-OES. More specifically, EPA Method 200.5 describes a method for analyzing drinking water by axially viewed ICP-OES. EPA Method 200.8 is an ICP-MS method for drinking water that also has been approved for use with wastewater. The latest statement of work (SOW) from the EPA Contract Laboratory Program, ISMO 1.1, which was written as a defensible method for the analysis of wastewater, lists higher limits of detection. Table I lists a sample of element detection limits from a number of these documents. Table I shows that in the case of drinking water by ICP-OES, the required detection limits are very demanding — and only certain ICP manufacturers claim instrument detection limits (IDLs) low enough to achieve them, although most are quite close. For wastewaters by ISMO 1.1, the levels are easily achievable with all axially viewed ICP systems. However, there is an advantage to using a radially viewed ICP system to perform these tests because radially viewed ICP is more robust, less prone to matrix interferences, and has greater linearity.

Table II: Experimental conditions for the data shown in Figure 2
Improving detection limits by as little as 50% can be very beneficial for axially viewed instruments to attain drinking water IDLs and for radially viewed instruments to achieve wastewater IDLs. It has been shown that spray chamber temperature has a proportional effect on transport efficiency (1). A programmable-temperature spray chamber capable of both heating and cooling has been described previously (2). Known as the IsoMist (Glass Expansion, Pocasset, Massachusetts), this device utilizes Peltier-effect heat exchange to achieve a range of –10 to +60 °C with a stability within 0.1 °C. It is often assumed that a standard sample uptake rate of 1–2 mL/min maximizes the degree of solvent loading in the plasma and that higher sample transport would lead to an unstable plasma. However, we conducted a study of 18 elements using the programmable-temperature spray chamber to control sample loading (Figure 1) and found that by increasing the temperature (and thus sample transport), significant gains in intensity were achieved without destabilizing the plasma. This work was performed on an Optima 2100 DV ICP-OES instrument (PerkinElmer, Shelton, Connecticut). Table II gives the experimental parameters and Figure 2 shows the spray chamber mounted onto the torch of the instrument. Figure 3 shows that the average intensity gain closely tracks the mass transport resulting in a 48% enhancement at 35 °C compared with results obtained at room temperature (20 °C). It also shows no increase in the suppression due to high matrix (1000 ppm Na and K and 500 ppm Ca) at higher temperature–transport. This is significant because axial ICP-OES can be extended to lower IDLs, which would make it capable of achieving the requirements for drinking water. Also, increased temperature can be used to lower the IDLs of radially viewed ICP-OES so that they can meet the requirements for wastewater analysis.
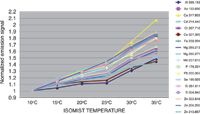
Figure 1: Effect of spray chamber temperature on individual element intensities.
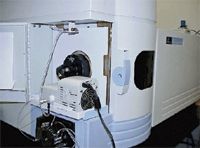
Figure 2: Programmable-temperature spray chamber mounted onto the ICP-OES instrument.
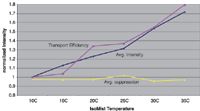
Figure 3: Effect of spray chamber temperature on average intensity, mass transport, and matrix suppression.
Stability
Because the accuracy of any relative analytical method depends (among other factors) upon the stability of the analytical instrument subsequent to standardization, anything that improves stability also improves accuracy. Therefore, the methods cited in this article all have requirements for stability in the form of a periodic calibration check. An initial calibration check run after standardization must be within 5% of the true value according to Method 200.7. Additional checks must be run at least every 10 samples. A check consists of two solutions, a standard and a blank. The standard must be within 10% of its nominal value for all elements to continue running samples. If it fails it can be repeated once, and if it still fails, the instrument must be restandardized and all of the initial checks must be rerun along with all of the samples run subsequent to the previous successful check. This is a very time-consuming and labor-intensive process, so it is imperative that failures do not occur. Table III lists the starting checks required after each standardization.
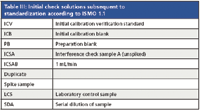
Table III: Initial check solutions subsequent to standardization according to ISMO 1.1
Although ICP-OES instruments are quite stable over the long term, they are susceptible to signal fluctuations due to changes in the temperature of the sample introduction system. In fact, Method 200.5 recommends waiting for 30 min after plasma ignition before beginning standardization to allow the instrument to reach thermal equilibrium. The manager of a large environmental service laboratory went further still, recommending a full 1-h wait and also warning never to open the door to the laboratory's kitchen area during a run for fear of temperature drift. Figure 4 compares the signal stability of a range of element lines over a long-term run both with and without temperature stabilization. While in both cases all elements stayed within the 10% allowance, the temperature-stabilized results were markedly more consistent. Both of these runs were performed in a laboratory with excellent temperature control. Because it takes only a few minutes for the programmable-temperature spray chamber's temperature to stabilize near ambient, there is no need to wait 30 or 60 min to begin standardization after the plasma has been initialized.
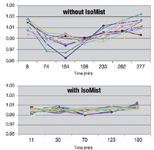
Figure 4: Comparison of intensity drift with and without spray chamber temperature control.
Carryover and Speed
The relationship between speed and productivity is obvious, but carryover is also tied to productivity due to the requirements of the methodology. For example, EPA Method 200.7 mandates that a blank be run following each calibration check and that the carryover not exceed the IDL. To ascertain that this criterion is attained, rinse times of 45–60 s are typical following each sample analysis. Recently, discrete sampling techniques have been described that dramatically reduce the required rinse time (3). One such device is the Niagara Plus sample-introduction accessory (Glass Expansion, Melbourne, Australia), which is shown in Figure 5. It consists of two components, a customized valve and a positive displacement pump. The valve was designed specifically for this application and incorporates several features that uniquely benefit this application as follows:
- Very low sweep volume to minimize carryover
- Rugged PEEK rotor to withstand nasty samples without degradation
- Replaceable stator seal assembly for improved maintenance
- Stackable two-way valves to accommodate multiple configurations
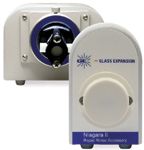
Figure 5: Photo of the sample introduction accessory (Niagara Plus). The valve assembly is on the right and the positive displacement pump is on the left.
The positive displacement pump is used to fill the sample loop reproducibly and quickly. Figure 6 is a schematic of the sample introduction accessory showing both the filling and injecting modes of operation. Table IV shows the typical time saving achieved using the accessory. Note that the rinse time on the instrument method could be set to zero because the sample loop is being rinsed during the uptake delay and autosampler movement. We tested this device for carryover on a PerkinElmer Elan 9000 ICP-MS system. The conditions are outlined in Table V, and the results are shown in Figure 7. For all elements, carryover was less than the IDL. In this case, not only was carryover minimized, but the analysis cycle was reduced by 62% (from 3.5 min to 80 s). For a commercial laboratory to increase its sample throughput by almost a factor of three without acquiring additional spectrometers is a huge economic gain. An additional economic benefit to the laboratory is the increased lifetime of consumables such as nebulizers, torches, and interface cones due to the decreased exposure to sample matrix.

Figure 6: Flow diagram for the sample introduction accessory. Left-hand diagram: filling sample loop and rinsing the nebulizer and spray chamber. Right-hand diagram: aspirating sample and rinsing the autosampler probe.
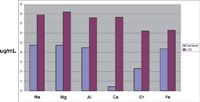
Figure 7: Results for carryover using the sample introduction accessory with ICP-MS immediately after running a 40-μg/mL standard.
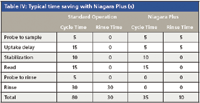
Table IV: Typical time saving with Niagara Plus (s)
Summary
The reliability of trace-metal measurements in environmental applications has improved significantly over the past decade due to both refinements in instrumentation and the propagation of well-defined methodology. In this article, we have focused on a number of ways to help commercial environmental laboratories increase efficiency and lower the cost of analysis. We believe that not only will these techniques become entrenched in environmental laboratories in the developed world, but they will also facilitate increased environmental assessment in the undeveloped and developing world.

Table V: Experimental conditions for the data in Figure 7
Jerry Dulude and Vesna Dolic are with Glass Expansion, Pocasset, Massachusetts.
References
(1) G. Zhu and R.F. Browner, J. Anal. At. Spectrosc. 3, 781–789 (1988).
(2) J. Dulude, Spectroscopy supplement, 24–29 (October 2007).
(3) P. Field, M. LaVigne, K.R. Murphy, G.M. Ruiz, and R.M. Sherrell, J. Anal. Atom. Spectrosc. 9, 1145–1151 (2007).

LIBS Illuminates the Hidden Health Risks of Indoor Welding and Soldering
April 23rd 2025A new dual-spectroscopy approach reveals real-time pollution threats in indoor workspaces. Chinese researchers have pioneered the use of laser-induced breakdown spectroscopy (LIBS) and aerosol mass spectrometry to uncover and monitor harmful heavy metal and dust emissions from soldering and welding in real-time. These complementary tools offer a fast, accurate means to evaluate air quality threats in industrial and indoor environments—where people spend most of their time.
NIR Spectroscopy Explored as Sustainable Approach to Detecting Bovine Mastitis
April 23rd 2025A new study published in Applied Food Research demonstrates that near-infrared spectroscopy (NIRS) can effectively detect subclinical bovine mastitis in milk, offering a fast, non-invasive method to guide targeted antibiotic treatment and support sustainable dairy practices.
Smarter Sensors, Cleaner Earth Using AI and IoT for Pollution Monitoring
April 22nd 2025A global research team has detailed how smart sensors, artificial intelligence (AI), machine learning, and Internet of Things (IoT) technologies are transforming the detection and management of environmental pollutants. Their comprehensive review highlights how spectroscopy and sensor networks are now key tools in real-time pollution tracking.