A Priori Performance Estimation of Spatial Filtering in Raman Backscattering Experiments
Spectroscopy
A straightforward numerical approach to estimate the performance of a spatial filter in Raman backscattering spectroscopy has been developed. This approach enabled the authors to determine an optimal hole diameter that balances spatial resolution and signal intensity.
Raman backscattering facilitates measurements in systems with limited optical access. In such experiments, spatial filtering is of paramount importance to collect signals only from a well-defined probe volume. In the present work, a straightforward numerical approach is presented to estimate the performance of a spatial filter in a given application. A systematic investigation is carried out for an experimental system using a metallic mirror with a hole acting as a spatial filter. In this configuration, a small hole results in poor spatial resolution but high signal intensity whereas a large hole yields good spatial resolution but low signal. It is shown that the approach allows the optimal hole diameter to be determined that offers a compromise between spatial resolution and signal intensity. Spatially filtered Raman backscattering measurements in a fed-batch stirred tank reactor are presented, where the conversion of citric acid is monitored.
During the last few decades, Raman spectroscopy has become an important diagnostic tool in many research areas, both in industry and academia. It offers the possibility for nonintrusive determination of the temperature and virtually all major species concentrations. Therefore, Raman applications can now be found in combustion and fuel research (1,2), monitoring of chemical and biotechnological reactors (3,4), arts and archaeology (5), and in the life sciences (6).
A common way to apply Raman spectroscopy is to detect the signal in the direction perpendicular to the laser beam. A benefit of this arrangement is the simple scattering geometry and the resulting well-defined measurement volume (the probe volume can be calculated by multiplying the dimension of the spectrometer slit with the inverse magnification of the signal collecting optical system). On the other hand, a disadvantage is that separate optical accesses for the laser beam and the signal collection are required. Many objects of interest, however, have limited optical access and, hence, there is a strong need for a keyhole technology. Raman backscattering is a potential solution to this problem.
The classical use of backward-scattered Raman photons is light detection and ranging (LIDAR) for environmental and atmospheric investigations (7,8), but it has also been applied, for example, to plasma and engine diagnostics (9–11). In principle, a LIDAR system consists of a transmitter (pulsed laser and optics) and a receiver (telescope, detector, and computer). Laser pulses of a few nanoseconds are sent into the object of investigation, such as the atmosphere. The backscattered photons are collected by the telescope and are eventually analyzed. The delay time between the start of the laser pulse and the signal detection defines the location of the measurement; the pulse duration determines the spatial resolution. A review as well as a detailed description is given by Weitcamp (12). However, Raman LIDAR requires a pulsed laser source and precisely controlled signal detection timing. Moreover, the study of small objects, in which a spatial resolution of the order of millimeters or centimeters is needed, calls for ultrashort short laser pulses (for example, picoseconds). On the one hand, the shorter the pulse the better the spatial resolution. On the other hand, the shorter the pulse the worse the spectral resolution. Consequently, the applicability of Raman LIDAR is limited.
Spatially filtered Raman backscattering spectroscopy is an alternative. Its main application is confocal Raman microscopy, in which a pinhole is placed at the confocal plane of the collecting lens to eliminate out-of-focus light (13). A disadvantage, however, is that supplementary optical components are necessary to ensure sufficient spatial filtering; otherwise, scattered light from the complete laser beam pathway is collected and falsifies the results. A second approach to spatially filtered Raman backscattering was introduced by Hug (14), which enables measurements without additional optics in the setup. It uses a pierced metallic mirror that reflects the signal toward the spectrometer and undertakes the task of spatial filtering at the same time. Physically speaking, the arrangement acts as a high-pass filter, which is known in the field of microscopy as the dark field method. A detailed theoretical description was given by Lauterborn and Kurz (15).
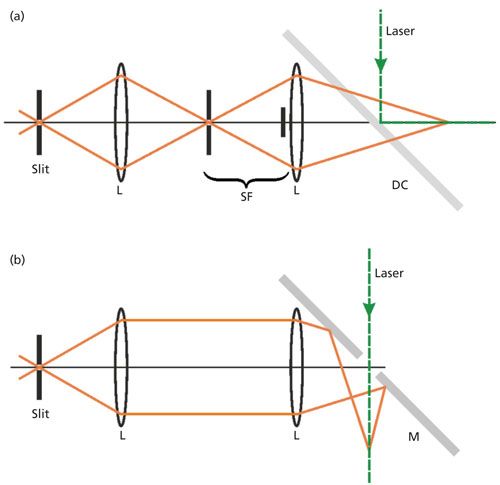
In both the pinhole and the pierced mirror backscattering arrangement (see Figure 1 for a schematic comparison), it is difficult to estimate the performance of the spatial filter a priori. To overcome this problem, we present a straightforward numerical approach for the determination of the probe volume length. It uses only common geometrical optics and trigonometric equations. The method is used to investigate the effect of the hole diameter in the metallic mirror on the performance of the spatial filter. Thereafter, experimental results from Raman backscattering measurements in a fed-batch stirred tank reactor are presented as a potential application.
Figure 1: Schematic setup of the detection system for (a) the conventional Raman backscattering with a dichroic mirror and (b) the modified approach using a pierced metallic mirror. L = lens, SF = spatial filter, DC =dichroic mirror, and M = metallic mirror.
Method
In the classical backscattering setup (Figure 1a), the laser beam is reflected by a dichroic mirror (DC) while the backward-scattered light is transmitted. A spatial filter (SF) ensures that only photons from the area of interest can reach the spectrometer. Figure 1b shows the modified setup, including the mirror with a hole acting as spatial filter. The incident laser beam passes the hole and backscattered light is reflected at an angle of 45° towards the detection system. The determination of the measurement volume using a backscattering setup, however, is not straightforward.
A possible experimental approach would be to introduce a thin target (for example, a glass plate or plastic foil) and move it along the laser beam while recording the scattered light as a function of the target position. A drawback of this method is that the setup has to be built first and may have to be modified should the experiment show that the measurement volume does not meet the specifications. Therefore, the a priori estimation of the length of the probe volume is desirable.
The proposed method for estimating the probe volume length is based on a numerical approach that uses only geometrical optics equations for lenses (see, for example, Hecht [16]) and trigonometric relations. Figure 2 shows the simplified arrangement of optical components. The hole is indicated at position A. Since it was drilled at 45° in the experimental part of this work, the assumption of a circular shape in the model is justified. At position B, a lens is placed for collecting and collimating the signal. The distance xB from the x = 0 coordinate is exactly the focal length of the lens. A second lens (position C) focuses the collimated signal to the slit (position D). The distance between C and D is the focal length of the second lens. Note that there is a substantial difference between the setups in Figures 1a and 1b. In the setup shown in Figure 1a, the spatial filter consists of a plate that blocks part of the signal and a hole that transmits that part of the signal which is to be detected. This means that the bigger the hole, the worse the spatial resolution, but the higher the signal intensity. On the other hand, the hole in the mirror of setup Figure 1b acts as the opposite (basically as the plate in the setup shown in Figure 1a) since the transmitted signal will not reach the detector. Consequently, the bigger the hole, the worse the signal intensity but the better the spatial resolution.
Figure 2: Schematic of the simplified backscattering model (setup in Figure 1b) used for the numerical determination of the probe volume. Note that the redirection of the signal at the mirror surface is neglected because it does not play a role from a geometric optics point of view.
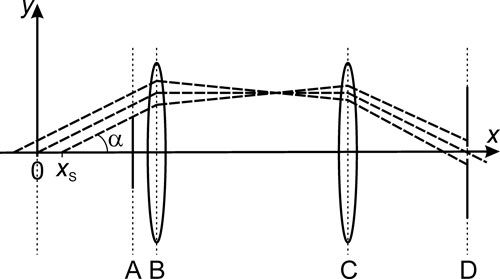
For the calculation, only photons emitted from the optical axis were considered, which is reasonable when only the length of the probe volume is of interest. However, it should be noted that the concept can easily be extended to three dimensions (3D). In Figure 2, three signal pathways are drawn starting at different positions xS at the same angle α to the optical axis (x-axis). The y-value at the positions A–D can be computed as a function of xS and α using the equation for thin lenses:

[1]
where s is the object distance, s′ is the image distance, and f is the focal length. From this equation, the incoming and outgoing beam of a thin lens have the relationship:

[2]
where α and β are the incident and emergent angles, respectively; y is the distance from the optical axis; and f is the focal length. Using the distance of the hole from the ordinate, xA, the distance between the two lenses l and the focal lengths of the collimating and the focusing lenses, f1 and f2, respectively, yields a simple set of equations:

[3]

[4]


To estimate the probe volume length from this set of equations, the starting position xS is varied in small steps over a certain distance, and at every point xS beams with systematically varied angle α are considered. For example, xS can be varied from -20 to 20 mm in steps of 0.1 mm and for every step, the angle α can be varied from 0 to 90° in steps of 0.01°. For each individual pair of xS and α, the y-values according to equations 3–6 are calculated. The geometric dimensions of the optical components are then used as boundary conditions to decide whether a beam emitted at xS and α actually reaches the detector. For instance, if a signal photon has the y-value yC = 30 mm while the lens radius is only 25 mm, the signal photon will not reach the spectrometer, and therefore it is not counted. Counting the detected signal photons as a function of xS yields an estimate of the probe volume shape along the optical axis.
Results
A systematic investigation was carried out using the method described above. For this purpose, the focal lengths of the lenses were set as f1 = 100 mm and f2 = 200 mm. The lenses had diameters of 25 mm each and the distance between them was l = 300 mm. The slit had a width of 0.1 mm, and the hole was placed at xA = 70 mm. The starting position xS was varied between -20 and 20 mm, and the angle α was varied between 0 and 20° in steps of 0.002°. Angles larger than 20° were not considered to save computational time. The corresponding beams would have missed the first lens anyway.
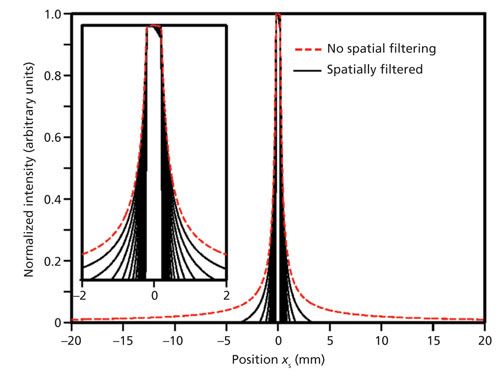
Figure 3 displays the normalized intensity distributions for systematically varied hole diameter. Intensity means the number of detected photons for each position along the x-axis. The individual profiles were normalized by dividing them by their maximum value to improve the comparability. The dashed line in Figure 3 represents the case without a spatial filter, that is, a hole diameter of zero. It can be clearly seen that this case results in signal being collected for each position along the considered line. In other words, the spatial resolution is poor because the signal reaching the detector comes from a wide region. The solid lines in Figure 3 are the profiles for different nonzero hole diameters. The values were varied between 1 and 15 mm in steps of 1 mm. A diameter less than 1 mm is not useful because the laser beam needs to be able to pass through this hole in an experiment. The solid line profiles show that the region from which the signal can reach the detector becomes well-defined and finite whenever the spatial filter is present. The range of x-values with a signal decreases with increasing hole diameter.
Figure 3: Normalized intensity as function of x-coordinate. The dashed line indicates the case without spatial filtering. The solid lines represent profiles for which the hole diameter was varied systematically. The signals are normalized with respect to their maximum value. The inset shows the enlarged range from -2 to +2 mm.
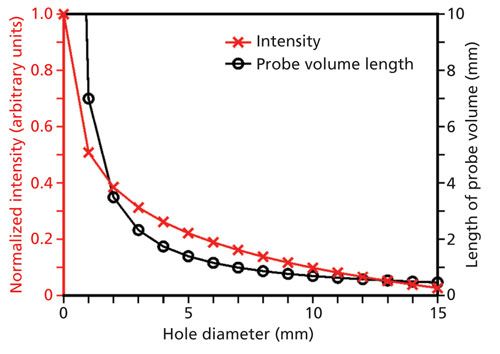
To visualize the effects more clearly, Figure 4 illustrates the intensity and the probe volume length as function of the hole diameter. For the intensity, the profiles in Figure 3 have been integrated without initial normalization. The probe volume length was determined as the difference between the two xS values limiting the range of signal collection. The most significant signal intensity drop is between a hole diameter of 0 and 1 mm as we move from signal collection without spatial filtering to the filtered scenario. The same observation is made for the probe volume length. Increasing the hole diameter further reduces the intensity and length, but rather moderately. This indicates that in the considered setup, a hole diameter of a few millimeters is sufficient to reduce the probe volume to a few millimeters and maintain reasonable signal levels. A hole diameter of about 5 mm also seems best suited from an experimental point of view because it can align the laser beam through the hole without producing a lot of elastic scattering from the surfaces.
Figure 4: Intensity and probe volume length as function of the hole diameter. All intensity values are normalized with respect to the case of diameter zero.
Experimental Application
For an experimental demonstration, a mirror with a 5 mm hole was prepared. The mirror used was a simple cosmetic mirror and the hole was drilled through it at an angle of 45°. The setup was the same as the one in Figure 1b. A 532-nm continuous wave laser was used as the light source. The signal was collected and focused on the slit by achromatic lenses. Using the numerical a priori approach, a probe volume length of 2.4 mm was determined. Details of the Raman equipment used can be found in a previous paper (17).
The experiments were performed inside a stirred tank reactor, where the fed-batch conversion of citric acid with sodium hydroxide was monitored. The reactor had walls made from Perspex (acrylic sheet) so that the Raman measurement could be carried out directly through the wall. With the spatial filtering technique described beforehand, it was possible to precisely locate the measurement volume inside the vessel. This is an advantage compared to commercial fiber-based Raman probes. Such probes usually collect the Raman signal that is generated at distances of a few millimeters from the collecting lens. Hence, the probe needs to be immersed into the reacting fluid and the method can no longer be considered nonintrusive.
The reactor was filled with 1 L of citric acid solution (0.5 mole/L), and a continuous flow of sodium hydroxide solution (0.67 mL/s) was added while stirring the mixture. Raman spectra were recorded every 5 s for a period of 1800 s. The spectra obtained as a function of time are displayed in Figure 5a. The broad band between 3000 and 4000 cm-1 is attributed to the OH stretching vibrations of water and remains almost constant. On the other hand, systematic changes over reaction time are clearly visible around 3000 cm-1 and around 1700 cm-1, see Figure 5b. This behavior is partly surprising. Upon the addition of sodium hydroxide, the carboxylic acid groups in citric acid are deprotonated one after the other. This explains the change in the 1710 cm-1 band, which is assigned to C=O double bond vibrations (18). In the deprotonated carboxylate groups, the net negative charge is delocalized in the O-C-O moiety and, thus, a classical C=O double bond is absent. As a consequence, the C=O peak decreases when sodium hydroxide is added.
Figure 5: Raman spectra from the fed-batch stirred tank reactor (BSTR) over a period of 1800 s. (a) Overall changes of the spectra as a function of time. (b) Details of the predominantly changing spectral bands. The inset shows the intensity changes with time of the peaks at 1710 and 2950 cm-1.
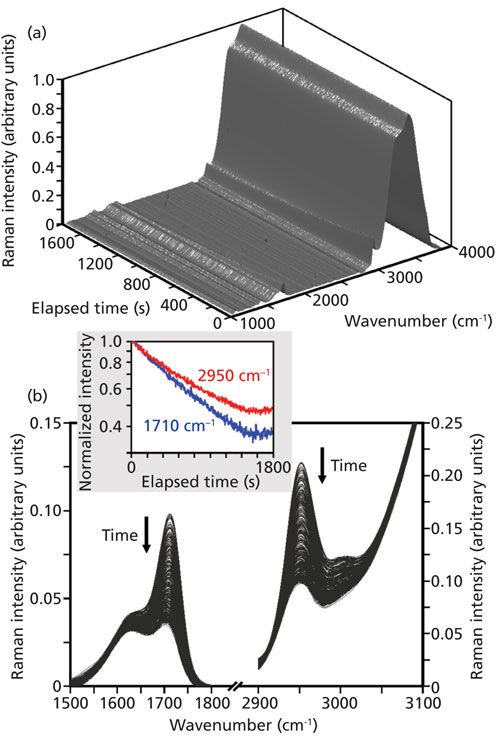
The peak at 2950 cm-1 results from CH stretching vibrations. The two CH2 groups in citric acid are not involved in the chemical reaction. Hence, the significant change in the Raman band is unexpected. A possible explanation may be that the charge distribution changes across the entire molecule when the carboxylic acid groups are deprotonated. The redistributed charge may affect the polarizability of the CH bonds and thus reduce the Raman activity. This would explain the observed behavior. The detailed analysis of this phenomenon, however, is not the scope of the present work.
The inset in Figure 5b illustrates the intensity changes of the 1710 and 2950 cm-1 peaks as a function of reaction time. It can be seen that the curves are qualitatively almost identical-initially a rather straight line until the final constant value is reached after ~1500 s. Note that the intensity axis is logarithmic. This means the signal intensity initially decreases exponentially. After the entire reactant is converted, the signal intensity remains constant.
Conclusion
In conclusion, a straightforward numerical approach to estimate the performance of a spatial filter in Raman backscattering spectroscopy has been proposed. A systematic investigation was carried out for an experimental system using a metallic mirror with a hole acting as the spatial filter. The hole diameter was varied systematically to unravel its influence on the performance of the system. A small hole results in poor spatial resolution but high signal intensity whereas a large hole yields good spatial resolution but low signal. It was shown that the approach allows for determining the optimal hole diameter that offers a compromise between spatial resolution and signal intensity. Eventually, spatially filtered Raman backscattering measurements in a batch stirred tank reactor were presented. The chemical conversion of citric acid with sodium hydroxide was monitored via the Raman spectra recorded from a probe volume with a length of ~2.4 mm, which was located in the 1-L reactor volume.
Acknowledgment
The authors thank Professor Frank Beyrau and Professor Thomas Seeger for their helpful discussions. They also gratefully acknowledge financial support for part of this work from Deutsche Forschungsgemeinschaft (DFG, Grant KI1396/4-1).
References
- A.C. Eckbreth, Laser Diagnostics for Combustion Temperature and Species, 2nd Edition (Gordon and Breach Science Publishers SA, The Netherlands, 1996).
- J. Kiefer, Energies8, 3165–3197 (2015).
- L.R. Knopke, N. Nemati, A. Kockritz, A. Bruckner, and U. Bentrup, ChemCatChem2, 273–280 (2010).
- K. Noack, B. Eskofier, J. Kiefer, C. Dilk, G. Bilow, M. Schirmer, R. Buchholz, and A. Leipertz, Analyst138, 5639–5646 (2013).
- P. Vandenabeele, H.G.M. Edwards, and L. Moens, Chem. Rev.107, 675–686 (2007).
- R. Petry, M. Schmitt, and J. Popp, ChemPhysChem4, 14–30 (2003).
- F.E. Hoge and R.N. Swift, Appl. Opt.20, 3197–3205 (1981).
- G. Larchevêque, I. Balin, R. Nessler, P. Quaglia, V. Simeonov, H. Van Den Bergh, and B. Calpini, Appl. Opt.41, 2781–2790 (2002).
- Y. Ping, I. Geltner, and S. Suckewer, Phys. Rev. E67, 016401 (2003).
- G. Grünefeld, V. Beushausen, P. Andresen, and W. Hentschel, “A major origin of cyclic conversion variations in SI engines: cycle-by-cycle variations of the equivalence ratio and the residual gas of the initial charge,” presented at the SAE Fuels & Lubricants Meeting & Exposition, Baltimore, Maryland, 1994.
- J. Egermann, “Einsatz der linearen Raman-Streuung zur Analyse der Gemischbildung direkteinspritzender Ottomotoren,” Dissertation (Erlangen University, Erlangen, 2004).
- C. Weitcamp, Lidar: Range-Resolved Optical Remote Sensing of the Atmosphere (Springer, Berlin, 2005).
- N. Everall, Appl. Spectrosc. 63, 245A–262A (2009).
- W. Hug, in Raman Spectroscopy: Linear and Nonlinear, J. Lascombe and P.V. Huong, Eds. (Wiley Heyden, Chichester, 1982), pp. 3–12.
- W. Lauterborn and T. Kurz, Coherent Optics, 2nd Edition (Springer, Berlin, 2003).
- E. Hecht, Optik, 3. Auflage ed. (Oldenbourg Verlag, München Wien, 2001).
- H.C. Struthers, F.M. Zehentbauer, E. Ono-Sorhue, and J. Kiefer, Ind. Eng. Chem. Res.50, 12824–12830 (2011).
- N.R. Dhumal, M.P. Singh, J.A. Anderson, J. Kiefer, and H.J. Kim, J. Phys. Chem. C120, 3295–3304 (2016).
Johannes Kiefer is with Technische Thermodynamik at the Universität Bremen in Bremen, Germany, the School of Engineering at the University of Aberdeen in the United Kingdom, and the Erlangen Graduate School of Advanced Optical Technologies at the Universität Erlangen-Nürnberg in Erlangen, Germany. Julia Rüger is with the School of Engineering at the University of Aberdeen. Florian M. Zehentbauer is with the Technische Thermodynamik, at the Universität Bremen. Direct correspondence to: jkiefer@uni-bremen.de

AI-Powered SERS Spectroscopy Breakthrough Boosts Safety of Medicinal Food Products
April 16th 2025A new deep learning-enhanced spectroscopic platform—SERSome—developed by researchers in China and Finland, identifies medicinal and edible homologs (MEHs) with 98% accuracy. This innovation could revolutionize safety and quality control in the growing MEH market.
New Raman Spectroscopy Method Enhances Real-Time Monitoring Across Fermentation Processes
April 15th 2025Researchers at Delft University of Technology have developed a novel method using single compound spectra to enhance the transferability and accuracy of Raman spectroscopy models for real-time fermentation monitoring.
Nanometer-Scale Studies Using Tip Enhanced Raman Spectroscopy
February 8th 2013Volker Deckert, the winner of the 2013 Charles Mann Award, is advancing the use of tip enhanced Raman spectroscopy (TERS) to push the lateral resolution of vibrational spectroscopy well below the Abbe limit, to achieve single-molecule sensitivity. Because the tip can be moved with sub-nanometer precision, structural information with unmatched spatial resolution can be achieved without the need of specific labels.