The Qualitative Analysis of Evolved Gases in Thermogravimetry by Gas Chromatography Mass Spectrometry
Thermogravimetric analysis (TGA) measures the change in the weight of a sample as a function of temperature.
Greg Johnson, PerkinElmer, Inc.
Thermogravimetric analysis (TGA) measures the change in the weight of a sample as a function of temperature. A limitation of TGA is that it cannot identify what material is lost at a specific temperature. The analysis of gases evolved during a TGA experiment by gas chromatography mass spectrometry (GC–MS) provides laboratories with a way to identify the compound or groups of compounds evolved during a specific weight loss event in a TGA analysis.
This note discusses the utility of TG-GC–MS with an example application, identification of specific organic acids evolved during TGA analysis of switchgrass.
Switchgrass is a perennial warm-season grass native to the northern states of the USA; it is easily grown in difficult soils. Switchgrass is potentially useful in the production of biofuels, specifically cellulosic ethanol and bio-oil.
Experimental
The instrumentation used in this study was a PerkinElmer® Pyris™ 1 TGA interfaced to the PerkinElmer Clarus® 600 GC–MS with the S-Swafer™ micro-channel flow device. The TGA maintains the atmosphere around the sample at ambient atmospheric pressure, thus it is necessary to collect from the TGA by allowing the high vacuum of the MS to create a pressure drop across the GC column, causing a flow of gas from the TGA through the transfer line and the analytical column to the MS. A deactivated fused-silica transfer line (1.6 m × 0.32 mm i.d.) connected the TG and the GC. A 30 m × 0.32 mm Elite WAX analytical column was employed for separation. The S-Swafer device is used to rapidly switch between backflushing of the TGA transfer line during non-sampling time and sampling of the TGA environment during analysis.
A small quantity of dried and ground switchgrass was placed on the TGA pan and weighed using Pyris software. A rapid TGA analysis based on heating the sample from 30 °C to 1000 °C at 100 °C/min in a nitrogen atmosphere was performed to determine which regions of the weight-loss curve were to be further studied using the TGA-GC–MS technique.
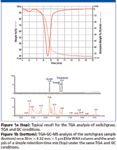
A typical TGA weight-loss curve for the switchgrass is shown in Figure 1a; superimposed on the weight loss curve is the derivative of this curve which greatly assists the analyst in setting up the GC timed events that will be used to sample the evolved gases onto the GC–MS column. Note that the TGA is held isothermal for the first 5.0 min at which point heating begins.

Figure 1
The major transition in the TGA analysis produced large numbers of oxygenated volatile organic compounds (VOCs). The three peaks at 15.84, 16.69, and 16.86 min in Figure 1b were library searched based on their MS spectra as a homologous series of free fatty acids. Following the spectral identification, a mixture of reference material was diluted in water and a 5 μL aliquot of this aqueous solution deposited by syringe onto the TGA pan for analysis. The analysis of this mixture confirmed the library identification.
Conclusions
In this note, we describe the technique of TG-GC–MS through the analysis of switchgrass. TG-GC–MS is demonstrated to be a valuable technique in the separation and identification of complex mixtures of gas evolved during a TG analysis. The S-Swafer device is demonstrated as a means to interface a TGA to GC–MS. The main benefits are its simplicity and the inertness of the entire sample path.

PerkinElmer, Inc.
940 Winter Street, Waltham, MA 02451
tel. (800)762-4000, (203)925-4602; fax (203)944-4904
Website: www.perkinelmer.com

Thermo Fisher Scientists Highlight the Latest Advances in Process Monitoring with Raman Spectroscopy
April 1st 2025In this exclusive Spectroscopy interview, John Richmond and Tom Dearing of Thermo Fisher Scientific discuss the company’s Raman technology and the latest trends for process monitoring across various applications.
A Seamless Trace Elemental Analysis Prescription for Quality Pharmaceuticals
March 31st 2025Quality assurance and quality control (QA/QC) are essential in pharmaceutical manufacturing to ensure compliance with standards like United States Pharmacopoeia <232> and ICH Q3D, as well as FDA regulations. Reliable and user-friendly testing solutions help QA/QC labs deliver precise trace elemental analyses while meeting throughput demands and data security requirements.