Raman Spectra Used to Understand the Origins of Banding in Spherulites
The formation of spherulites in polymers is a well-known phenomenon; when the polymer is crystallized by cooling from the melt, crystal lamellae grow out from a nucleation site in a spherical pattern. If the material is annealed on a planar surface, and viewed between crossed polarizers in a microscope, a Maltese cross with a banding pattern is observed. Where the crystals grow in a direction not parallel to the polarizers, the sample lights up. Often banding of the lit regions is observed, and is believed to be due to rotations of the crystal lamellae around the growth direction. Because it is well known that polarized Raman spectra respond to crystal orientation, we thought it would be interesting to try to document the relationship between the banding behavior and Raman polarization/orientation behavior. In this column I will show results of such an investigation of spherulites of poly(hydroxybutyate-co-hydroxyhexanoate) (PHBHx) with varying composition.
Those of you who follow my column know that PHBHx has been my “favorite” polymer over the last few years, as PET (polyethylene terephthalate) was for many years previously. PHBHx was developed over the last decade or so by Professor Isao Noda who had been working at Procter & Gamble. The polymer is now being produced commercially by Danimer Scientific, Inc. under the trademarked name Nodax. Nodax is produced by fermentation and is degraded by micro-organisms, so there are great hopes that it can be manufactured to replace petroleum-derived polymers that have extremely long lifetimes in the environment. However, like all polymers, its properties must be controlled to make it useful. In the case of polymers, that means to control, among other things, the crystallinity, which, when high, makes the polymer brittle and opaque. Propyl groups of the hydroxyhexanoate comonomer unit (Hx) are added as side-chains to disrupt the crystallinity. My studies are designed to follow crystallization conditions in order to understand how to engineer the properties of the material.
Material Preparation
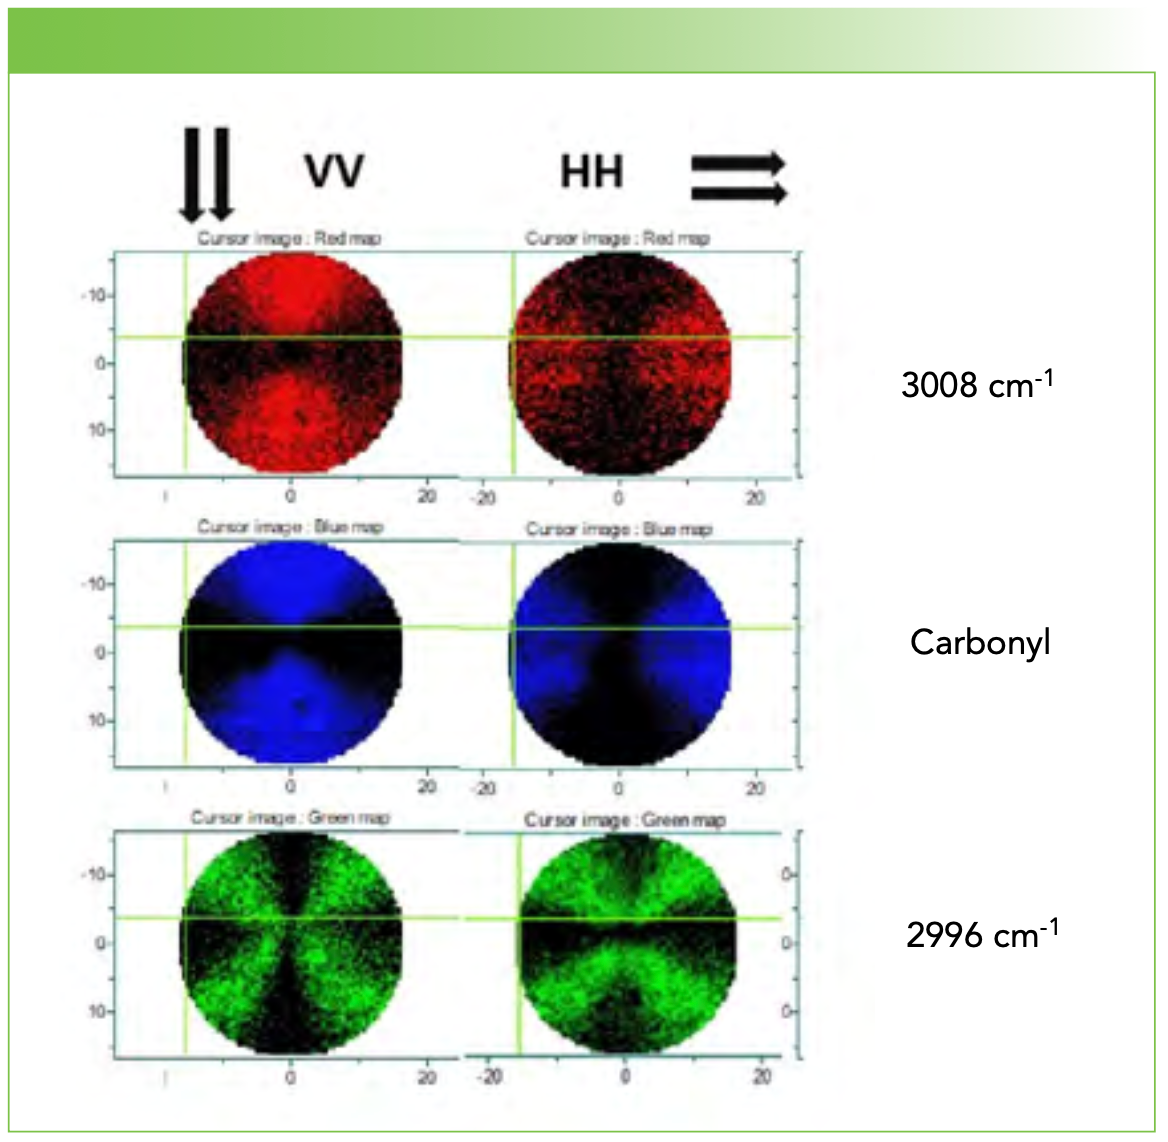
Small amounts of polymer with 0, 3.9, and 13% Hx were dissolved in chloroform and then placed on stainless steel slides. After the chloroform dried, the film was melted on a hot plate and then deposited in an oven at about 70 °C for 24 h to anneal. The films were examined first at 10x and then higher magnification using crossed polarizers in reflected light. For each sample, a spherulite of diameter at least 25 µm was identified and used for study. Figure 1 shows the Maltese cross images of the three spherulites used in this report. In this column we will show vertical (V) line profiles through the center of the spherulite using two possible polarization conditions: VV and HV. Over the summer we also collected full maps of some spherulites to document that the Raman spectra do reflect the crystallite orientation in the spherulite. Figure 2 shows the VV and HH polarized Raman maps for the 0% material for the carbonyl band and the two anomalous bands of the methyl group that appear at unusually high frequency, presumably due to interactions with the carbonyl on the opposite chain in the unit cell (1).
FIGURE 1: Crossed polarizer images of spherulites of PHBHx used for the Raman polarization measurements along a vertical line profile through the middle of the spherulite. From left to right the hydroxyhexanoate composition was (a) 0, (b) 3.9, and (c) 13 %. X- and Y-axes labels are spatial coordinates in μm.

FIGURE 2: Raman maps of a pure PHB spherulite (0% Hx) imaged at the (middle, blue) carbonyl line and the (top, red) two high frequency methyl CH lines that (bottom, green) have been associated with an interaction with the carbonyl oxygen atom. X- and Y-axes labels are spatial coordinates in μm.

Results
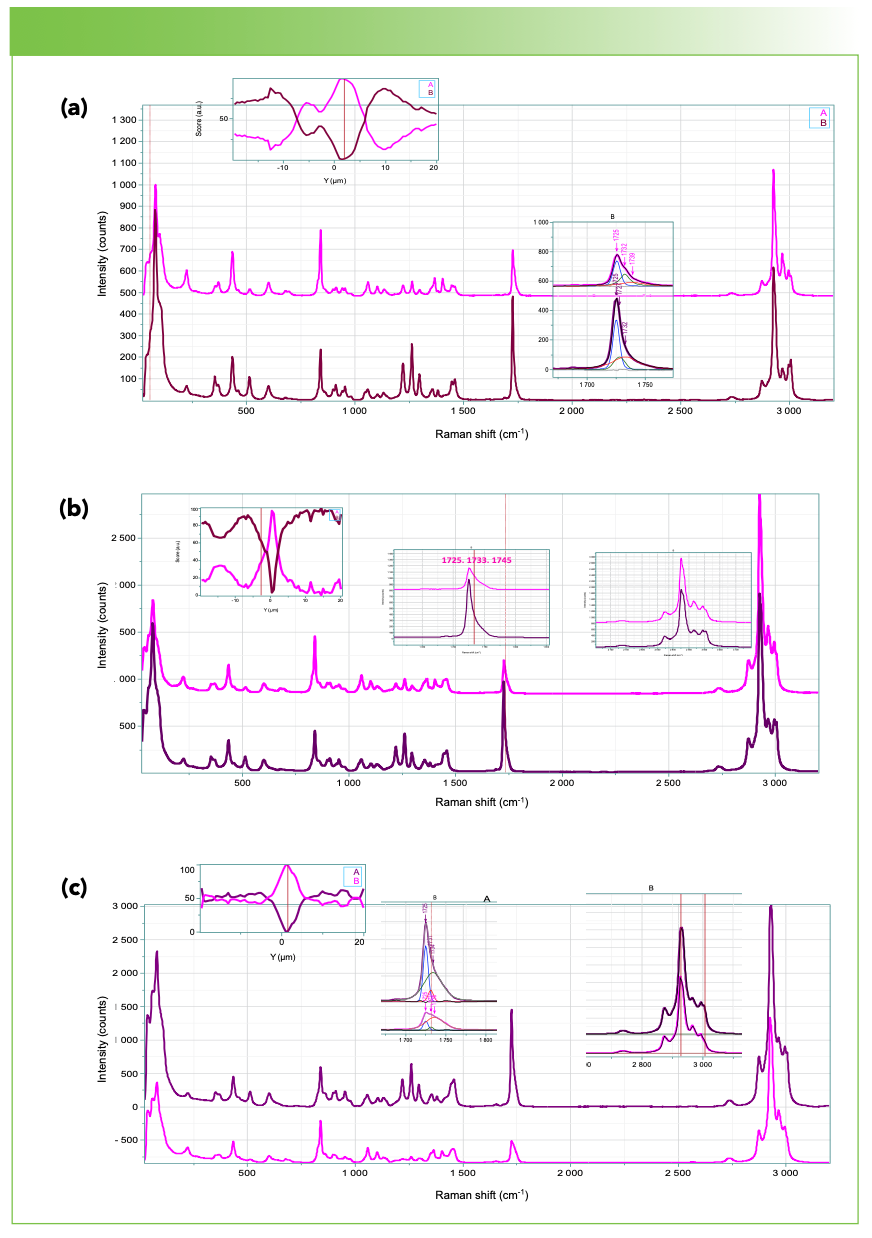
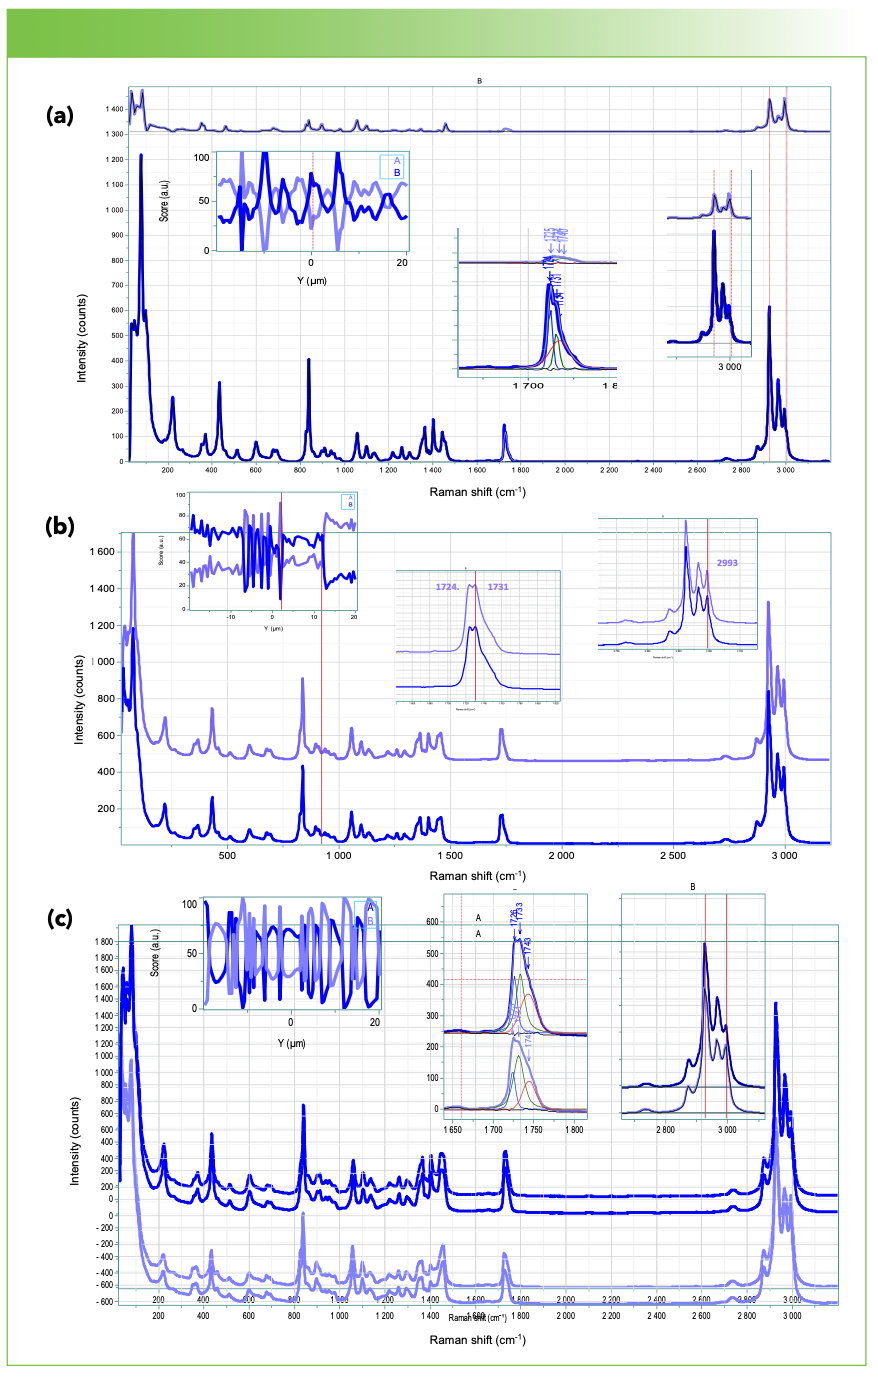
Figures 3 and 4 show the results of calculation of 2 MCR factors for the VV and HV line profiles of the 3 samples. Before calculation the spectra were corrected for the instrument response for V and H polarization analysis which is due mostly to the grating’s reflectivities. It is of interest to see if any of the profiles indicate systematic changes consistent with the banding seen in the crossed polar images.
FIGURE 3: The results of a vertical profile using both laser and Raman polarizers along the vertical direction. From top to bottom (a) 0, (b) 3.9%, and (c) 13% Hx in the PHB. Two MCR factors were calculated on each profile and the scores for those factors were plotted as a function of the position on the vertical axis. That plot is shown in the upper left. The large plots show the two factors for each data set, with the darker factor representing the more crystalline material.

FIGURE 4: The results of a vertical profile using the horizontal laser polarization and vertical Raman polarization. From top to bottom (a) 0, (b) 3.9%, and (c) 13% Hx in the PHB. Two MCR factors were calculated for each profile and the scores for those factors were plotted as a function of the position on the vertical axis. That plot is shown in the upper left. The large plots show the two factors for each data set, with the darker factor representing the more crystalline material.

In the future, we will be subjecting these line profiles to two-dimensional correlation spectroscopy (2D-COS) analysis.
Discussion
The origin of the fringes and rings seen on the crossed polar micrographs is not well understood (2,3). It is believed that as the crystalline lamellae grow along the radial direction, they twist around the a axis, which is the direction of fastest growth of the crystals (4). Therefore, in a vertical line scan through the center of the spherulite, the vertical axis will be parallel to a. This implies that there are testable conditions for the polarized Raman scattering. The normal to the lamellae are parallel to the molecular axis of the polymer which is the c axis. The third axis, the b axis, will lie in the plane of the lamellae. If the lamellae twist around a direction parallel to a, then what we are calling the horizontal axis, H, will be a combination of b plus c, depending on the angle of twist. Thus, the VV Raman scattering is predicted to be the aa component. The HV scattering will vary between the ba and ca Raman tensor components. The question is whether the HV scattering has similar periodicity to the banding in the polarized micrographs. The banding is clearest in the 13% sample, with a periodicity of 5–8 µm. The banding that is seen in the HV Raman profiles varies between 2 and 8 µm, with the narrowest bands close to the center in the 3.9% sample. The micrograph for the 13% sample in Figure 1 does show banding on the order of 5 µm, except in the center where the image is less clear. In addition, if the carbonyl band is expanded, it is clear that there are more than two components. In addition to the sharp crystal band at 1725 cm-1 and a broad amorphous band near 1740 cm-1, a second “crystal” band appears near 1732 cm-1. This band has been previously identified by Professor Noda and his co-workers (5) as representative of secondary crystallization between the primary lamellae.
Why is the banding in the micrographs of the 0 and 3.9% samples less regular? It is well known that the lower the concentration of the Hx, the higher concentration of crystallinity. Perhaps that means that the lamellae are twisting so rapidly along the radius that the optical focus is not adequate to resolve the changes in polarization/orientation. But the line profiles for the HV spectra do show ripples for all concentrations.
What about the VV profiles? In all cases there is no evidence for banding, but the scores plots of the MCR factors show dips for the crystalline component in the center with complementary maxima in the amorphous component in the center. This is exactly what would be predicted at the center where the crystal phase is initiated by a seed.
My question was “What is the source of the force that would be causing the lamellae to rotate?” A careful reading of reference 1 shows that many possible effects have been considered. If I had to guess, I would say that unequal thickness of the lamellae on the two sides would be a good start. In fact, we will be doing atomic force microscopy (AFM) measurements to determine if this is the case.
Summary
This column shows the start to an investigation of using polarized Raman microscopy to complement polarized light micrographs of spherulites in polymers. Our data show self-consistent behavior which means that the polarized Raman can be used to clarify the orientation behavior of the lamellae in the spherulites. In the future we will have AFM measurements that may help to identify which possible mechanism for spherulite twisting is operable in this system. We will also be using 2D-COS with these data sets to determine if the radial development of the lamellae can add anything to our understanding of the crystallization phenomenon. If you are interested, you will be able to find more information in our write-up of this work for the proceedings of the 2DCOS-XII meeting which will be published in the journal Applied Spectroscopy.
References
(1) Sato, H.; Murakami, R.; Padermshok, A.; Hirose, F.; Senda, K.; Noda, I.; Ozaki, Y. Infrared Spectroscopy Studies of CH···O Hydrogen Bondings and Thermal Behavior of Biodegradable Poly(hydroxyalkanoate). Macromolecules 2004, 37 (19), 7203–7213. DOI: 10.1021/ma049117o
(2) Lotz, B.; Cheng, S. Z. D. A Critical Assessment of Unbalanced Surface Stresses as the Mechanical Origin of Twisting and Scrolling of Polymer Crystals. Polymer 2005, 46 (3), 577–610. DOI: 10.1016/j.polymer.2004.07.042
(3) Woo, E. M.; Lugito, G.; Nagarajan, S. Dendritic Polymer Spherulites: Birefringence Correlation with Lamellae Assembly and Origins of Superimposed Ring Bands. J. Polym. Res. 2020, 27 (7), 1–22. DOI: 10.1007/s10965-019-1959-2
(4) Liu, C.; Noda, I.; Martin, D. C.; Chase, D. B.; Ni., C.; Rabolt, J. F. Growth of anisotropic single crystals of a random copolymer, poly[(R)-3-hydroxybutyrate-co-(R)-3-hydroxyhexanoate] driven by cooperative –CH···O H-bonding. Polymer 2018,154, 111–118. DOI: 10.1016/j.polymer.2018.08.046
(5) Noda, I.; Roy, A.; Carriere, J.; Sobieski, B. J.; Chase, D. B.; Rabolt, J. F. Two-Dimensional Raman Correlation Spectroscopy Study of Poly[(R)-3-hydroxybutyrate-co-(R)-3-hydroxyhexanoate] Copolymers. Appl. Spectrosc. 2017, 7 (7), 1427–1531. DOI: 10.1177/0003702817707219
Fran Adar is the Principal Raman Applications Scientist for Horiba Scientific in Edison, New Jersey. Direct correspondence to: SpectroscopyEdit@mmhgroup.com. ●

The Rise of Smart Skin Using AI-Powered SERS Wearable Sensors for Real-Time Health Monitoring
May 5th 2025A new comprehensive review explores how wearable plasmonic sensors using surface-enhanced Raman spectroscopy (SERS) are changing the landscape for non-invasive health monitoring. By combining nanotechnology, AI, and real-time spectroscopy analysis to detect critical biomarkers in human sweat, this integration of nanomaterials, flexible electronics, and AI is changing how we monitor health and disease in real-time.
Nanometer-Scale Studies Using Tip Enhanced Raman Spectroscopy
February 8th 2013Volker Deckert, the winner of the 2013 Charles Mann Award, is advancing the use of tip enhanced Raman spectroscopy (TERS) to push the lateral resolution of vibrational spectroscopy well below the Abbe limit, to achieve single-molecule sensitivity. Because the tip can be moved with sub-nanometer precision, structural information with unmatched spatial resolution can be achieved without the need of specific labels.

.png&w=3840&q=75)

.png&w=3840&q=75)


.png&w=3840&q=75)


.png&w=3840&q=75)


