Raman Spectroscopy and Chemical Bonding of BaFCl, BaFBr, and BaFl
We investigated in detail the Raman scattering of barium fluorohalides BaFX (X = Cl, Br, I) in an effort to characterize changes in structure and chemical bonding. The overall picture that emerges from the BaFX Raman data is that with the compositional change from X = Cl → Br → I, electron density shifts from the axial Ba-X bond to the equatorial Ba-X bonds with compositional change to the heavier halide, and that the charge distribution becomes more delocalized in the halide layers. This change in electron density indicates an increase in covalency of the Ba-X bonds from Cl to I.
Alkaline earth halides have long been known to function well as host lattices for optically active dopants (1–5). As such, they have found uses as luminescent materials (1), X-ray phosphors (2), and as scintillators (1). Also, alkaline earth fluorohalides have found applications such as X-ray storage phosphors, and have brought about the development of computed or digital radiography (3–6). Computed radiography is a means of imaging the internal structure of the human body, and has become widely used in medicine for the diagnosis of human disease. The storage phosphors employed in computed radiography systems are the europium-doped barium fluorohalides, BaFX:Eu2+; whereas here X = Br or a Br/I solid-solution.
The compounds in the BaFX series (X = Cl, Br, I) are isostructural, having the PbFCl structure-type, and all are known to be X-ray storage phosphors when doped with europium. However, it is noteworthy that the Eu2+ doped barium fluorohalides (BaFX:Eu2+) do not all perform comparably. In particular, the performance of the X-ray storage phosphor is highly dependent upon the chemical composition of the host lattice (7,8). We investigated in detail Raman scattering across this series of compounds in an effort to characterize the changes in structure and chemical bonding.
Structure and Raman Scattering
The barium fluorohalides form with the matlockite type structure, and belong to the D4h crystallographic point group (9). The irreducible representations of the lattice vibrations derived from a group theoretical treatment are:

where IR and R represent infrared active and Raman active modes, respectively. The set of acoustic modes is comprised of one A2u and one Eu mode. Therefore, the set of optical phonons is given by:

and we should expect a total of six bands to appear in the Raman spectrum of BaFX. The polarizability tensors for the Raman active modes are:

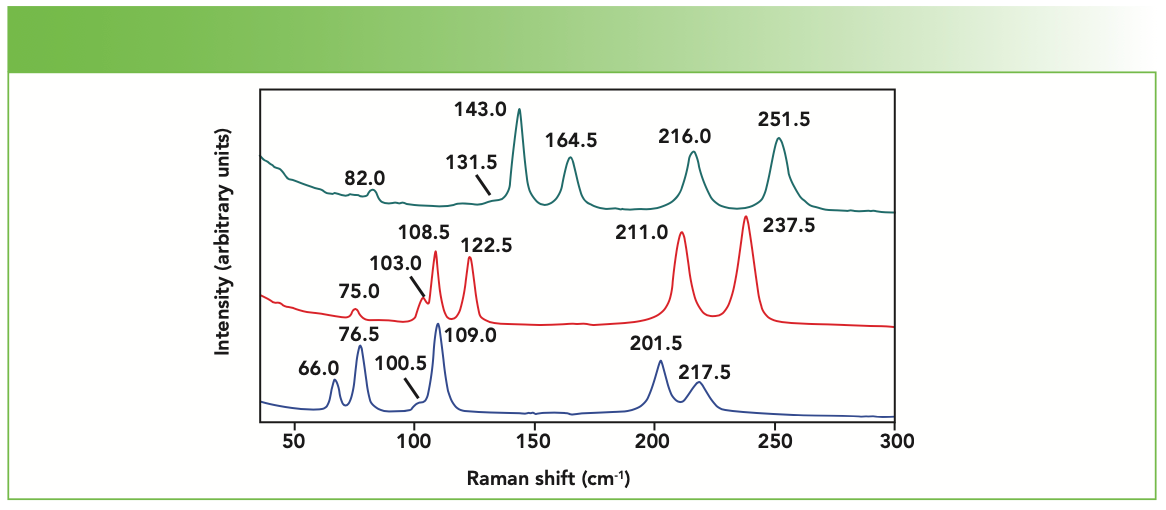
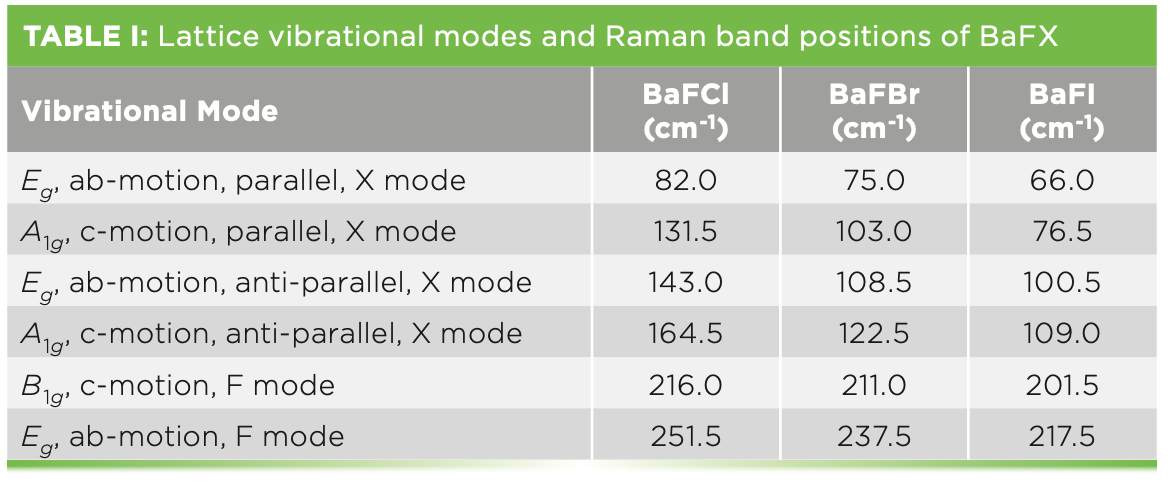
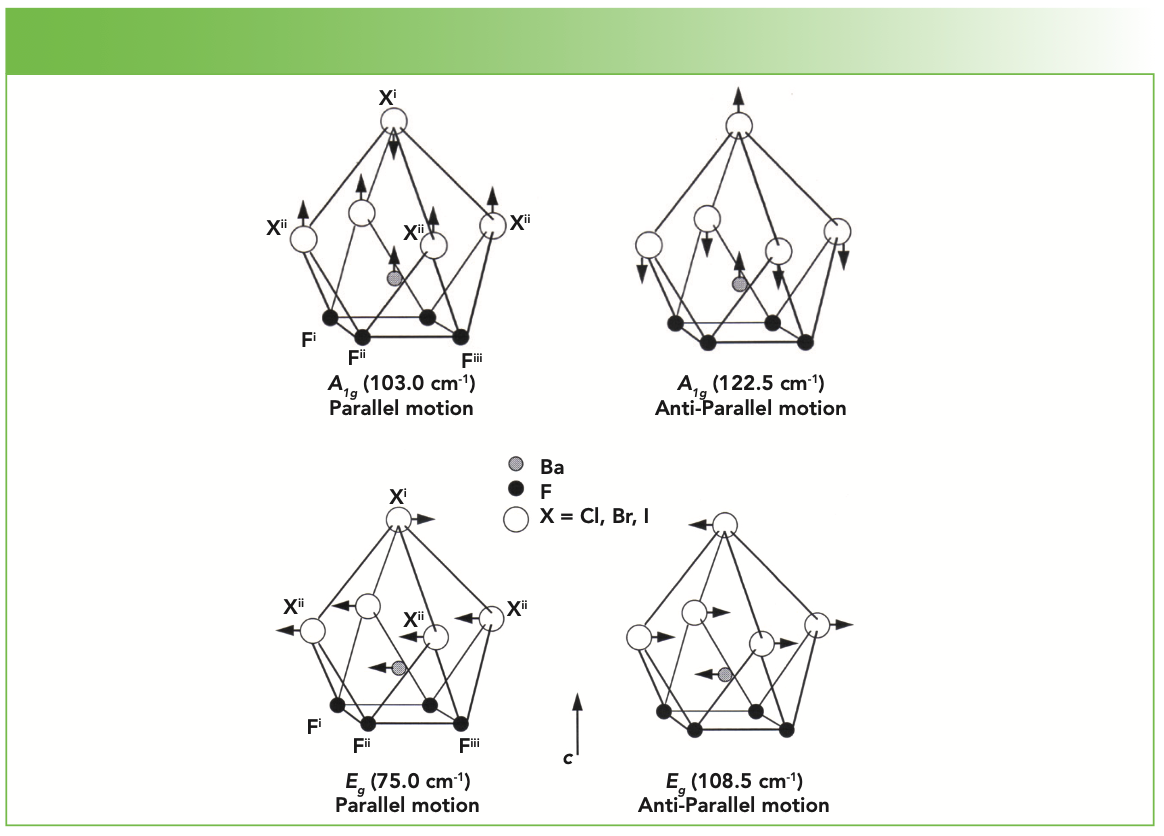
Raman spectra of the BaFX compounds have previously been reported and the bands assigned to specific lattice vibrational modes (10–12). Powder Raman spectra of BaFCl, BaFBr, and BaFI are shown in Figure 1. Each spectrum consists of two A1g, one B1g, and three Eg Raman bands, as predicted by group theory. The Raman band positions from Figure 1, the lattice vibrational modes from which they arise, and the directions of the atomic motions for the specific vibrational modes, as reported by Haeuseler (11), are indicated in Table I. The notations “parallel” and “anti-parallel” are used here to denote the motion of the halide plane relative to that of the Ba atom, which is positioned immediately below the halide plane. An example of this distinction is illustrated by the parallel and anti-parallel motions of the A1g and Eg modes depicted in Figure 2. The c crystallographic axis is shown in the figure; the halide plane lies in the ab crystallographic plane. The BaFBr Raman bands at 211.0 cm-1 and 237.5 cm-1 are attributed to motions of the F atoms, and, therefore, the parallel and anti-parallel halide designations do not apply to these bands. Those modes constituted primarily of Ba and X motion will be referred to as halide modes, whereas those consisting of motions of the F atoms will be described as fluoride modes.
FIGURE 1: Powder Raman spectra of BaFCl (green), BaFBr (red), and BaFI (blue).


FIGURE 2: (Top) Lattice vibrational modes of A1g and Eg symmetry involving primarily barium and halide motion. The band wavenumbers shown here are those of the BaFBr Raman spectrum. (Bottom) Lattice vibrational modes of A1g and Eg symmetry involving primarily barium and halide motion. The band wavenumbers shown here are those of the BaFBr Raman spectrum.

Given that BaFCl, BaFBr, and BaFI all have the same crystal structure, one might expect straightforward differences in the Raman spectra entirely attributable to the mass of the halide atom. In the classical description of vibrational spectroscopy, the frequency of the vibrational mode is proportional to the square root of the vibrational force constant and inversely proportional to the square root of the reduced mass of the oscillator. Therefore, absent any changes in chemical bonding, we would expect all Raman bands associated primarily with halide motion to shift commensurate with halide mass substitution, and show no change in relative intensity. However, all the Raman band strengths change significantly with halide substitution, thereby indicating changes in the polarizabilities of the chemical bonds. Also, even though the halide bands shift to lower wavenumber with increased halide mass as expected, they do not do so in a simple manner related only to reduced mass. Indeed, the magnitude of the band shift with halide substitution depends on whether the vibrational motion is parallel or anti-parallel. Furthermore, the fluoride bands shift significantly to lower the wavenumber with increasing halide mass, even though halide motion does not significantly contribute to the fluoride vibrational modes.
Besides the shifting of Raman bands with chemical composition, we note the changes in the band intensities because of the different polarizabilities of the chemical bonds. Specifically, increasing polarizability of a chemical bond should yield a corresponding increase in the Raman scattering strength of vibrational modes associated with that bond. The A1g and the Eg parallel bands are the weakest of the halide bands, and show no intensity change as the composition changes from BaFCl to BaFBr. In contrast, the A1g and Eg anti-parallel bands are considerably stronger than the parallel modes, and their Raman scattering strength decreases with compositional change from BaFCl to BaFBr. The compositional change from BaFBr to BaFI causes both A1g bands to grow considerably stronger, the Eg parallel band to moderately strengthen, and the Eg anti-parallel band to significantly weaken. The fluoride bands strengthen moderately as the composition changes from BaFCl to BaFBr. However, the change to BaFI causes the B1g c-motion fluoride band to significantly strengthen relative to the moderate intensity increase observed for the Eg ab-motion fluoride band. Perhaps the most salient feature of the Raman band strength changes is the significant signal increase with compositional change (X = Cl → Br → I) of those bands, halide and fluoride, arising from motions along the c-axis. These Raman spectra reveal by their band shifts and different Raman scattering strengths that there are significant differences in chemical bonding among the BaFX compounds.
Chemical Bonding and Spectral Analysis
If there were no differences in BaFX chemical bonding, we could expect bands arising from primarily fluoride motion to have a fairly constant Raman scattering strength, independent of the halide. Also, we might anticipate the halide Raman band strength to be directly related to the polarizability of the halide ion. The electronic polarizability of I- is approximately twice that of Cl- (13), and, therefore, if the BaFX compounds were entirely ionic, we might expect the BaFI halide Raman bands to be stronger than those of BaFCl. However, this is not the case. Indeed, the BaFBr halide bands are of equal or lesser strength than those of BaFCl, notwithstanding that the electronic polarizability of Br- is 30% greater than that of Cl- (13). Furthermore, the intensity of the B1g fluoride band increases dramatically in BaFI. Therefore, the basis for the differences in BaFX Raman scattering strength for halide and fluoride bands must be attributed to changes in the chemical bonding and a shift in electron density distribution.
BaFX (X = Cl, Br, I) grows as plate-like crystals of the PbFCl or Matlockite structure-type, tetragonal space group D74h (P4/nmm). The structure consists of sheets of barium atoms that are assymetrically coordinated on either side by alternating sheets of fluoride and halide atoms. The structure has been viewed by most as a quasi-layered structure, with a cleavage plane oriented perpendicular to the c-axis, consisting of alternating sheets of [BaF]+ and [X]-. The overall coordination number for barium is nine, with each barium cation having a neighborhood of 4F + 4Xii + 1Xi. The fifth halide lying apically above the four halide square in an adjacent layer. It is ultimately the Ba-Xii and Ba-Xi distances that determine the extent of layer character in these compounds. As the halide ion size increases in the series Cl < Br < I, packing in the halide sublattice becomes significantly constrained. This stress is normally relieved by a stretching of the c-axis, and is manifest by an abrupt change in the c/a crystallographic axis ratio of the compound. Bond lengths and angles of BaFX compounds reported by Liebich and Nicollin are shown in Table II (9). We use their atomic labeling as shown in Figure 2. The stretching of the lattice along the c-axis is most evident by observing the changes in Ba-Xi and Ba-Xii bond lengths. For BaFCl, the lone apical halide bond is the shortest of Ba-Cl bonds, whereas for BaFI, the four in-plane Ba-Iii are significantly shorter than the apical Ba-Ii. The result is that the chemical bonding becomes more anisotropic or layer-like as the halide changes from Cl to I.

The Fi-Ba-Fiii bond angle increases a considerable 7.4° from BaFCl to BaFI, whereas the metal halide bond angle Xi-Ba-Xii decreases as the halide becomes larger. Qualitatively, we can describe the fluoride sublattice as flattening out, whereas the halide sublattice squeezes together axially. Consequently, we can expect the electron density in the equatorial Ba-Xii bonds to be greater in BaFI than in BaFCl—that is, the equatorial bonds become more covalent in BaFI. Qualitatively, we envision that some electron density moves from the axial Ba-Xi bond to the equatorial Ba-Xii bonds with compositional change to the heavier halide, and that the charge distribution becomes more delocalized in the halide layers.
To clearly apprehend the Raman spectral changes accompanying compositional variation, we analyze the band separation of common pairs. Bases for common pairs can be atoms contributing to the vibrational mode, parallel or anti-parallel motion, or the symmetry of the mode. We see from Table I that separation of the fluoride modes (∆νF) of BaFI (16.0 cm-1) is 45% that of BaFCl (35.5 cm-1), in spite of the fact that no halide motion is involved in the fluoride lattice vibrational modes. One might expect that halide compositional change should have no direct effect on the fluoride vibrational mode. Specifically, there is no mass change to directly affect the νF bands, whereas there is a significant mass change in the νX bands. A partial explanation for the decreases in νF (see Table I) and ∆νF is the increase of Ba-F bond lengths—see d(Ba-F) in Table II—in the BaFCl to BaFI progression. As d(Ba-F) increases, we expect the vibrational force constants to weaken and the bands to shift to lower wavenumbers.
Conclusions
We investigated in detail the Raman scattering of BaFX (X = Cl, Br, I) to characterize changes in structure and chemical bonding. Changes in the scattering strength and band positions of the BaFX Raman spectra indicate that with the compositional change from X = Cl → Br → I, electron density shifts from the axial Ba-Xi bond to the equatorial Ba-Xii bonds with compositional change to the heavier halide, and that the charge distribution becomes more delocalized in the halide layers. This change in electron density suggests an increase in covalency of the Ba-X bonds from Cl to I.
References
(1) G. Blasse and B.C. Grabmaier, Luminescent Materials (Springer-Verlag, Berlin, Germany, 1994), Chapters 6, 7, and 9.
(2) L.H. Brixner, Mater. Chem. Phys. 16, 253–281 (1987).
(3) G.W. Lucky, U.S. Patent No. 3,859,527 (1975).
(4) M. Sonoda, M. Takano, J. Miyahara and H. Kato, Radiology 148, 833–838 (1983)
(5) K. Takahashi, J. Miyahara and Y. Shibahara, J. Electrochem. Soc. 132, 1492–1494 (1985).
(6) A.R. Lahshmanan, Phys. Stat. Sol. A 153, 3–27 (1996).
(7) A. Meijerink, Mater. Chem. Phys. 44, 170–177 (1996).
(8) C. Dietze, T. Hangleiter, P. Willems, P.J.R. Leblans, L. Struye and J.-M. Spaeth, J. Appl. Phys. 80, 1074–1078 (1996).
(9) B.W. Liebich and D. Nicollin, Acta Cryst. B 33, 2790–2794 (1977).
(10) J.F. Scott, J. Chem. Phys. 49, 2766–2769 (1968).
(11) H. Haeuseler, Phys. Chem. Minerals 7, 135–137 (1981).
(12) M. Sieskind, D. Ayachour, and J.-C. Boulou, Phys. Stat. Sol. B 158, 103–112 (1990).
(13) J.A. Duffy, Bonding, Energy Levels & Bands in Inorganic Solids (Longman Scientific and Technical, Wiley, New York, NY, 1990), pp. 85.
David Tuschel is a Raman Applications Scientist at Horiba Scientific, in Piscataway, New Jersey, where he works with Fran Adar. David is sharing authorship of this column with Fran. He can be reached at: SpectroscopyEdit@MMHGroup.com ●


AI-Powered SERS Spectroscopy Breakthrough Boosts Safety of Medicinal Food Products
April 16th 2025A new deep learning-enhanced spectroscopic platform—SERSome—developed by researchers in China and Finland, identifies medicinal and edible homologs (MEHs) with 98% accuracy. This innovation could revolutionize safety and quality control in the growing MEH market.
New Raman Spectroscopy Method Enhances Real-Time Monitoring Across Fermentation Processes
April 15th 2025Researchers at Delft University of Technology have developed a novel method using single compound spectra to enhance the transferability and accuracy of Raman spectroscopy models for real-time fermentation monitoring.
Nanometer-Scale Studies Using Tip Enhanced Raman Spectroscopy
February 8th 2013Volker Deckert, the winner of the 2013 Charles Mann Award, is advancing the use of tip enhanced Raman spectroscopy (TERS) to push the lateral resolution of vibrational spectroscopy well below the Abbe limit, to achieve single-molecule sensitivity. Because the tip can be moved with sub-nanometer precision, structural information with unmatched spatial resolution can be achieved without the need of specific labels.