Raman Spectroscopy: Bringing Inline Analysis to Production
New Raman spectroscopy applications are emerging in non-traditional fields because of advances in easy-to-use commercial Raman spectroscopy instrumentation. With improvements in lasers, optics, and detectors, Raman spectroscopy has developed into a powerful measurement solution for manufacturing and quality control applications.
Since its discovery in the 1920s, Raman spectroscopy has revolutionized process analysis with its nondestructive nature and ability to measure sample composition. More recently, technological improvements in lasers, optics, and detectors have made Raman faster and more accessible to both scientists and nonexperts for real-time process analysis. As a result, Raman is now a powerful measurement solution for research and development, manufacturing, and quality control. When applied in manufacturing processes, Raman spectroscopy provides real-time results in seconds, transmitted to an advanced process control (APC) system to increase process understanding and efficiency, ensuring product quality and consistency. A process Raman system has considerable operator health and safety benefits. For instance, using an immersion Raman probe eliminates the need for toxic samples to be extracted from the process and analyzed in the laboratory, significantly reducing exposure. This article focuses on two examples of Raman’s safety and time benefits in process control. The first example is the manufacture of organometallic compounds, such as trialkyl aluminum compounds, that are pyrophoric and dangerous to sample. The second is the transformation of organic waste into alternative fuels, where monitoring the reaction offline at extreme temperatures and pressures is dangerous, time-consuming, and expensive.
Raman spectroscopy is no longer reserved for just laboratory use. New Raman spectroscopy applications are emerging in non-traditional fields because of advancements in easy-to-use commercial Raman spectroscopy instrumentation (1). Outside the laboratory, Raman spectroscopy has found a home in manufacturing and quality analysis. Raman spectroscopy systems are the new analytical tools to control processes by measuring critical process parameters (CPPs). With improvements in lasers, optics, and detectors, Raman spectroscopy has developed into a powerful measurement solution for research and development, manufacturing, and quality control.
Raman spectroscopy is an optical analysis technique that relies on the measurement of the vibrational properties of molecules. It produces a unique spectral fingerprint that identifies the chemical composition and molecular structure of materials. Taking a Raman measurement is as simple as shining a laser onto a sample. A spectrometer collects and measures the Raman scattered photons, creating a unique spectral fingerprint. A Raman measurement can be collected in seconds for most organic substances. Sample mixtures, even those containing water, can also be analyzed quickly and effectively. There is little to no sample preparation required when using Raman spectroscopy. The technique is non-destructive and can measure samples in real-time, making it an effective process analysis tool. A Raman signal is straightforward to interpret: The distribution of the spectral peaks describes the molecule’s composition while the signal intensity correlates linearly with concentration. The simplicity of this data-rich qualitative and quantitative information makes Raman spectroscopy an attractive process analytical technology (PAT) tool.
In addition, the evolution of Raman spectrometers and probes reveals that Raman equipment has long had a reputation for being expensive, cumbersome, and difficult to use. Advancements in the stability and portability of certain Raman systems demonstrate that this technology can be moved out of the traditional laboratory and installed at the point of need with little to no maintenance. These recent developments have been valuable in reducing the need for sample extraction and handling, especially when hazardous materials are present.
These benefits and advancements have increased the adoption of Raman spectroscopy systems in various fields. Raman systems have proven valuable for analyzing and controlling product quality in industries such as pharmaceuticals, biopharmaceuticals, polymers, semiconductors, oil and gas, alternate fuels, and fine art. This list continues to grow as more industries learn about the value of process Raman spectroscopy. Companies are beginning to realize that real-time Raman spectroscopy compositional analysis allows them to engineer quality into their products, reduce the cost of manufacturability, and speed up the time to market (2).
Given the ease of use, simplicity of data analysis, first principles compositional information, and versatility, Raman spectroscopy is an excellent tool for industrial process analysis and control.
What is Process Raman Spectroscopy?
When used in an industrial setting, Raman spectroscopy can increase process efficiency and understanding. Raman ensures product quality and consistency by transmitting real-time compositional data to advanced process control (APC) systems in seconds. This is known as “process Raman spectroscopy.”
Process Raman spectroscopy can address manufacturing challenges in various industries: How does one obtain actionable, real-time insights for production? How does one ensure consistent product quality? What is the optimal way to manage process variability? Process Raman spectroscopy is the answer to these questions because it offers a higher level of compositional information for process control. As a result, process Raman spectroscopy has become an established PAT tool. Raman can also be used as an online–inline optical sensor, bringing analysis right to the production line (for example, a conveyor belt, tablet coater, or wet milling operation).
Before taking Raman spectroscopy out of the laboratory, manufacturers looking to adopt process Raman spectroscopy technology in their production lines must consider several factors: Are their Raman spectroscopy systems easy to install and maintain? Are their instruments portable? The ability to install your Raman spectroscopy system at the point of need is essential in these applications. Reducing the cost of ownership is imperative when using Raman spectroscopy for continuous process analysis and control.
Furthermore, selecting the appropriate equipment is of the utmost importance when taking Raman spectroscopy out of a laboratory setting. Technical requirements to look for are a 785-nm laser wavelength for the right balance between signal strength and reduced fluorescence, open platform communications (OPC)–compatibility, and the ability to interface with chemometrics process software, all of which are important considerations for process analysis.
Once installed, process Raman spectroscopy has considerable operator health and safety benefits because samples are no longer required to be extracted from the manufacturing process and transported to the laboratory for analysis.
Raman Spectroscopy as a Process Analytical Technology Tool
Raman spectroscopy is an established PAT tool. It can collect and preprocess molecular compositional data to build a chemometric model for CPPs (3,4). Raman spectroscopy can also help control and fine-tune processes based on fast, real-time feedback to improve critical quality attributes (5).
This article reviews two industrial applications that have successfully used Raman spectroscopy as a PAT tool: The first industrial application is the manufacture and sampling of highly sensitive and reactive trialkyl aluminum compounds. The second is the transformation of organic waste into alternate fuels.
By utilizing online Raman spectroscopy, as opposed to traditional offline monitoring, manufacturers can significantly reduce cost and risk while improving efficiency. Installation of a solid-state process Raman spectroscopy system is straightforward, and it does not require a sophisticated sampling system. The ongoing cost expressed as the total cost of ownership is negligible, given the stability and reliability of factory-calibrated process Raman systems.
Sampling Hazardous Compounds with Raman Spectroscopy
Manufacturers handling hazardous materials in their production facilities face unique analytical challenges when it comes to the collection of samples for laboratory analysis. These substances do not travel well and could potentially be dangerous to the person sampling or handling them (6). An example is trimethyl aluminum (TMA), a highly sensitive and reactive chemical compound. TMA is known for its exceptional degree of pyrophoricity. Science Translational Medicine has called TMA reactions “the most notorious fireball in all of chemistry” (7).
Organometallic compounds like TMA constitute an extensive group of substances that have played a significant role in chemistry development. They are used as catalysts and as intermediates in both the laboratory and in the industry.
Challenge
Organometallics are manufactured in large volumes with very high purity, which presents major analytical obstacles, because sample handling is hazardous (8). Raman spectroscopy has been demonstrated to help manufacturers overcome this challenge. One strategy is to use a sensitive, spectroscopic inline measurement for process monitoring and control during the manufacturing process.
As mentioned above, organometallic purity is of the utmost importance, so any spectroscopic method capable of measuring purity must have excellent specificity, sensitivity, stability, accuracy, and precision. Solid-state Raman spectroscopy has all of the above attributes and no requirement for a sophisticated sampling system, making the installation of such a system relatively straightforward.
Method
In this example, the measurement of organometallic purity was performed with process Raman spectroscopy. The manufacturer coupled a MarqMetrix Raman spectrometer with a laser excitation of 785 nm to 100 m of high-grade armored fiber-optic cable. This cable was connected to a Hastelloy C-276 BallProbe, mounted into the process with flanges, and installed. A separate identical probe with a 3-m fiber-optic cable was coupled to the spectrometer for model development purposes.
The standard procedure for method development is collecting inline Raman spectra at regular intervals with accurate time and date stamps. Process operators then extract samples at set times and send them to the laboratory for analysis. The laboratory analysis would be compared to the Raman spectra, and a multivariate data analysis (MVDA) model would be developed. In this case, that traditional methodology is not possible because the sample has an extremely reactive nature.
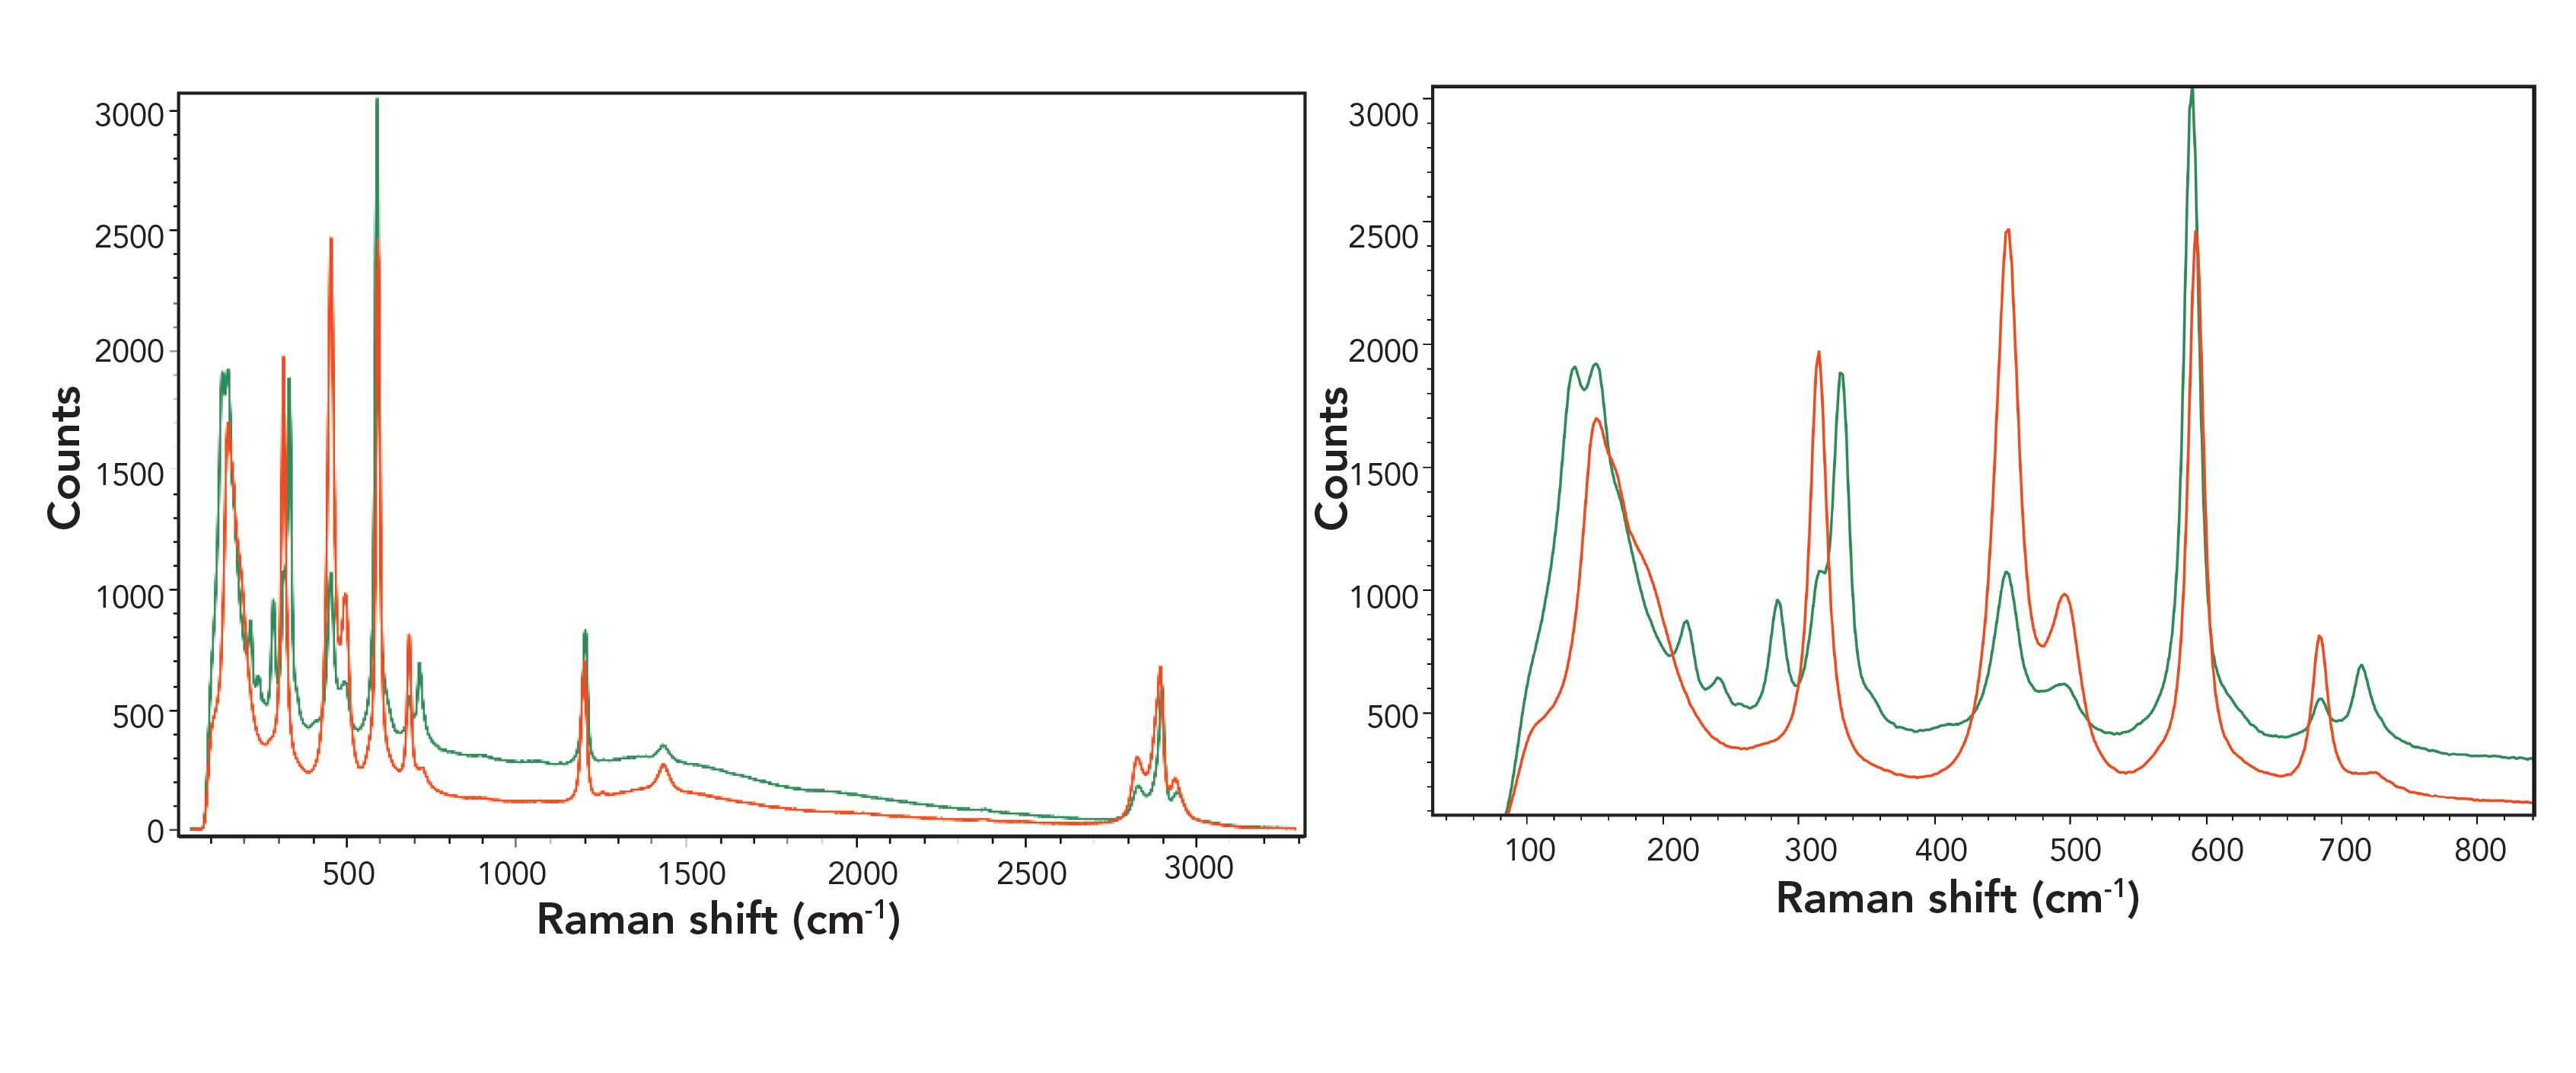
Because of the sample handling challenges, sample extraction from the process must be minimized as much as possible to ensure operator safety. An alternative methodology is to extract one pure sample from the plant and “spike” it with known impurities to create a sample set, consisting of 18 samples specified by a design of experiments (DoE) approach. This combination ensures maximum sample variance with a minimum number of samples, and a purity range of 90 to 99.9%. The DoE sample set used for calibration was stored in glass vials under nitrogen, and Raman spectra were collected using a contact-free probe measuring through the vial. Acquisition parameters set the integration time to 230 mS and the laser power to 450 mW. Figure 1 shows the Raman spectra of the finished organometallic product with a 90% pure sample. There are clear differences in the spectra that correspond to the variation in sample purity.
Figure 1: Raman spectra of organometallic products of differing purity.
The MVDA algorithm used was partial least squares (PLS). The spectral data were preprocessed using a first derivative and standard normal variate (SNV) treatment to correct for additive and multiplicative baseline effects and to enhance resolution. A cross-validation technique was used to ensure realistic error statistics were calculated. Figure 2 shows the statistical results for the cross-validation with both a regression line (Figure 2a) and target line alongside the plot of error versus the number of PLS factors (Figure 2b).
Figure 2: Statistical results for the cross-validation: (a) predicted vs. reference regression plot; (b) root mean square error vs. number of PLS factors.
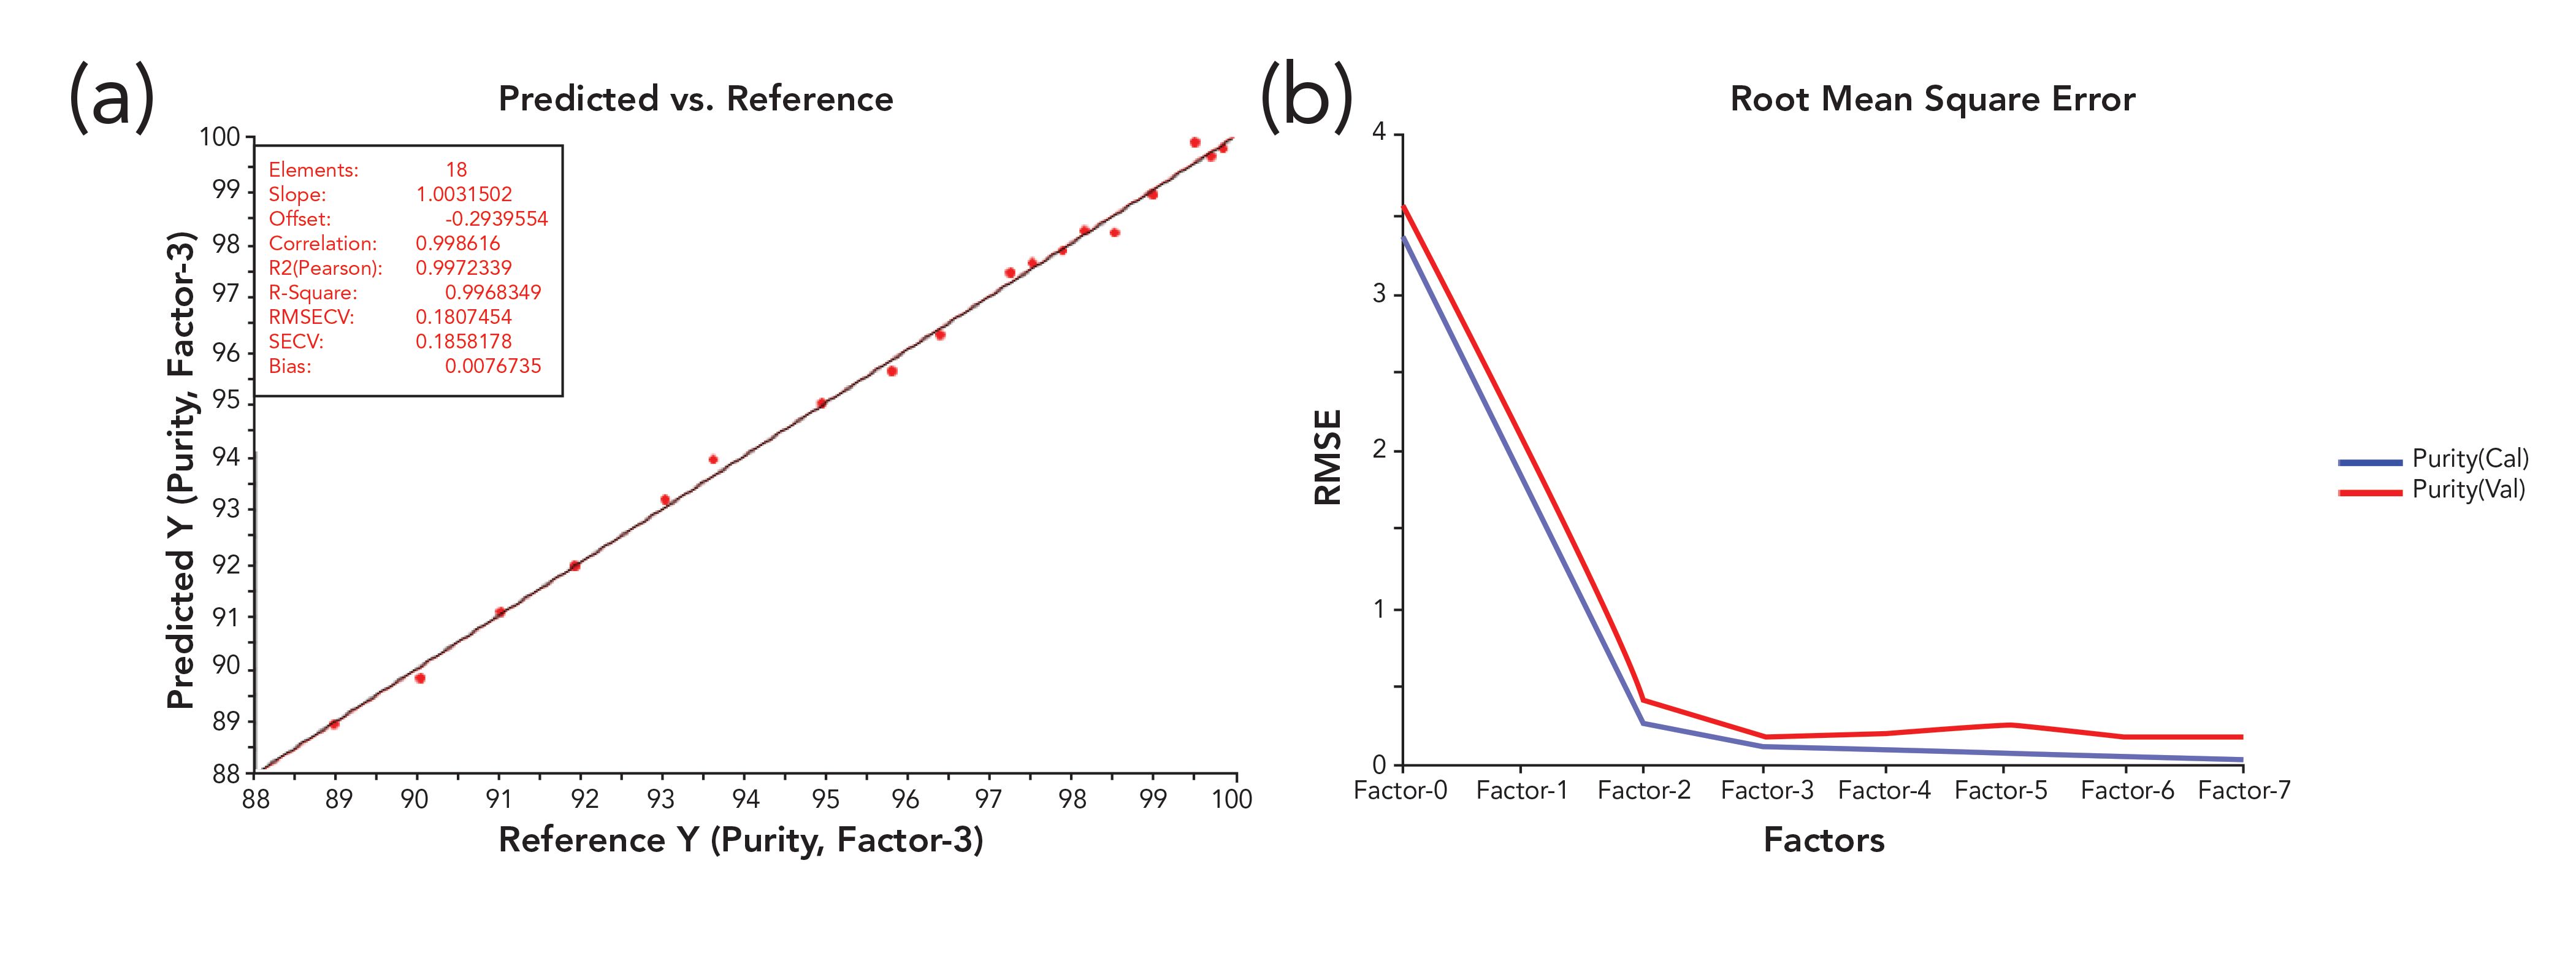
A three-factor PLS model was optimal as indicated by the root mean square deviation (RMSD) for the cross-validation data increasing because of the overfitting of additional factors. The PLS model was subsequently implemented for inline analysis. There were minor changes to integration time because longer lengths of optical fiber were used, and the analysis was subsequently performed using third-party process control software (Camo Analytics Process Pulse II) for model execution, visualization, and transmission of results via fieldbus to the plant process control system. Results are updated once per minute, and process operators make key decisions that ensure product quality and consistency while reducing cycle times (Figure 3).
Figure 3: Typical real-time product purity vs. time plot for inline Raman spectroscopy analysis.
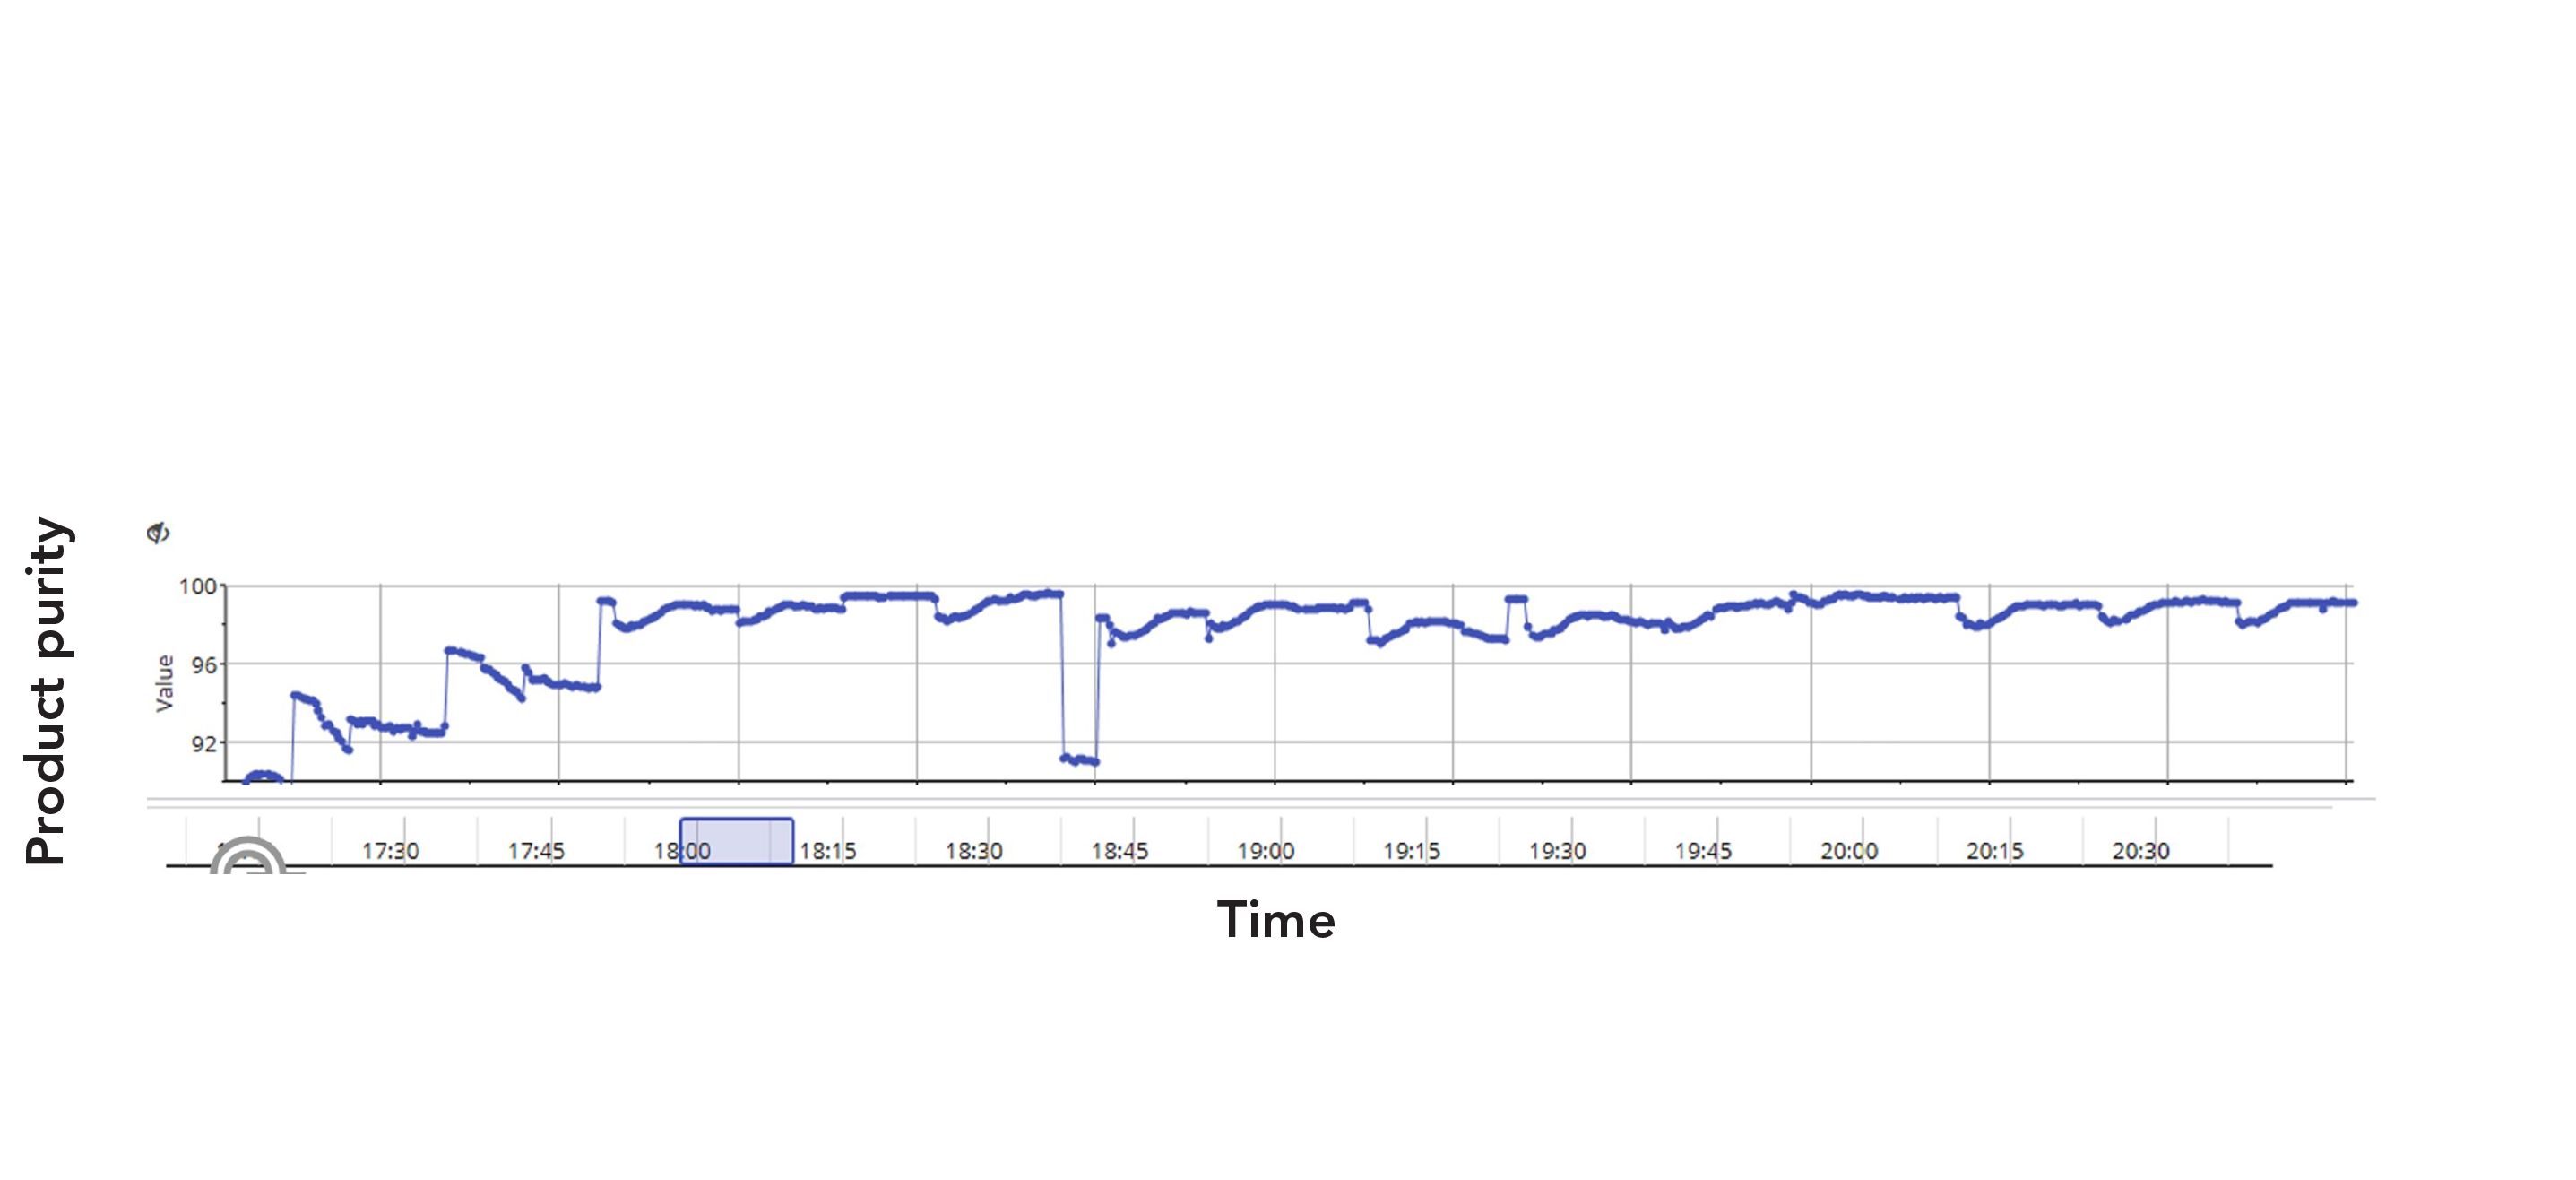
Figure 3 shows the continuous Raman spectroscopy analysis of product purity versus time. Process operators set control limits, alarms, and warnings on the process control system. Results were updated once per minute, enabling the operators to optimize process settings to ensure all material produced is within specification resulting in increased product yield and reduced cycle times.
Analyzing the Transformation of Organic Waste into Alternate Fuels with Raman Spectroscopy
Hazardous compound sampling and the transformation of organic waste into alternate fuel technology share one common factor: Both are more efficient when continuously monitored with a Raman spectrometer. In the case of supercritical water gasification (SCWG) of organics, Raman spectroscopy is the only technology that can effectively measure the required CPPs (4).
SCWG is an emerging alternate fuel technology (9,10). It can transform organic waste, such as biomass, into hydrogen-rich syngas. Water becomes a unique fluid above its thermodynamic critical point (374 °C, 22.1 MPa), but there are very few tools that can study the decomposition of organic waste at these temperatures and pressures. The use of an inline or online measurement tool is imperative to understand CPPs and study the effects of these parameters on the reaction kinetics
Challenge
Traditionally, gas chromatography is used for total organic carbon (TOC) analysis. This ex situ analytical method is time-consuming and expensive to operate because reactor conditions can only be changed from run-to-run, and the system requires carrier gas, column maintenance, and regular maintenance to maintain optimal performance. In situ process Raman spectroscopy makes it possible to continuously monitor and identify gasification products such as H2, CO2, and CO in real-time. Decisions to adjust operational parameters are made based using these well-timed insights. In this example, process Raman spectroscopy was used in the analysis of the kinetics of decomposition of formic acid in sub- and supercritical water. CPPs for optimizing yields and the product composition are temperature, pressure, concentration, residence time, reactor concentration, reaction pathway, and catalysis (5).
Method
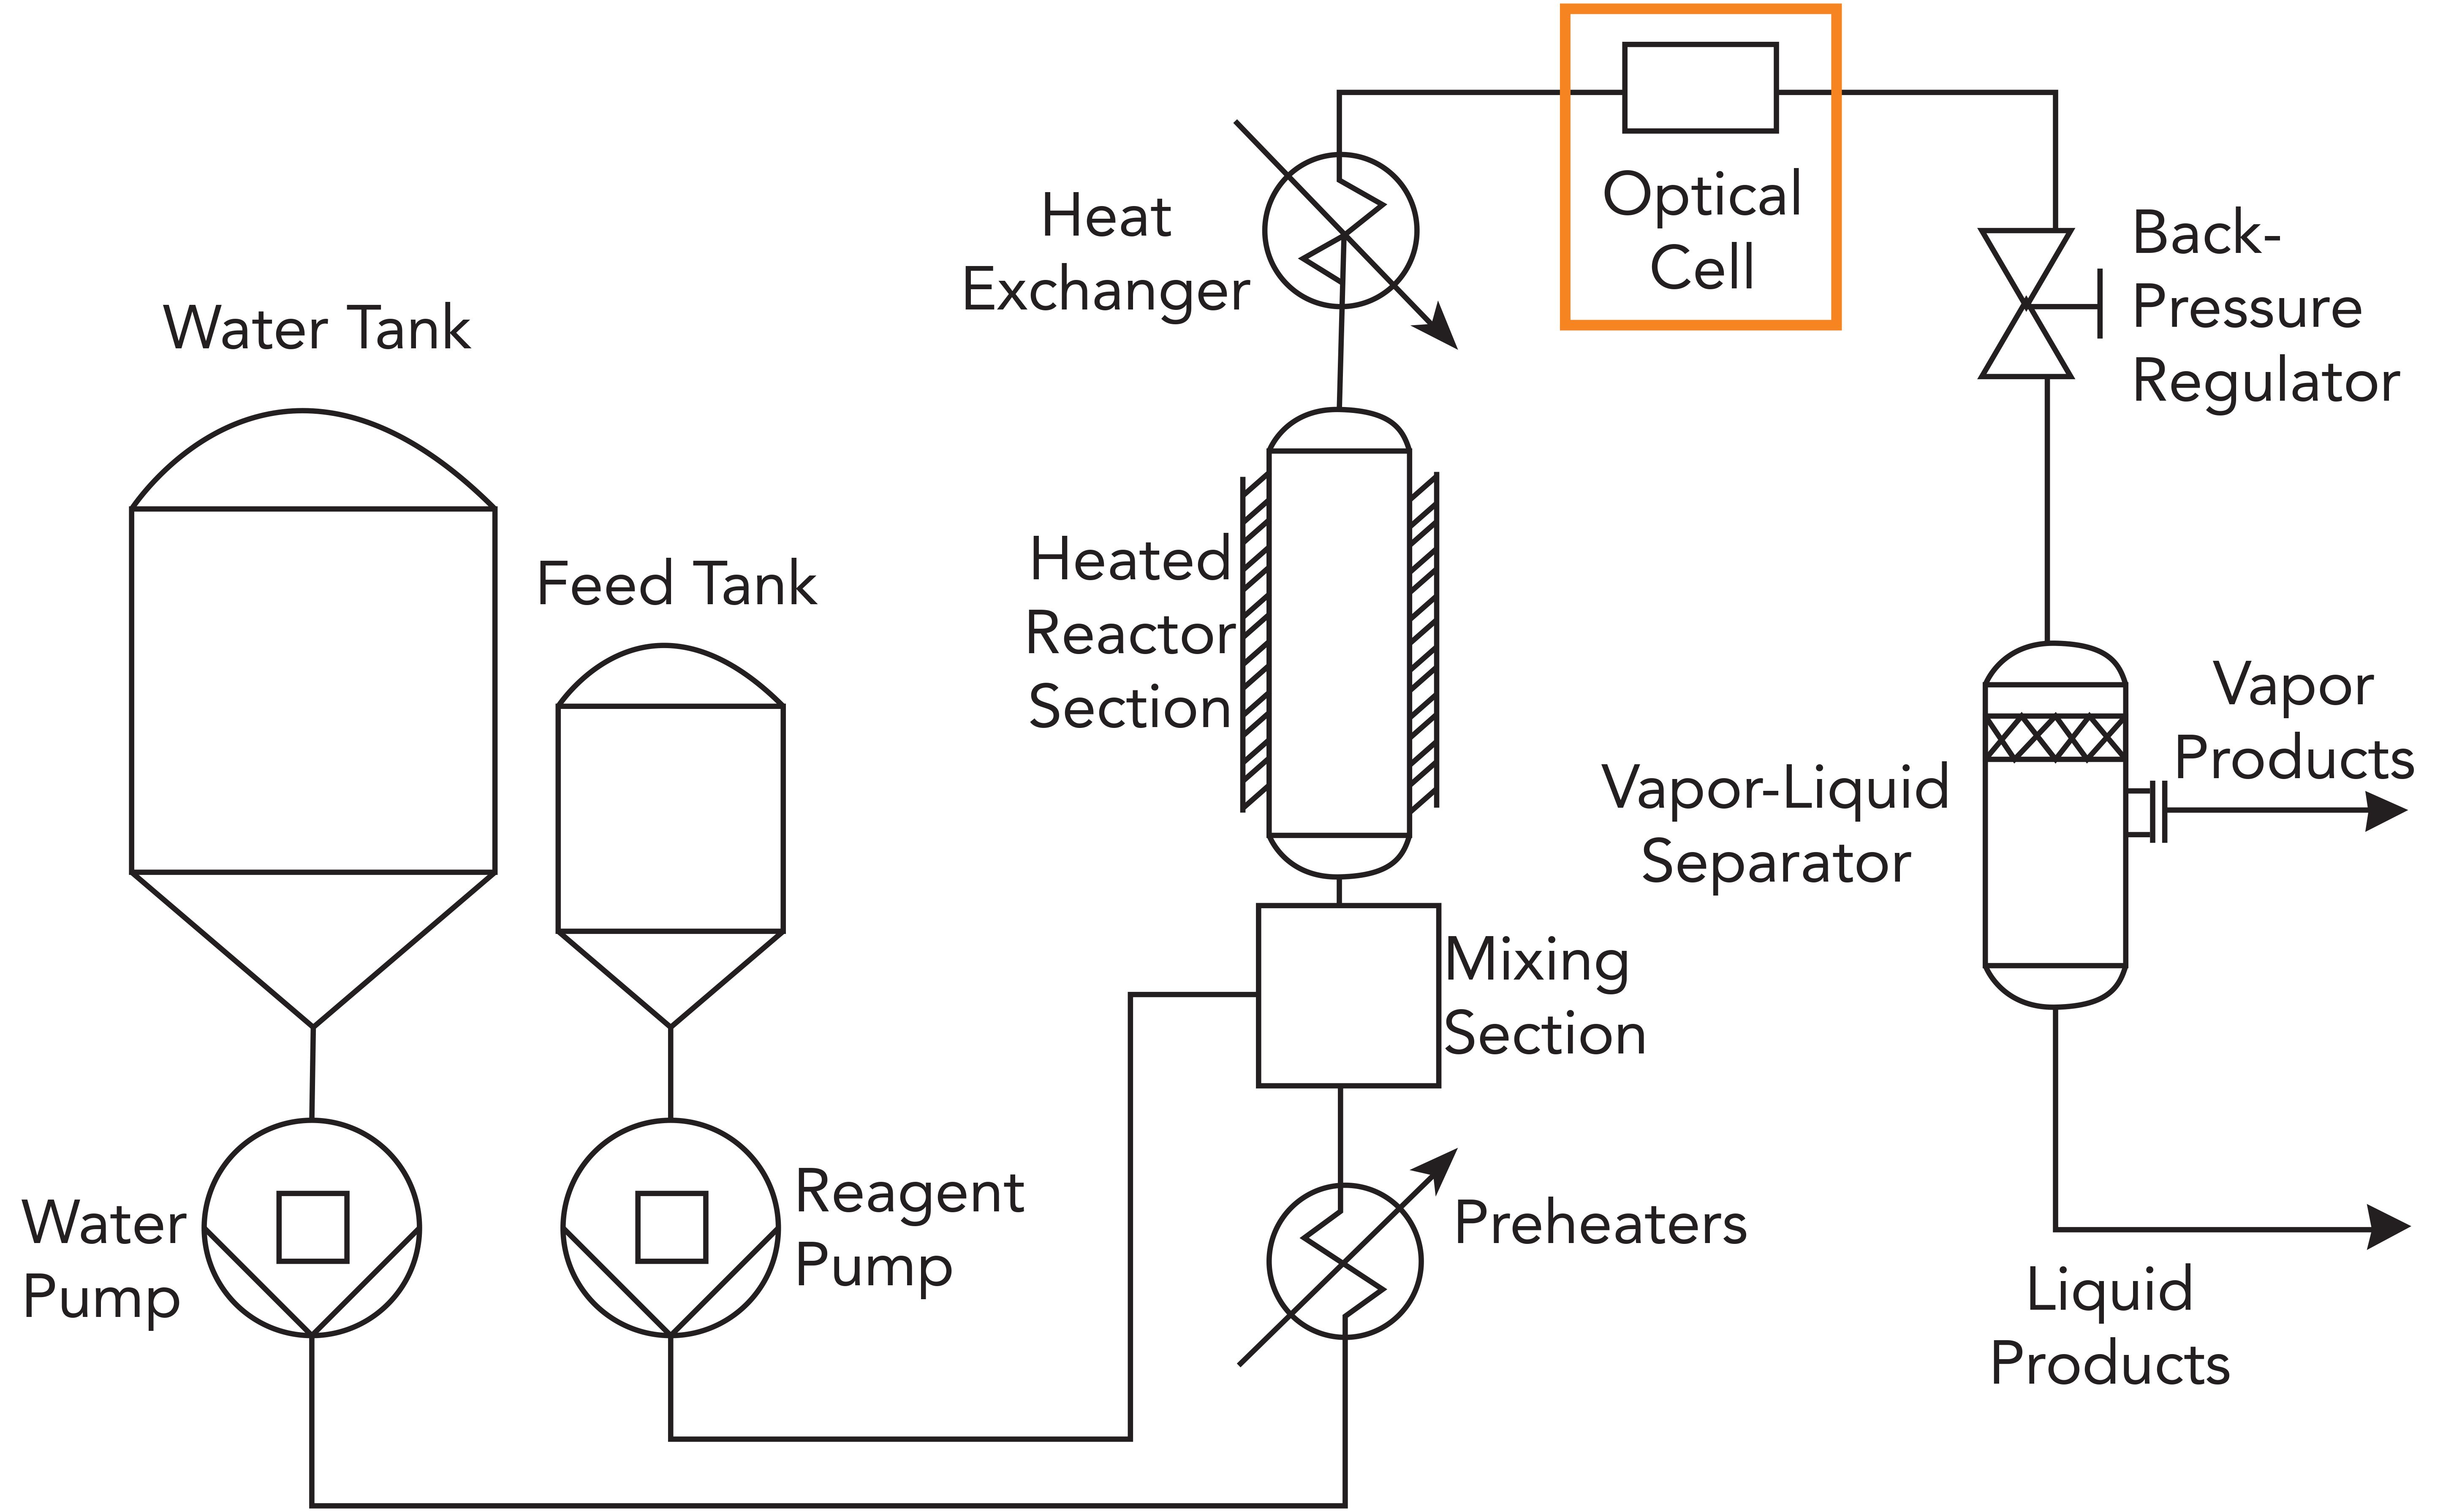
In a study conducted by professor Igor V. Novosselov at the University of Washington, the decomposition of formic acid was monitored in a continuous sub- and supercritical water reactor at temperatures between 300 and 430 ºC, at a pressure of 25 MPa, with a residence time between 4–65 s, and a feedstock concentration of 3.5 wt%. Raman instrumentation and a MarqMetrix immersion BallProbe were located immediately after the heat exchanger (optical cell in Figure 4) to allow for in situ monitoring of the product species in the quenched effluent stream.
Figure 4: Schematic of a supercritical water gasification reactor, with position of Raman optical sampling cell shown. (Courtesy of Igor V. Novosselov, University of Washington.)
The equipment used was a fiber-optic immersion probe with a 785-nm laser operating at the 300 mW power setting. The immersion probe’s sapphire ball lens focuses the laser into the sample flow. Five spectra, each with a total integration time of 20 s, were collected and averaged for each operational condition—signal averaging provided an acceptable signal-to-noise ratio for identifying minor constituents. A semi-manual fluorescent background subtraction method was used for consistent spectral processing. The spectra were normalized to the sapphire peak (used as an internal standard), to negate sample to sample variance. The manufacturer used an average of all five spectra to calculate product yield. The five individual spectra were used to calculate the uncertainty of reported yields to a 95% confidence interval.
The Raman signal intensity for a given molecule is linearly dependent on the constituent molar concentration in the optical control volume. However, temperature, pressure, reactions, and molecular interactions can cause non-linear spectral behavior. For the spectra collected in this study, indirect hard modeling (IHM) was used to extract species concentration data.
Calibration was accomplished by using the least-squares optimization of stoichiometric atom balances for the collected spectra. This action allows calibration without an extensive set of known mixture spectra that are challenging to produce for a two-phase effluent stream of a reacting system.
The gasification of formic acid resulted in yields of H2, CO, and CO2. Figure 5 shows a representative Raman spectrum of the decomposition products formed from gasifying formic acid. The corresponding chemical identification of significant peaks are noted in the plot.
Figure 5: Raman spectrum of decomposition products of formic acid. Correlated chemical species identify Raman peaks of relevant components. (Courtesy of Igor V. Novosselov, University of Washington.)
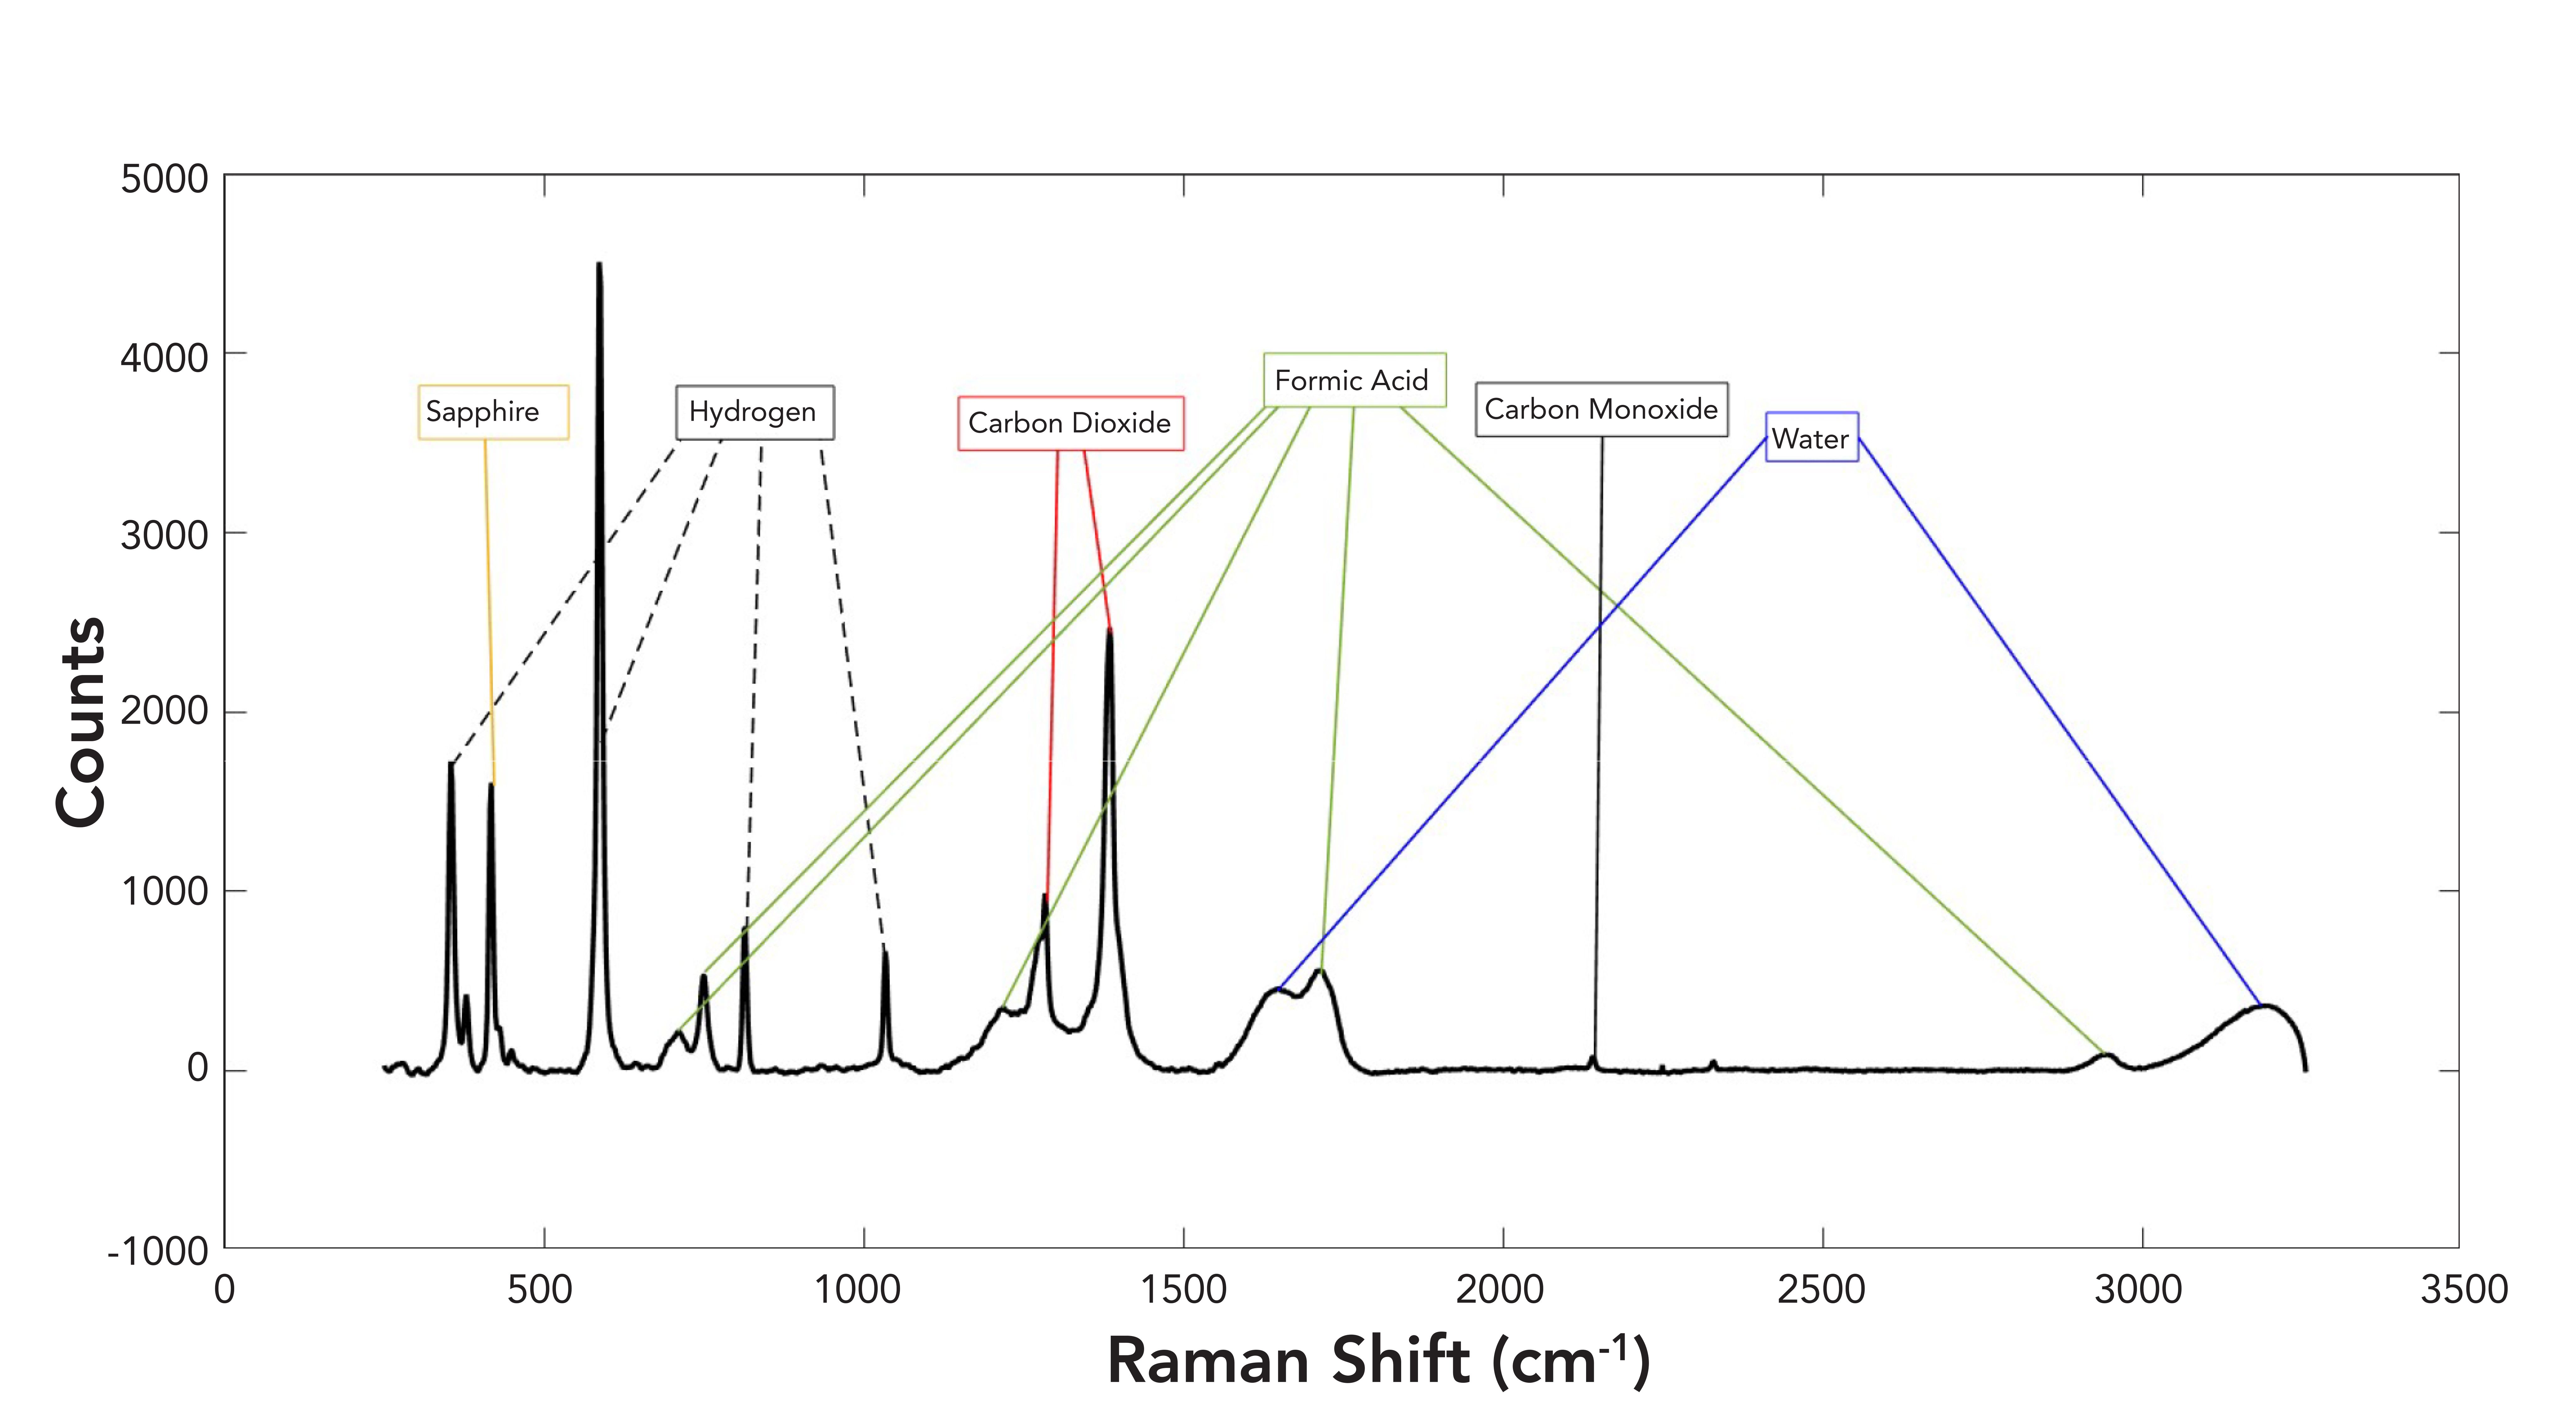
The experimental conditions of the supercritical water reactor and the gasified formic acid were as follows: Continuous temperatures hovered between 300 and 430 °C; a pressure of 25 MPa was maintained; residence times stayed between 4 and 65 s; and a feedstock concentration was set at 3.6 wt%. Raman spectroscopy was used to accurately monitor the in situ liquid and gaseous products in the effluent stream. The use of Raman spectroscopy also allowed operators to collect data during reactor operation, which quickly assessed the reaction products. A total of 10 experimental conditions were tested in a day, demonstrating potential for expediting future gasification studies with more complex model compounds.
In the end, CPPs such as temperature, pressure, residence time, and the concentrations of H2, CO2, CO, and residual formic acid were identified. In conclusion, at temperatures below 300 °C, formic acid did not show significantly fast decomposition. At temperatures above 430 °C, formic acid decomposed too rapidly to quantify kinetic rates accurately.
Conclusion
In manufacturing, timing can impact everything, from development to the time it takes to get a product to market. Businesses desire production insights to facilitate real-time decisions that may ultimately give them an advantage over their competitors. Raman spectroscopy can help industries overcome difficult production hurdles and improve product quality. As a measurement technology, it is reliable, easy to interpret, and process-ready. However, these benefits are dependent on the type of equipment a business ultimately chooses to use. A solid-state Raman spectrometer will allow you to take Raman out of the laboratory and into production.
References
- K.A. Esmonde-White, M. Cuellar, C Uerpmann, B. Lenain, and I.R. Lewis, Anal. Bioanal. Chem. 409, 637–649 (2017).
- M.O. Baradez, D. Biziato, E. Hassan, and D. Marshall, Front. Med. 5(47), 1–14 (2018).
- T.R.M. De Beer, C. Bodson, B. Dejaegher, B. Walczak, P. Vercruysse, A. Burggraeve, A. Lemos, L. Delattre, Y. Vander Heyden, J.P. Remon, C. Vervaet, and W.R.G. Baeyens, J. Pharm. Biomed. 48(3), 772–779 (2008).
- “What is Multivariate Analysis?” Camo Analytics (Oslo, Norway, 2019).
- “Process analytical technologies: a unique data management challenge,” Optimal Industrial Automation Ltd. (Bristol, United Kingdom, 2012).
- S. Bryan, T. Levitskaia, and S. Schlahta, “Raman Based Process Monitor for Continuous Real-Time Analysis Of High Level Radioactive Waste Components,” paper presented at the WM2008 Conference, Phoenix, Arizona, 2008.
- D. Lowe, Safety Warnings. Sci. Transl. Med, June 2, 2020.
- B. Zachhuber, G. Ramer, A. Hobro, E. T.H. Chrysostom, and B. Lendl, Anal. Bioanal. Chem. 400, 2439–2447 (2011)
- B.R. Pinkard, D.J. Gorman, E.G. Rasmussen, V. Maheshwari, J.C. Kramlich, P.G. Reinhall, and I.V. Novosselov, Int. J. Hydrog. Energy 44, 31745–31756 (2019).
- B.R. Pinkard, D.J. Gorman, E.G. Rasmussen, V. Maheshwari, J.C. Kramlich, P.G. Reinhall, and I.V. Novosselov, Data in Brief 29, 105–312 (2020).
Brian Marquardtis the Founder and CEO of MarqMetrix, Inc. and the Director of the Center for Process Analysis and Control (CPAC) at the University of Washington. Bharat R. Mankani is an Application and Data Scientist at MarqMetrix, Inc. Direct correspondence to: brian@marqmetrix.com
AI-Powered SERS Spectroscopy Breakthrough Boosts Safety of Medicinal Food Products
April 16th 2025A new deep learning-enhanced spectroscopic platform—SERSome—developed by researchers in China and Finland, identifies medicinal and edible homologs (MEHs) with 98% accuracy. This innovation could revolutionize safety and quality control in the growing MEH market.
New Raman Spectroscopy Method Enhances Real-Time Monitoring Across Fermentation Processes
April 15th 2025Researchers at Delft University of Technology have developed a novel method using single compound spectra to enhance the transferability and accuracy of Raman spectroscopy models for real-time fermentation monitoring.
Nanometer-Scale Studies Using Tip Enhanced Raman Spectroscopy
February 8th 2013Volker Deckert, the winner of the 2013 Charles Mann Award, is advancing the use of tip enhanced Raman spectroscopy (TERS) to push the lateral resolution of vibrational spectroscopy well below the Abbe limit, to achieve single-molecule sensitivity. Because the tip can be moved with sub-nanometer precision, structural information with unmatched spatial resolution can be achieved without the need of specific labels.