Raman Spectroscopy of Carbon — More Information Than You Would Think
In this article, columnist Fran Adar will review the important features of the Raman spectra of these materials and indicate why the extracted information is important for material development and engineering.

Before the modern age of Raman spectroscopy, Raman was used to identify diamond, graphite, and disorder in graphitic–carbon materials, including carbon-containing composites. Then came the fullerenes — buckyballs and carbon nanotubes — as Raman spectroscopy has become the tool of choice in characterizing these materials, especially the carbon nanotubes. More recently, Raman has been used to characterize graphene — single sheets from a graphite crystal. Amazingly, the spectrum can be recorded without damaging the material, and actually can be used to determine how many sheets are present. In this article, we will review the important features of the Raman spectra of these materials and indicate why the extracted information is important for material development and engineering.
What is curious about the Raman spectrum of carbon is that even though the spectra of these materials is actually quite simple, they have been found to be quite useful. To quote Ferrari in his review (1), "The Raman spectra of all carbon systems show only a few prominent features, no matter the final structure, be it a conjugated polymer or a fullerene. The spectra appear deceivingly simple: just a couple of very intense bands in the 1000–2000 cm–1 region and few other second-order modulations. However, their shape, intensity, and positions allow us to distinguish a hard, amorphous carbon from a metallic nanotube, giving as much information as that obtained by a combination of other lengthy and destructuive approaches. The peculiar dispersion of the π electrons in graphene is the fundamental reason why Raman spectroscopy in carbons is always resonant and, thus, a powerful and efficient probe of their electronic properties, not only of their vibrations."

Fran Adar
Different carbon materials are used in various engineering applications, from high tech to low tech. Films are used as tribological coatings; fibers are used in composites for their strength; and nanotubes and graphene are being explored for use in microelectronics. Carbon composites have wide-ranging uses from aerospace to athletic gear. The ability of Raman spectroscopy to characterize these materials, in situ, with high spatial resolution (better than 1 μm) can be, and is being, exploited during development and QC.
The Raman spectra of the various allotropes of carbon are best understood in the framework of solid-state physics.
Diamond has the same structure as silicon and germanium, with two atoms in the unit cell. All C–C bonds are tetrahedral (sp3 ) and the lattice is cubic, so there is one triply degenerate optical phonon at the center of the Brillouin zone. As expected, the phonon frequency scales inversely with the mass of the element — 1332 cm–1 for carbon (diamond), 521 cm–1 for silicon, and 300 cm–1 for germanium.
Graphite is composed of stacks of planes of sp2 -bonded carbon with the layers staggered (some atoms of one layer sit atop the centers of the hexagonal rings of adjacent layers) in an ABAB arrangement. There are two planes in the unit cell, and the symmetry is D46h. There are two doubly degenerate, Raman-active, in-plane, E2g modes, with frequencies of 1582 and 42 cm–1, the former being known as the "G" mode. The lower frequency mode corresponds to shear motion of the two planes and can only be observed in instruments capable of recording frequencies well below 100 cm–1.
A continuum of structures of sp2 -bonded carbon has been observed, manufactured, and characterized. If one starts with graphite and grinds it into smaller crystallites, a "disorder" or D band appears (2) somewhere in the vicinity of 1280 and 1400 cm–1, depending upon the excitation wavelength (3). This band originally was assigned to scattering from the normally forbidden edge of the Brillouin zone, but was allowed because of the limited size of the crystallites. However, boron-doped crystals, in which the boron atoms are substitutional, also exhibit this behavior, which argues for symmetry breaking, rather than disorder or reduced crystallite size. In disordered materials, there is also a band at about 1620 cm–1, which often is called the "D'" band. A careful analysis of all the observations, including the inequivalence of the Stokes and anti-Stokes frequencies, indicates that a more coherent explanation invokes "double resonances" with electronic transitions (4).
The spectra of carbon fibers (made, for example, by pyrolyzing polyacrylonitrile) show the features described previously. Carbon fiber composites often are glued together with pyrolyzed organic resin that was impregnated in carbon fiber cloth previously, or by carbon deposited by chemical vapor deposition (CVD). The Raman spectrum of the deposited carbon also can be characterized by recording the G and D bands.
Among the most disordered of these materials is the CVD film called "diamond-like carbon," or DLC. This term is actually a misnomer. The lack of the sharp diamond band at 1332 cm–1 argues against the assignment to diamond. The spectrum of DLC actually shows the G and D bands, enormously broadened and overlapped. However, oddly, the material has physical properties approaching those of diamond — optical semi-transparency, electronic insulation, and high hardness. Today it is understood that films of DLC are composed of covalent mixtures of sp2 - and sp3 -bonded carbon (5), which can account for these physical properties. Because of these properties, DLC is used to coat every magnetic hard disk in every modern computer. Systematic analysis of the Raman spectra of DLC films by band-fitting has been used successfully to predict the tribological performance of the hard disk coatings (6).
Another material called "glassy carbon" is actually also a misnomer. Its spectrum shows the D band with higher intensity than the G band, and both bands are sharper than in other carbons, with high intensity in the D band. Glassy carbon is quite crystalline, but the crystallites are very small (7). Figure 1 shows the spectra of some of these common materials.
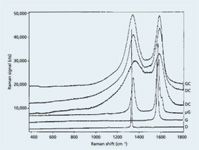
Figure 1: Raman spectra of diamond (D), graphite (G), microcrystalline graphite (µG), disordered carbons (DC) in various states of disorder, and glassy carbon (GC).
Fullerenes fall into two classes of materials. The so-called buckyballs are enclosed polyhedral balls, with C60 and C70 the most well known. The second class of material is the nanotube, which is composed of single- or multiwalled carbon nanotubes of rolled graphene sheets (graphene being a single layer of graphite). These tubes can be metallic, semiconducting, or insulating, depending upon the electronic structure, which is determined by the size, type, and chirality of the tube. (The chirality defines the axis of the graphene sheet around which the tube is conceptually formed.) The Raman spectra of these tubes have been characterized fully (8,9) in terms of their phonon behavior and double resonance with the possible electronic transitions. Raman has been found to be the technique of choice for characterizing the tubes because the frequency of the "radial breathing mode" in the region between 75 and 400 cm–1 is predictive of the size, type, and chirality of the tube. In addition, the E2g mode near 1580 cm-1 is observed to split, presumably due to the curvature of the tube, which removes the twofold degeneracy.
The full Raman spectra of a sample mixture of carbon nanotubes, excited at 785, 638, and 532 nm, are shown in Figure 2a. In the low-frequency radial breathing mode (RBM) region, multiple bands are observed because the sample is composed of tubes of a variety of sizes and chirality. Figure 2b shows the expanded low-frequency region with the observed RBM frequencies, which are seen to be dependent upon excitation wavelength, because of the strong resonance of the π system with the laser.

Figure 2: (a) Raman spectra of a carbon nanotube sample, excited, from top to bottom, at 785 nm (1200 g/mm grating), 638 nm (1800 g/mm grating), and 532 nm (2400 g/mm grating). The spectra were acquired on ExploRA with the OD = 1 neutral density filter. (b) The low frequency region of the carbon nanotube spectra showing the RBM bands whose observed frequencies are excitation wavelength dependent.
The Raman spectra of graphene, a single layer of graphite, and a finite number of graphene layers also have been studied (1). The most striking observation is the behavior of the second-order band near 2700 cm–1. In the spectrum of a single layer of graphene, this band is roughly four times as intense as the G band. In addition, its frequency more closely corresponds to the overtone of the D band than the G band, and it exhibits the same dispersion of frequency with excitation wavelength, and thus is termed the "2D" or D* band by many authors. In reality, when there is more than one graphene layer, the 2D band is composed of four components whose relative intensities depend upon the number of layers (up to five layers) and the excitation wavelength. Because of this, the Raman spectrum can be used to determine the number of layers of graphene in a film of five or fewer layers. The spectrum in this region also exhibits an overtone of the D' band at about 3250 cm–1.
Figure 3 shows spectra of one, two, and three layers of graphene, excited at 532 nm. As described in the preceding paragraph, this figure shows that the G band intensity is smaller than the 2D band in the spectrum of the single layer (bottom trace). It shows that the 2D' band at 3248 cm–1 does not change with number of layers, and it shows the changes in the 2D band with the number of layers.
In his review, Ferrari also discusses the effects of doping on the band positions, shapes, and relative intensities of bands in the spectra. Because of the future potential to engineer graphene onto integrated circuits, the ability to estimate dopant levels with a noncontact method will be invaluable.
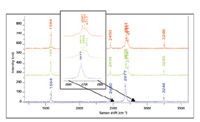
Figure 3: Raman spectra, from bottom to top, of one, two, and three graphene layers, excited at 532 nm, with the OD = 3 filter. These spectra were acquired on a Lab RAM Raman microscope (focal length = 460 mm) using a 1200-g/mm grating, and the 100x LWD objective. Integration time was 2 x 30 s.
Application
As an example of the use of Raman microscopy for the characterization of carbon materials, we will show some maps of a carbon composite. The information is encoded in details of the spectral features, which can be useful in engineering these materials.
Carbon composites are being used in aerospace applications (as well as some automotive, high-end sports, and helmet applications). In these materials, carbon fibers are woven into cloth and shaped into a "preform," which is then fused into a solid by one or more of a variety of methods that provide a matrix of carbon surrounding the fibers. These methods include impregnation and pyrolysis of organic resins, and chemical vapor deposition to fill the voids created during the pyrolysis. The advantages of carbon–carbon composites are that they are stiffer, stronger, and lighter than steel or other metals. They can be used at high temperatures, at which thermal shock resistance and a low thermal expansion coefficient are required. Consequently, they maintain their mechanical properties to temperatures above 2000 °C. While carbon–carbon composites are less brittle than conventional ceramics, they do lack impact resistance. For applications in missiles and the space shuttle, the surfaces have been converted to SiC to prevent atmospheric oxidation.
The material properties of these composites depend upon the fiber fraction, the fiber type, the textile weave, the properties of the fibers, and the properties of the matrix material. The properties of the fibers themselves depend upon the precursor material, the method of production, the degree of orientation, and the degree of graphitization, which in turn, will depend upon tensioning during fiber formation. Clearly, the effectiveness of the matrix material will depend upon precursor and manufacturing method, densification, and adhesion. Because of the high cost of production, carbon–carbon composite use is limited.
In order to assess how useful Raman interrogation can be in a carbon–carbon composite, polarized Raman maps were acquired. A polarized micrograph of a carbon–carbon composite that had been cross-sectioned and polished in a plane perpendicular to the fiber direction is shown in Figure 4. In crossed polars, the fibers are gray, while the spherulites are a mixture of bright white and black. It is well known that spherulites with mixed orientation will exhibit contrast in polarized light microscopy. The question is whether any further information can be provided by Raman microscopy.
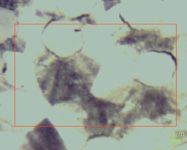
Figure 4: Polarized light micrograph of carbonâcarbon composite showing homogeneous lighting in the fiber cross-section but high contrast in the spherulites filling the matrix space.
Maps of the sample in the region denoted by the red box were collected with polarization conditions HH and VH. The hyperspectral cubes were subjected to multivariate analysis–direct classical least squares (MVA/DLCS) in LabSpec (Horiba Jobin Yvon, Edison, New Jersey). Four factors were required for adequate fitting of the HH data set, but only three factors were required for the VH set. Casual inspection of these spectra by a novice does not indicate meaningful differences, but anyone who has examined the Raman literature of carbons and graphite realizes that the subtleties in these results can be meaningful. Aside from differences in relative intensities, the D' band at 1620 cm–1 shows much better definition in some factors rather than others, and there is some systematic peak shifting in the D and 2D band. What do the Raman maps show? Do these factors segregate in the spatial regions seen on the micrograph? Figure 6 shows the images produced by modeling in the software for the two data sets.

Figure 5: Factors derived from the hyperspectral cube for (a) HH and (b) VH polarization. Note that when the VH data set was fit to four factors, like the HH set, the last factor provided no new information.
Remarkably, the "blue" factor maps only the fibers. There are two matrix factors in the HH image (pink and green), but they converge into one in the VH image (green), and both images show particles at the corners where the spherulites converge that again have different character (red). Thus, there is a correlation between the features seen in the photoluminescence microscopy (PLM) micrograph and the Raman images that follow from structural differences in the graphitic structures.
Conclusions
A brief overview of the Raman spectra of the various allotropes of carbon is presented with references to the literature. These materials are being implemented in engineered materials for electronic and mechanical applications with certain required thermal properties. The features in the Raman spectra that can be used to correlate with the required physical–chemical properties are indicated. As an example, polarized maps of a carbon composite are presented.
Acknowledgment
I want to thank my colleague, Eunah Lee, for the Raman maps that are presented in Figure 6.
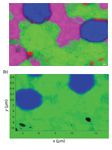
Figure 6: Raman maps for (a) HH and (b) VH polarization produced by modeling using the factors identified by the modeling function in LabSpec.
Fran Adar is the Worldwide Raman Applications manager for Horiba Jobin Yvon (Edison, NJ). She can be reached by email at: fran.adar@jobinyvon.com.
References
(1) A.C. Ferrari, Solid State Commun. 143, 47 (2007), available online 27 April 2007.
(2) F. Tuinstra and J.L. Koenig, J. Chem. Phys. 53m, 1126 (1970).
(3) Y. Wang, D.C. Alsmeyer, and R.L. McCreery, Raman Spectroscopy of Carbon Materials: Structural Basis of Observed Spectra Chem Mater. 2, 557–563 (1990).
(4) S. Reich and C. Thomsen, Raman Spectroscopy of Graphite, originally published on-line by the Royal Society 14 Sept. 2004 (10.1098/rsta.2004.1454) Phil. Trans. R. Soc. Lond. A 2271–2288 (2004).
(5) A.C. Ferrari and J. Robertson, Raman Spectroscopy of Amorphous, Nanostructure, and Diamond-like Carbon and Nanodiamond, Published online by The Royal Society 18 Sept 2004 (10.1098/rsta.2004.1452). Phil. Trans. R. Soc. Lond. A 362, 2477–2512 (2004).
(6) A. Whitley, The Use of Raman Spectroscopy to Monitor the Quality of Carbon Overcoats in the Disk Drive Industry, pp. 975–998, in Handbook of Raman Spectroscopy, I.R. Lewis and H.G.M. Edwards, Eds. (Marcel Dekker, New York, 2001).
(7) Professor William White, Penn State University, private communication.
(8) M.S. Dresselhaus and P.C. Eklund, Adv. in Physics 49, 705–814 (2000).
(9) C. Thomsen and S. Reich, Raman Scattering in Carbon Nanotubes, in Light Scattering in Solids IX, M. Cardona and Merlin, Eds. (Springer, Berlin, 2005).

Nanometer-Scale Studies Using Tip Enhanced Raman Spectroscopy
February 8th 2013Volker Deckert, the winner of the 2013 Charles Mann Award, is advancing the use of tip enhanced Raman spectroscopy (TERS) to push the lateral resolution of vibrational spectroscopy well below the Abbe limit, to achieve single-molecule sensitivity. Because the tip can be moved with sub-nanometer precision, structural information with unmatched spatial resolution can be achieved without the need of specific labels.
AI-Powered SERS Spectroscopy Breakthrough Boosts Safety of Medicinal Food Products
April 16th 2025A new deep learning-enhanced spectroscopic platform—SERSome—developed by researchers in China and Finland, identifies medicinal and edible homologs (MEHs) with 98% accuracy. This innovation could revolutionize safety and quality control in the growing MEH market.

.png&w=3840&q=75)

.png&w=3840&q=75)


.png&w=3840&q=75)


.png&w=3840&q=75)


