Raman Thermometry
Raman spectroscopy can be used to determine the temperature of a material when other more direct means are either impractical or not possible. The material’s temperature can affect the peak position of Raman bands. When a Raman band shifts significantly with temperature, the monitoring of the peak position can be the most straightforward manner of determining temperature provided the Raman spectrometer has sufficient spectral resolution. Another method is to determine the temperature from the ratio of the Stokes and anti-Stokes signal strengths of a given Raman band. The latter method requires the ability to detect light at wavelengths longer and shorter than that of the laser and an accurate measurement of the wavelength dependent instrument response function.
Raman spectroscopy can be used to determine the temperature of a material when other more direct means are either impractical or not possible. The material’s temperature can affect the peak position of Raman bands. When a Raman band shifts significantly with temperature, the monitoring of the peak position can be the most straightforward manner of determining temperature provided the Raman spectrometer has sufficient spectral resolution. Another method is to determine the temperature from the ratio of the Stokes and anti-Stokes signal strengths of a given Raman band. The latter method requires the ability to detect light at wavelengths longer and shorter than that of the laser and an accurate measurement of the wavelength-dependent instrument response function.
Raman spectroscopy is well known as an analytical method for identifying chemical compounds and characterizing the chemical bonding and solid-state structure of materials. Perhaps less well known is the fact that one can use Raman spectroscopy to determine the temperature of the material being analyzed. The temperature can be determined in one of two ways. If a Raman band is sufficiently narrow, the peak position can be seen to shift with temperature. As the temperature increases, the bond length will increase and consequently one can expect a decrease in the energy of the vibrational mode. Likewise, a decrease in temperature will lead to a shorter bond length and an increase in the energy of the vibrational mode. The increase or decrease in bond length causes a change in the vibrational force constant, which results in a shift of the Raman peak position. A second way of determining the temperature is to measure the signal strengths of a particular Raman band at the Stokes and anti-Stokes positions and calculate the temperature based on a Boltzmann distribution of the ground and first excited state populations. The expressions most frequently given to describe this relationship are shown in equations 1 and 2 (1):

where T is the temperature, k is Boltzmann’s constant, h is Planck’s constant, vl is the frequency of the laser, vv is the frequency of the vibrational mode (Raman band position), and the Stokes (IS) and anti-Stokes (IAS) Raman scattering strengths are based on energy detection of the signals. The means of experimentally detecting the Stokes and anti-Stokes Raman scattering is very important. The use of equation 1 is appropriate when spectra are acquired with energy-based detection, whereas equation 2 should be used when photon counting is the basis for detection (2,3). The spectra reported here were all acquired using a charge-coupled device (CCD) detector, a photon counting device, so equation 2 is more appropriate for the analysis of our data. An additional point about units should be clearly understood. Planck’s constant is in units of J·s and Boltzmann’s constant is in units of J/K. Therefore, vv must be in units of s-1 for units to cancel providing T in degrees Kelvin when rearranging equations 1 and 2 to calculate T.
Another important experimental consideration is the wavelength dependent instrument response function (IRF) of the Raman spectrometer. If one is to measure the signal strengths of the Stokes and anti-Stokes Raman bands, the photons detected will be of different absolute wavelengths. The wavelength-dependent sensitivity of the spectrometer must be accounted for if one is to accurately make use of either equation 1 or equation 2 for temperature determination. If the IRF is not correctly known, then one cannot determine the temperature accurately because the measured intensities do not reflect the true signal strengths of the Raman band pair. I have selected bands from the spectra of three materials that are near each other in terms of absolute wavelength so that any error in the characterization of the IRF will not contribute to the variability of the temperature measurements reported for these materials. Temperatures are calculated from the spectra of three single-crystal materials, namely Si, LiNbO3, and KTiOPO4.
The purpose or goal of this installment of “Molecular Spectroscopy Workbench” is to inform readers of the capability of Raman spectroscopy for the determination of temperature. It is not intended to be a thorough study comparing the two methods and reporting on their accuracy and precision. That would require many more measurements than are presented here and for a variety of materials and multiple bands within a material’s spectrum. Rather, the purpose is to introduce you to the capability of temperature determination by Raman spectroscopy so that you can decide to make use of it for those situations that you deem appropriate. I have included reference publications that may assist you in learning more about the use of Raman spectroscopy for determining temperature (4–12).
Temperature Response of an Opaque Semiconductor-Si
Raman spectra of Si, LiNbO3, and KTiOPO4 were acquired using a Horiba LabRAM HR Evolution Raman spectrometer with 532-nm excitation and a Synapse back-illuminated deep depleted CCD detector. The detector is a photon-counting device and so equation 2 should be more appropriate for determining temperature from spectra acquired under these conditions. Samples were placed in a Linkam TST350 stage for temperature control, and a long-working-distance Olympus LMPlanFL N 50× objective was used to deliver laser excitation and collect the backscattered light.
The first measurements that we will consider are from single-crystal Si. A room-temperature spectrum consisting of Stokes and anti-Stokes Raman scattering is shown in Figure 1. You should notice a significant difference between the Stokes and anti-Stokes signal strengths, which are related to the populations of the ground and first excited vibrational states, respectively. (Technically, I should be referring to populations of phonon states; however, I will use the language of molecular spectroscopy for pedagogical purposes.) At room temperature the partition function informs us that the population of the ground state will be much higher than that of the excited state for an oscillator with energy proportional to 520 cm-1. Consequently, we can expect that the higher the energy of the vibrational mode is, the lower the population of the excited state and therefore the weaker the signal strength of the anti-Stokes Raman band will be.
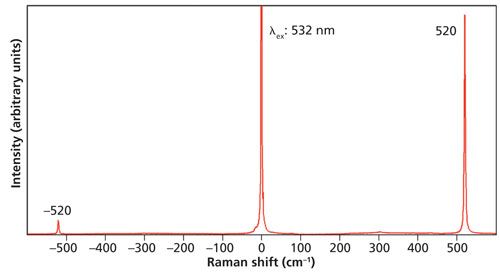
Figure 1: Raman spectrum of Si.
A small Si (100) chip was placed in the LinkamTST350 stage and the temperature was varied from room temperature to a maximum 150 °C in increments of 25 °C. Stokes and anti-Stokes Raman spectra were acquired at each temperature. Signal strengths IS and IAS were determined by measuring the counts at the Raman peak maximum and subtracting the counts at the baseline. One might ask whether it would be more reliable to measure the peak area rather than peak height as a measure of signal strength. Note that the intensities to be inserted into equations 1 or 2 are for a single frequency. Therefore, the peak area of a broad Raman band will introduce error into the temperature calculation. A peak area can give similar results to that of peak intensity for a narrow band such as that of Si, but broader bands of widths greater than 10 cm-1 will manifest significant differences in temperatures calculated from peak areas and peak heights.
The stage’s temperature control setting and temperatures of the Si sample calculated using equations 1 and 2 are shown in Table I.
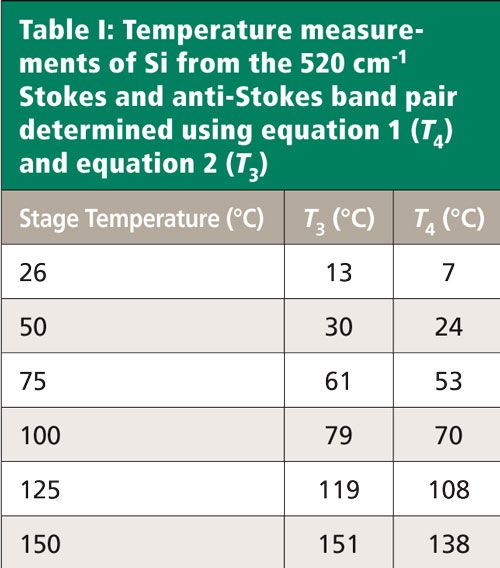
The temperatures determined using equation 2 (T3) rather than those of equation 1 (T4) are closer to those of the stage as set by the controller. We would expect better agreement of T3 temperatures with those of the stage controller because our detection is with a CCD photon counting device. However, the differences between the stage temperature and T3 are significant below 100 °C. There is much better agreement at 125 °C and 150 °C. Of course, these are only single spectra and a statistically significant number of spectral measurements should be made when determining the temperature of a material.
As discussed earlier, the Raman band position can change with temperature because of the change in bond length and vibrational force constant. The Stokes Raman spectra of Si acquired at the various temperatures are shown in Figure 2. The spectra are all plotted on the same intensity scale. The peak position of the Raman band at room temperature is 520.6 cm-1 and the band shifts to progressively lower energy, reaching 517.3 cm-1 at 150 °C. The cluster of four spectra obtained at temperatures of 100 °C and lower are significantly stronger than the two obtained at 125 °C and 150 °C. There should not be such a sudden drop in signal strength from 100 °C to 125 °C. The abrupt change in signal suggests an error in spectral acquisition, and the stronger Stokes signals between room temperature and 100 °C are consistent with calculated temperatures lower than those of the stage control.
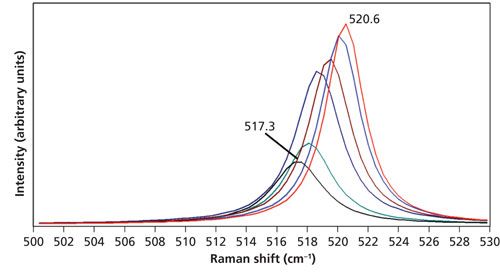
Figure 2: Raman spectra of Si acquired at 26 °C (red), 50 °C (blue), 75 °C (brown), 100 °C (navy), 125 °C (green), and 150 °C (black). The spectra are all plotted on the same intensity scale.
There are several important observations to make from these measurements. First is the significant drop in Stokes signal strength as the temperature increases. The corresponding anti-Stokes bands (not shown) manifest an increase in signal strength with increasing temperature. The second observation is the shift of the Raman band to lower energy with increasing temperature. This shift can be understood as the bond length increasing with temperature and a commensurate reduction in the chemical bond’s vibrational force constant. Consequently, one can use the peak position of a specific Raman band for a particular material as a measure of the temperature. Of course, the peak shift method requires the accurate control of the reference material’s temperature, and perhaps measurement by independent means, to calibrate the Raman spectra as a method of temperature measurement.
Temperature Response of an Electro-Optic Material-LiNbO3
A 0.5-mm-thick single crystal of LiNbO3 was analyzed over the same temperature range as that for Si. A Stokes and anti-Stokes Raman spectrum of one face of the LiNbO3 crystal acquired at room temperature is shown in Figure 3. This spectrum very nicely demonstrates how the energy of the vibrational mode directly affects the populations of ground and excited states. Note how intense the anti-Stokes band at -153 cm-1 is compared to its Stokes counterpart at 153 cm-1. As one moves to higher energy in the Stokes spectrum, the corresponding anti-Stokes band becomes progressively weaker. That decrease in signal strength occurs because the thermal energy at room temperature is insufficient to populate the excited states of vibrational modes at higher energy. A good example of this is the signal strength of the Stokes Raman band at 872 cm-1 compared to that of the anti-Stokes band at -872 cm-1. The Stokes Raman band at 872 cm-1 is quite strong whereas the anti-Stokes counterpart is very weak. A weak anti-Stokes band with a low signal-to-noise ratio can lead to temperature determinations that are both inaccurate and imprecise even with a statistically significant number of measurements. Consequently, this Raman band pair would not be a good choice for temperature determination based upon the Stokes and anti-Stokes intensity ratios.
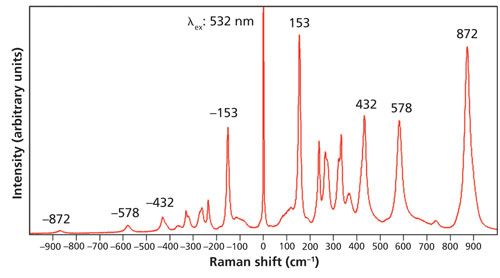
Figure 3: Raman spectrum of a LiNbO3 single crystal.
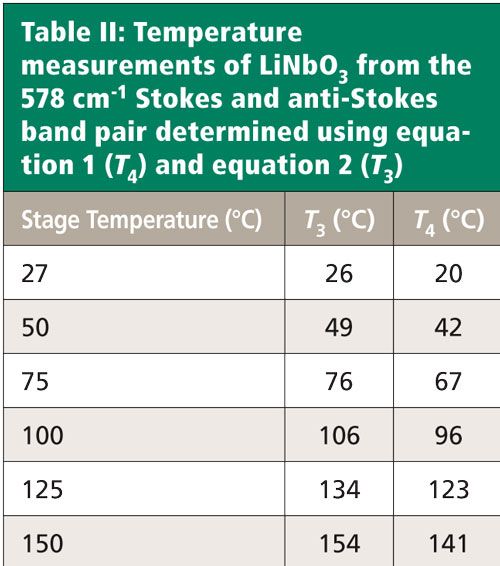
The LiNbO3 crystal was placed in the thermal stage. Temperatures ranging from room temperature to 150 °C were set, and spectra were acquired in 25 °C increments. The stage temperatures along with those determined from the acquired spectra based on equations 1 and 2 are shown in Table II. The temperatures were calculated based upon the signal strengths of the Stokes and anti-Stokes bands at 578 and -578 cm-1, respectively. This time we see that there is good agreement between the stage temperature and the determined values, particularly with T3. The 578 cm-1 Stokes peaks used for these temperature determinations are shown in Figure 4. Notice that unlike the Si Stokes bands, the LiNbO3 578 cm-1 band does not shift significantly with changing temperature. The peaks associated with temperatures from 27 °C through 100 °C are at 578.0 cm-1, and the 150 °C spectrum manifests a shift to 576.0 cm-1. The spectra are all plotted on the same intensity scale. One can see that the Stokes signal is indeed decreasing with increasing temperature. Although not shown in the figure, the anti-Stokes signal strength is increasing with higher temperature, yielding the increased temperature by calculation.
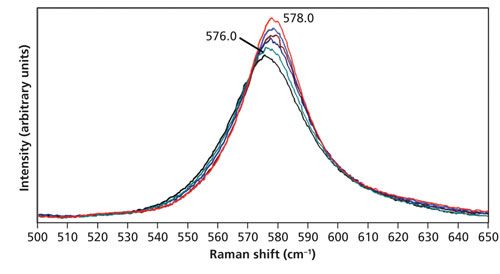
Figure 4: Raman spectra of LiNbO3 acquired at 27 °C (red), 50 °C (blue), 75 °C (brown), 100 °C (navy), 125 °C (green), and 150 °C (black). The spectra are all plotted on the same intensity scale.
The choice of the 578 cm-1 peak temperature determination by Stokes and anti-Stokes signal strength is made because it consists of a single Raman band and manifests a small shift with increasing temperature. In fact, it is only at 100 °C that one can detect a shift to lower energy from the 578.0 cm-1 peak at room temperature. In contrast, consider the peaks in the region from 250 cm-1 to 350 cm-1 of the same spectra shown in Figure 5. At room temperature, there is a band at 331.5 cm-1 with a partially resolved shoulder at 322.0 cm-1. As the temperature increases, the 331.5 cm-1 band shifts to lower energy reaching 327.1 cm-1 at 150 °C and the original shoulder at 322.0 cm-1 can no longer be resolved. The band now appears to be one peak with asymmetric broadening on the low-energy side. Likewise, there is a band at 263.6 cm-1 with a partially resolved peak at 273.0 cm-1 at room temperature. As the temperature increases, the 273.0 cm-1 peak vanishes and a single peak with asymmetric broadening to the high-energy side emerges. These peak shifts and mergers of adjacent bands into single bands illustrate the importance of peak selection when determining the temperature based upon the Stokes and anti-Stokes intensities. Temperature determination by Stokes and anti-Stokes signal strength is best applied to a single band whose shift is minimal with temperature change.
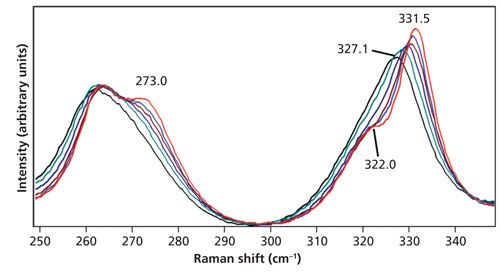
Figure 5: Raman spectra of LiNbO3 acquired at 27 °C (red), 50 °C (blue), 75 °C (brown), 100 °C (navy), 125 °C (green), and 150 °C (black). The spectra are all plotted on the same intensity scale.
Temperature Response of a Nonlinear Optical Material-KTiOPO4
A 1-mm-thick single crystal of KTiOPO4 was analyzed over the same temperature range as that for Si. A Stokes and anti-Stokes Raman spectrum of one face of the KTiOPO4 single crystal acquired at room temperature is shown in Figure 6. Once again we see how the anti-Stokes band strength diminishes with increasing energy of the vibrational mode because of the decreased population of the excited state. The most intense Stokes band at 764 cm-1 is very weak at -764 cm-1. Note that the cluster of bands in the region near 1000 cm-1 cannot be seen in the anti-Stokes spectrum. There are many bands from which to choose for our temperature determination. I select the pair at 517 cm-1 and -517 cm-1 because it is a single band and it appears in the same spectral regions for which we made our Si and LiNbO3 temperature determinations.
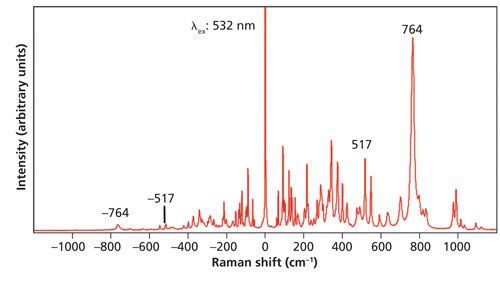
Figure 6: Raman spectrum of a KTiOPO4 single crystal.
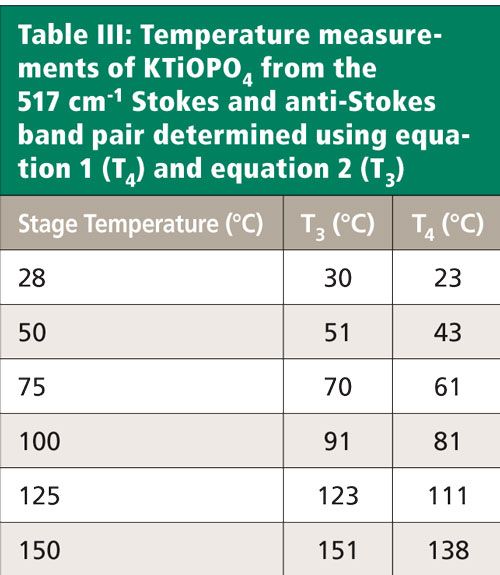
The 517 cm-1 Stokes peaks acquired in the range from room temperature to 150 °C and used for these temperature determinations are shown in Figure 7. As expected, there is a decrease in signal strength as the temperature increases. Conversely, the anti-Stokes bands (not shown) increase in strength with increasing temperature. Note how very little the band changes shape or peak position with increasing temperature. In contrast, the bands in the region from 270 cm-1 to 375 cm-1 shown in Figure 8 manifest significant shifts with increasing temperature. Consequently, we would expect the Stokes and anti-Stokes signal strengths of the 517 cm-1 band to yield a good temperature determination and indeed we find good agreement between the stage temperature and T3 as shown in Table III.
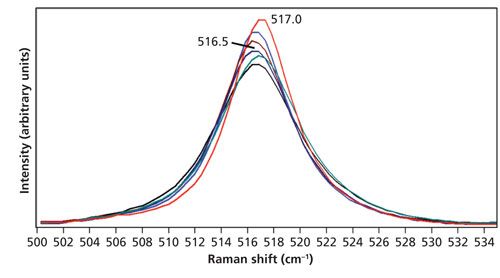
Figure 7: Raman spectra of KTiOPO4 acquired at 28 °C (red), 50 °C (blue), 75 °C (brown), 100 °C (navy), 125 °C (green), and 150 °C (black). The spectra are all plotted on the same intensity scale.
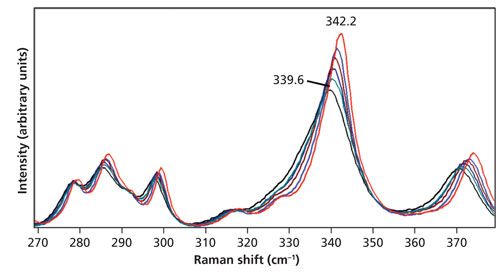
Figure 8: Raman spectra of KTiOPO4 acquired at 28 °C (red), 50 °C (blue), 75 °C (brown), 100 °C (navy), 125 °C (green), and 150 °C (black). The spectra are all plotted on the same intensity scale.
Conclusion
Raman spectroscopy has been shown to be capable of determining the temperature of a material by two methods. The measurement of the Stokes and anti-Stokes signal strengths of a Raman band can be used to determine the temperature. The Stokes and anti-Stokes ratio method works best for Raman bands that don’t shift significantly with a change in temperature. Some Raman bands shift more than others with a change in temperature. The peak shift method requires the accurate control of the reference material’s temperature, and perhaps measurement by independent means, to calibrate the Raman spectra as a method of temperature measurement.
References
- S.D. McGrane, D.S. Moore, P.M. Goodwin, and D.M. Dattelbaum, Appl. Spec.68, 1279–1288 (2014).
- J.J. Gallardo, J. Navas, D. Zorrilla, R. Alcantara, D.Valor, C. Fernandez-Lorenzo, and J. Martin-Calleja, Appl. Spec.70, 1128–1136 (2016).
- B.J. Kip and R.J. Meier, Appl. Spec.44, 707–711 (1990).
- M. Malyj and J.E. Griffiths, Appl. Spec.37, 315–333 (1983).
- T.E. Beechem and J.R. Serrano, Spectroscopy26(11), 36–44 (2011).
- G.E. Jellison Jr., D.H. Lowndes, and R.F. Wood, Phys. Rev. B 28, 3272–3276 (1983).
- X.J. Gu, J. Raman Spec.27, 83–85 (1996).
- B. Stoib, S. Filser, J. Stötzel, A. Greppmair, N. Petermann, H. Wiggers, G. Schierning, M. Stutzmann, and M.S. Brandt, Semicond. Sci. Technol.29, 124005 (2014).
- C.B. Saltonstall, J. Serrano, P.M. Norris, P.E. Hopkins, and T.E. Beechem, Rev. Sci. Instruments 84, 064903 (2013).
- N. Lundt, S.T. Kelly, T. Rödel, B. Remez, A.M. Schwartzberg, A. Ceballos, C. Baldasseroni, P.A.F. Anastasi, M. Cox, F. Hellman, S.R. Leone, and M.K. Gilles, Rev. Sci. Instruments84, 104906 (2013).
- J.S. Reparaz, E. Chavez-Angel, M.R. Wagner, B. Graczykowski, J. Gomis-Bresco, F. Alzina, and C.M. Sotomayor Torres, Rev. Sci. Instruments85, 034901 (2014).
- J. Ocenasek and J. Voldrich, J. Appl. Phys.118, 233104 (2015).

David Tuschel is a Raman applications manager at Horiba Scientific, in Edison, New Jersey, where he works with Fran Adar. David is sharing authorship of this column with Fran. He can be reached at: SpectroscopyEdit@UBM.com

Newsletter
Get essential updates on the latest spectroscopy technologies, regulatory standards, and best practices—subscribe today to Spectroscopy.
Nanometer-Scale Studies Using Tip Enhanced Raman Spectroscopy
February 8th 2013Volker Deckert, the winner of the 2013 Charles Mann Award, is advancing the use of tip enhanced Raman spectroscopy (TERS) to push the lateral resolution of vibrational spectroscopy well below the Abbe limit, to achieve single-molecule sensitivity. Because the tip can be moved with sub-nanometer precision, structural information with unmatched spatial resolution can be achieved without the need of specific labels.