Refractive Index and Thickness Analysis of Natural Silicon Dioxide Film Growing on Silicon with Variable-Angle Spectroscopic Ellipsometry
October 2006. The authors investigate the optical properties and thickness of natural SiO2 thin films grown on silicon substrates simultaneously with a VASE system by choosing different angles of incidence and wavelength ranges.

In the electronics industry, the main application of silicon dioxide (SiO2) is used as the gate oxide in the manufacture of semiconductor devices (MOSFETs) and as an insulation layer. With fast progress in integration density, the importance of thin-gate oxides with thicknesses less than 7 nm increases (1). Moreover, transistors are expected to use a gate dielectric with capacitance equivalent to 2–3 nm of SiO2. These trends require thickness and optical constants measurement techniques for such thin SiO2 films.
Techniques suitable for measuring thin insulating films on semiconductors are ellipsometry, X-ray photoemission spectroscopy (XPS), transmission electron microscopy (TEM), Rutherford backscattering, and electrical methods of capacitance-voltage (C-V). The electronic structure, properties of ultrathin gate oxides, and imaging of individual dopant atoms and clusters in bulk Si at the atomic scale have been investigated with TEM (2–4). Ellipsometry also has been used to determine the optical properties of SiO2 (5). It has a very high resolution and accuracy like C-V among these techniques. Moreover, the ellipsometric technique has been the most sensitive to oxide thickness as thin as 2 nm or less. When films are very thin, the optical pathlength is very small compared to the wavelength, so it becomes difficult to determine the index. In most work (6,7), bulk SiO2 index values are used and only the thickness is fit while considering that is difficult to determine simultaneously thickness and index. Existence of correlation between index and thickness for very thin films makes it not reasonable to use the refractive index of SiO2 bulk for a film with a thickness less than 10 nm, because it was known that the optical properties including the refractive index of ultrathin SiO2 films were different from those of thick films (8–10).
Errors in the fixed SiO2 index values translate into errors in film thickness, but these thickness errors are usually only a fraction of a monolayer for native oxides. This level of error traditionally has been acceptable in semiconductor manufacturing. However, in modern circuits, the oxide films are becoming very thin, so effects of oxide index and interface layers are becoming important. How to model these thin layers and determine simultaneously the refractive index and thickness for more accurate results should be considered. However, the difference of ellipsometric parameters between two ultrathin films was so little that the deduced values of the refractive index and thickness were very sensitive to errors within ellipsometric parameters. In this article, we propose a scheme to simultaneously obtain more accurate refractive index and thickness of natural SiO2 films.
Variable angle spectroscopic ellipsometry (VASE) measures the changes in the polarization state of light as a function of the angle of incidence and wavelength when light is reflected from or transmitted through a sample. Details of the VASE technique are described elsewhere (11–13). In this article, VASE was used to determine the thickness and the refractive index of natural SiO2 thin films and also investigate the effectiveness of various optical models.
Experimental
Sample Preparation: The silicon substrates were silicon wafers with a <100> orientation. They were boron-doped, p-type with resistivity in the range 2~4 Ωcm. The oxides were naturally grown, "native" oxide films on the Si substrates. The films were assumed isotropic and homogenous for the ellipsometric analysis.
Analysis Method: The ellipsometric parameters Ψ and Δ are defined by tanΨ = |Rp|/|Rs| and Δ = Δp – Δs where Rp = |Rp| exp(IΔp) and Rs = |Rs| exp(IΔs) are the complex reflection coefficients for p and s polarized parts, respectively (9). In this article, data were acquired with a VASE ellipsometer made by J.A. Woollam Co. (Lincoln, Nebraska). This rotating analyzer system was equipped with an autoretarder unit allowing Δ to be measured accurately over a full 360° range. Ψ and Δ were acquired at several angles of incidence ranging between 74° and 80° over the spectral range 220–1100 nm in steps of 10 nm. At each measured wavelength, Ψ and Δ data measured at multiple angles of incidence provided the possibility of determining more unknown parameters simultaneously. Optical modeling and data analysis were performed with the WVASE32 software package.
The mean square error (MSE) was the evaluation of the match quality between measurement (exp) and model data (mod), and was defined according to the Levenberg–Marquardt algorithm as:

where N was the number of measured Ψ and Δ pairs, M was the total number of real valued fitting parameters, and σΨ and σΔ were the standard deviations on the experimental data. To deduce the most approximate estimates, it was required that 2N ≥ M and minimize the MSE.
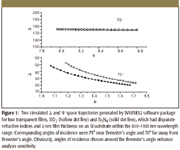
Data Analysis and Discussion: All measurements were taken at room temperature. Three kinds of unknown quantities need to be determined: the film thickness (th), the real part of the refractive index (n), and the imaginary part (extinction coefficient k). Optimal use of the ellipsometric technique critically depended on the choice of the angle of incidence (φ) and wavelength (λ). To determine an approximate unknown quantity, it was desirable to find a suitable region of spectral range and the angle or angles of incidence. It is difficult to know these selections precisely. The angle of incidence chosen around the Brewster's angle or the quasi-Brewster's angle (Δ = 90°) might enhance analysis sensitivity (14). For instance, Figure 1 shows two simulated Δ and Ψ space trajectories generated by the WVASE32 software package for two transparent films, SiO2 and Si3N4, which had disparate refractive indices (approximately 1.47 and 2.00, respectively), and 2-nm film thickness on an Si substrate within the 850–1100 nm wavelength range and corresponding angles of incidence 75°, which was near Brewster's angle, and 70°, which was far away from Brewster's angle. It could be seen that two trajectories diverge as the angle of incidences approach Brewster's angle and converge for angles of incidence far away from the Brewster's angle.

Figure 1
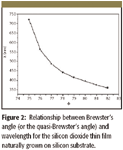
The spectral range for measurements was varied with the angle of incidence, because the Brewster's angle or quasi-Brewster's angle was dependent upon wavelength. The relationship between the wavelength and the angle of incidence that we obtained for the sample system when Δ = 90° is shown in Figure 2. The accurate results could not be obtained with a single angle of incidence over the full region from 220 nm to 1100 nm according to Figure 2, so that the data with variable angles of incidence and various ranges of wavelength should be acquired.

Figure 2
There was no direct access to optical constants and the thickness of the film from ellipsometric measurements, so modeling was required to deduce the sample's properties from the measured ellipsometric parameters. A model is an idealized mathematical representation of the sample. To construct a model, one has to assume each layer's thickness, dielectric functions, and composition, respectively. If the model is not good enough, it is impossible to accurately deduce the sample's properties. Generally, it is good practice to start from the simplest model with the fewest parameters used in the process of fitting. Therefore, the simplest three phase model of an air-SiO2-Si system was studied at first.

Table I: Measurement conditions and deduced results with a simple model of the air-SiO2âSi system
Air-SiO2-Si System
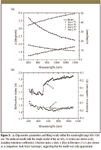
The optical constants of Silicon substrates were taken from the literature (15) and were not allowed to vary during the fitting. For the model of a single homogenous SiO2 layer on a substrate, n, k, and th of the SiO2 could be deduced from ellipsometric parameters Ψ and Δ. Because the number of unknown parameters was M = 3, the number of angles of incidence was required to be N ≥ 2. First fit th of SiO2 only using literature reference values for n and k of SiO2, which will be helpful to find a very good initial thickness for fitting. Then adding n and k of SiO2 to fit should help avoid abnormal results in n and k. The spectral range was chosen by fitting n, k, and th in a narrow spectrum. Once an acceptable fitting was achieved, the spectral range could be extended gradually until some regions appeared that could not fit to the data well. The measurement conditions and results are illustrated in Table I and Figure 3.

Figure 3
The results obtained at 290 nm and 360 nm were abnormal, and were mostly influenced by the absorption peak of substrate Si. The ellipsometric parameters Ψ and Δ fit to the experimental data over the spectral range 220–1100 nm, and as an example, the part of 850–1100 nm is shown in Figure 3a. Table I shows that thicknesses of SiO2 were almost equal in seven spectral regions, and their relative errors were only within 4%. As a comparison, n and k of SiO2 were also fixed at the values taken from the literature (16), and the relative error of the thickness of SiO2 (thn,k) obtained in the same seven spectral regions was 7% and MSE was larger than 1.0.
Figure 3b shows the deduced n value (dotted line) compared with previously published data (16) (solid line). Their difference was |δn| ≤ 0.07, but the large deduced extinction coefficient k value indicated the fit was not very good, although MSE was below 1.0, and the results were only approximate. Considering the natural SiO2 film was ultrathin and the interface layer between SiO2 and Si could not be neglected, we added an interface layer to configure a four phase model of the air-SiO2-interface-Si system discussed below.

Table II: Measurement conditions and deduced results with the model of the air-SiO2âSi system
Air-SiO2-Interface-Si System
The thin interface between the dioxide and the substrate was modeled as 50% Si and 50% SiO2 using a Bruggeman effective medium approximation (EMA) (16) and is a commonly used approach to model the optical constants of intermixed layers. The percentage was fixed at 50% in order to reduce the number of unknown parameters. Simultaneously fitting the thickness and optical constants of the SiO2 and the interface (thinter) requires N ≥ 3. The measurement conditions and results are shown in Table II and Figure 4.

Figure 4
Figure 4a shows the ellipsometric parameters Ψ and Δ fitted to the experimental data within the range 850–1100 nm. Figure 4b shows |δn| ≤ 0.05 and k ≤ 0.09. The relative errors of thickness decreased to below 3%, and the MSE was also less than that of the last model according to Table II. All of these indicated that the model was superior to the air-SiO2-Si system. Previous work by other authors employing ellipsometry also studied the interface layers between Si and SiO2 (8,17–19). The system and measurement errors brought the errors in n and k in the same order, but the errors in k looked obvious because the theoretical k was quite close to zero. Moreover, all the measurements were taken in the open air, so the results can be influenced easily by the conditions of the surrounding air. For instance, the adsorption of water made it difficult to obtain k accurately. These tiny factors can cause noticeable influence because ellipsometry, particularly ellipsometric parameter Ψ, is quite sensitive to even tiny variations on surfaces. All these could be considered so that k ≤ 0.09 looked reasonable.
Air-Surface Roughness-SiO2-Interface-Si System
We also investigated the surface roughness layer above the SiO2 layer, namely, the air-surface roughness-SiO2-interface-Si system. Similarly, the surface roughness layer was modeled as a 50:50 mixture of oxide and void using the Bruggeman effective medium approximation (16). Fits were not improved. Furthermore, adding the thickness and optical constants (or the EMA layer fraction) of the surface roughness layer as the fitted parameters, the number of unknown parameters would be 9, and it required N ≥ 5. In the same way, the results obtained were also not good enough to show any improvement.
These proved that the model could not be improved by considering a surface roughness layer. The reason might be that the amount of useable information in the Ψ and Δ data already has been exhausted in the thickness and index parameters of the oxide and interface layers. Adding additional fit parameters does not improve the fits. The model is not sensitive to additional parameters.
Conclusions
The optical properties and thickness of natural SiO2 thin films grown on silicon substrates were investigated simultaneously with a VASE system by choosing different angles of incidence and wavelength ranges. Results are better than previous results, in which the refractive index of silicon dioxide layer was fixed to reference values. The simple model of the air-SiO2–Si system was proved for determining the approximate film thickness and refractive index over the range 220–1100 nm. More precise fittings were achieved by adding an interface layer between SiO2 and Si under the optimized conditions of angles of incidence and wavelength ranges.
Acknowledgments
We gratefully acknowledge the National Natural Science Foundation of China and the Chinese Academy of Sciences for their support.
Yanyan Chen and Gang Jin are with Institute of Mechanics, Chinese Academy of Sciences, Beijing, China. Yanyan Chen is also with Graduate School of the Chinese Academy of Sciences, Beijing, China. They can be contacted at: gajin@imech.ac.cn
References
(1) A.C. Diebold, D. Venables, Y. Chabal, D. Muller, M. Weldon, and E. Garfunkel, Mat. Sci. Semicond. Process. 2, 103–147 (1999).
(2) D.A. Muller, T. Sorsch, S. Moccio, F.H. Baumann, and G. Timp, Nature 399, 758–761 (1999).
(3) J.B. Neaton, D.A. Muller, and N.W. Ashcroft, Phys. Rev. Lett. 85, 1298–1301 (2000).
(4) P.M. Voyles, D.A. Muller, J.L. Grazul, P.H. Citrin, and H.J.L. Gossmann, Nature 416, 826–829 (2002).
(5) G.L. Tan, M.F. Lemon, R.H. French, and D.J. Jones, Phys. Rev. B 72, 205117-1–205117-10 (2005).
(6) G. Hinrichs and D. Preikszat, Solid-State Electron. 39(2), 231–235 (1996).
(7) H. Reisinger, H. Oppolzer, and W. Hönlein, Solid State Electron. 35(6), 797–803 (1992).
(8) EA. Taft and L. Cordes, J. Electrochem. Soc. 126, 131–134 (1979).
(9) A. Kalnitsky, S.P. Tay, J.P. Ellul, S. Chongsawangvirod, J.W. Andrews, and E.A. Irene, J. Electrochem. Soc. 137, 234–238 (1990).
(10) G.E. Jellison, Jr., Thin Solid Films 206, 294–299 (1991).
(11) S.A. Alterovitz, J.A. Woollam, and P.G. Snyder, Solid State Technol. 31, 99–102 (1988).
(12) J.A. Woollam and P.G. Snyder, Mat. Sci. Eng. B. 5, 279–283 (1990).
(13) R.M.A. Azzam and N.M. Bashara, Ellipsometry and Polarized Light (North Holland Publishing, New York, 1977).
(14) P.G. Snyder, M.C. Rost, G.H. Bu-Abbud, and J.A. Woollam, J. Appl. Phys. 77, 1715–1724 (1995).
(15) C.M. Herzinger, B. Johs, W.A. McGahan, and J.A. Woollam, J. Appl. Phys. 83, 3323–3336 (1998).
(16) D.A.G. Bruggeman, Ann. Phys. 24, 636–679 (1935).
(17) Q. Liu, J.F. Wall, and E.A. Irene, J. Vac. Sci. Technol. A 12(5), 2625–2633 (1994).
(18) C.M. Herzinger, B. Johs, W.A. McGahan, J.A. Woollam, and W. Paulson, J. Appl. Phys. 83(6), 3323–3336 (1998).
(19) D.E. Aspnes and J.B. Theten, J. Electrochem. Soc. 127, 1359–1365 (1980).

Newsletter
Get essential updates on the latest spectroscopy technologies, regulatory standards, and best practices—subscribe today to Spectroscopy.
The Rising Role of Near-Infrared Spectroscopy in Biofuel Innovation
July 25th 2025A new bibliometric study published in Infrared Physics & Technology highlights the growing global impact of near-infrared (NIR) spectroscopy in biofuel research, revealing key trends, contributors, and future directions for advancing sustainable energy solutions.
Best of the Week: The Emerging Leader in Molecular Spectroscopy, Big Pharma’s Manufacturing Shift
July 25th 2025Top articles published this week include a feature article about big pharma’s investments in U.S.-based manufacturing, an article about the 2025 Emerging Leader in Molecular Spectroscopy Lingyan Shi, and some news items detailing the winners of the Coblentz Society’s student awards.