Simultaneous Determination of Methylxanthines and Cotinine in Human Plasma by Solid-Phase Extraction Followed by LC–MS-MS
Special Issues
A multiresidue method has been developed and validated for the analysis of methylxanthines (caffeine and its metabolites) and cotinine in human plasma.
A multiresidue method has been developed and validated for the analysis of methylxanthines (caffeine and its metabolites) and cotinine in human plasma. The method involves off-line solid-phase extraction (SPE) and analysis by liquid chromatography coupled to tandem mass spectrometry (LC–MS-MS) with electrospray ionization (ESI) in positive mode. The developed and validated method was fast, selective, and convenient for the simultaneous determination of cotinine, caffeine, and its metabolites in human plasma. The method has been successfully applied to the analysis of 500 samples from pregnant women in a clinical study.
The determination of methylxanthines in human plasma or urine is based on liquid chromatography (LC) coupled to spectrophotometric detection (UV) or mass spectrometry (MS). UV detection provides low selectivity since endogenous compounds present in biological fluids may interfere with the target analytes. Liquid chromatography coupled to single mass spectrometry (LC–MS) (1,2) or tandem mass spectrometry (LC–MS-MS) (3,4) has been recently applied for the analysis of methylxanthines in human biofluids.
LC–MS-MS provides better sensitivity and selectivity compared to LC–MS. Published LC–MS and LC–MS-MS methods are based on direct injection of the sample before LC column-switching (2) or centrifugation–filtration followed by dilution of the sample to reduce matrix impact on the chromatographic determination (3,4).
The most frequently used technique for the determination of cotinine in human fluids is gas chromatography coupled to mass spectrometry (GC–MS). Recently, LC–MS and LC–MS-MS have been successfully applied for the analysis of cotinine in biological matrices (5).
The analytical method described in this paper is based on solid-phase extraction (SPE) followed by LC–MS-MS analysis with electrospray ionization (ESI) and allows a simultaneous determination of cotinine and four methylxanthines in human plasma, which is useful to assess human exposure to tobacco smoke and coffee consumption. The validated method was successfully applied to the analysis of plasma from pregnant women in a clinic study.
Experimental
The samples used for these analyses were taken from 500 pregnant women (recruited in the period 1997 to 2002). An ethylenediaminetetraacetic acid (EDTA) blood sample was taken from the women at their first antenatal visit at their general practitioners. The blood sample was forwarded on to the biological bank for the Danish National Birth Cohort (6). After recruitment at the biological bank, the sample was centrifuged and separated in plasma and buffy coat, which were cooled with liquid nitrogen and stored at -30 °C. The Scientific Ethic Committee of Central Denmark approved the study (M-20080113).
Chemicals
Caffeine, theobromine, 1,7-dimethylxanthine, theophylline, and cotinine were purchased from Sigma Aldrich as neat compounds or solutions in methanol. Theobromine D6, 1,7-dimethylxanthine D6, and cotinine D3 were from Sigma Aldrich. Caffeine 13C3 and theophylline 13C2 15N2 were from Cambridge Isotope Laboratories. High performance liquid chromatography (HPLC)grade methanol and acetic acid were from Merck. Pure water used in the LC mobile phase and in extraction was purified with Super Q apparatus (Millipore). Primary stock solutions of the analytes were prepared in methanol or 50:50 (v/v) methanol–water for theobromine. The internal standard stock solution was prepared in methanol and further diluted with water to obtain a working solution at a concentration of 100 ng/mL. Calibration standards were prepared by spiking 100 μL of rabbit serum (Sigma Aldrich) at the following concentrations: 40 ng/mL, 100 ng/mL, 200 ng/mL, 400 ng/mL, and 800 ng/mL. The calibration standards followed the same extraction procedure as the samples and were extracted every second batch of samples.
Instrumentation
The LC–MS-MS system consisted of an Agilent 1200 series LC system (Agilent Technologies) and a QTrap 5500 triple-quadrupole mass spectrometer (AB Sciex) equipped with an ESI source. The analytes were separated on a 150 mm × 2.1 mm, 2.7-μm dp Ascentis Express RP Amide column (Supelco). Analyst software 1.5.1 (AB Sciex) was used for system control and data processing.
The composition of the mobile phase was 83% A (1% acetic acid in water) and 17% B (methanol) and the flow rate was 0.2 mL/min run isocratically. The injection volume was 10 μL.
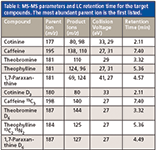
The ESI source was operated in positive mode at a temperature of 600 °C and an ion spray voltage of +4500 V. Nitrogen was used as the collision gas. The analyses were performed with a multiple reaction monitoring (MRM) method that monitored two mass transitions (parent ion and product ion) for each analyte, with the exception of theobromine for which only one transition ion was obtained. The values of the voltages applied to the sampling cone, focusing lenses, collision cell, and quadrupoles were optimized in MRM mode by direct infusion of a solution containing the analytes. The precursors and product ions for each analyte, together with the applied collision energy, are summarized in Table I. Detection was based on retention time and the most abundant mass transition corresponding to an authentic standard. Confirmation of analyte identity was based on the relative response of the secondary mass transition to the primary mass transition.

Table I: MS-MS parameters and LC retention time for the target compounds. The most abundant parent ion is the first listed.
Sample Preparation
Plasma samples (100 μL) were spiked with the labeled standards to a final concentration of 100 ng/mL, and 1 mL of water was added to the sample. Extraction was performed with Discovery DSC 18 SPE columns, 500 mg/3 cc (Supelco), previously conditioned with 2 mL of methanol followed by 2 mL of water. The analytes were eluted with 2 mL of methanol. The solvent was evaporated to dryness using nitrogen at 25 °C and reconstituted in 200 μL of HPLC mobile phase.
Quantification and Quality Control
Quantification of the analytes was done using response factors calculated from a five-point calibration curve consisting of blank samples (rabbit serum) spiked with the analytes in the concentration range 20–800 ng/mL and extracted following the same procedure as for the samples. Peak area ratios of target analytes and the respective internal standards were calculated at each concentration. Blank samples consisting of rabbit serum spiked with the isotope-labeled standards were analyzed with each batch of samples. Random samples were extracted and analyzed in duplicate for each batch of samples.
Results and Discussion
Optimization of the MS-MS parameters by direct infusion showed that all the investigated compounds produced stable [M + H]+ ions using electrospray ionization in positive mode. For all compounds, with the exception of theobromine, which only produced one product ion, the two most abundant product ions were chosen and optimized for MRM analysis. For the isotope-labeled compounds only one product ion was selected (Table I).
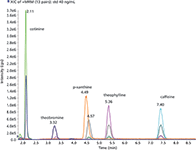
The compounds paraxanthine and theophylline had one common transition ion (m/z 181>124), so it was necessary to optimize the analysis to obtain a complete separation of these two compounds. A C18 analytical column was tested first, but the separation of paraxanthine and theophylline was incomplete. With an amide column using isocratic elution (Figure 1) a complete baseline resolution of all compounds was obtained. However, one consequence of using isocratic elution was the build up of high pressure in the analytical column. It was therefore necessary to routinely rinse the column with 100% methanol for a couple of hours after approximately 100 injections.

Figure 1: Total ion chromatogram of a 40-ng/mL standard. The different colors correspond to the different traces for the single transition ions (m/z). The traces for the six isotope-labeled compounds are included.
The linearity of the method was tested in the concentration range 40–800 ng/mL. The calibration curves were linear (R2 > 0.99) for all transition ions, with the exception of the two transition ions of cotinine, which were linear only up to 400 ng/mL. However, the concentrations of some analytes (caffeine, paraxanthine, and theobromine) exceeded the linear range in nearly half of the samples. In these cases the samples were diluted and analyzed again.
The presence of matrix components in plasma may cause problems with the LC separation and the MS detection if the sample is directly injected into the LC–MS-MS system without cleanup or dilution. Analytical methods, including time-consuming sample pretreatment, are not suitable for conducting clinical studies where large amounts of samples have to be analyzed.
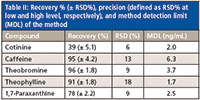
Some published studies have chosen the approach of direct injection of the previous dilution of the samples (3) or automated cleanup with back-flush column switching (2). On-line methods with automated cleanup are particularly useful when high sample throughput is required in the laboratory. In the case of clinical studies involving a variety of analyses of plasma from one individual, the amount of sample available for each specific analysis is often limited (often around 50–100 μL). Therefore, in case of failure or a problem in the on-line analysis, the injection cannot be repeated. We selected off-line SPE for sample cleanup before the LC–MS-MS analysis. We started with a sample volume of 100 μL with only a factor 1:2 dilution, which still allowed for low detection limits and removed matrix interferences that could significantly decrease the response of the analytes when using electrospray ionization. The final volume of 100 μL allowed sample injections to be repeated in the case of instrument failure. The detection limit of the method was calculated as 3× the standard deviation of blank samples (n = 55) analyzed together with the samples (Table II). The detection limits achieved with this method were in the low nanogram-per-milliliter range, which is lower than previously published studies have presented (2,3). The recoveries of the analytes were between 39% and 96%, with cotinine presenting the lowest recovery (Table II). This low recovery is probably a result of the relatively high polarity of this compound with consequent breakthrough during the SPE step. Since the corresponding isotopelabeled compound was added to samples and matrix-matched calibration standards for each analyte, no correction of sample recovery was needed, given the unchanged ratio between nonlabeled and labeled compounds during the overall extraction procedure. An isotope-labeled compound has the same physiochemical properties of the correspondent unlabeled compound. Therefore, the behavior (recovery in this case) of labeled and unlabeled compounds is expected to be the same during sample extraction.

Table II: Recovery % (± RSD%), precision (defined as RSD% at low and high level, respectively), and method detection limit (MDL) of the method
The precision of the method (coefficient of variance, RSD%) was calculated using the results of the analysis of samples randomly selected and analyzed in duplicate following the guidelines from Eurachem/WELAC (7). The calculated values for the precision of the method ranged from 6% to 18%.
Conclusions
The developed and validated method proved to be rapid, selective, and convenient for the simultaneous determination of cotinine, caffeine, and its metabolites in human serum samples. The addition of the corresponding isotope-labeled compound for each analyte, together with the quantification of matrix-matched standards, reduces the uncertainty that results from matrix effects and variable recoveries. The method has been successfully applied to the analysis of 500 samples from pregnant women in a clinical study.
Acknowledgments
Inga Jensen and Elsebeth Johansen are acknowledged for technical support in the analytical work.
Rossana Bossi received her MSc in agricultural science from the University of Milan, Italy, in 1988 and her PhD in environmental science from the Royal Danish Veterinary and Agricultural University, Copenhagen, Denmark, in 1998. She has been working in the analysis of organic compounds in the environment, biota, and humans using LC–MS–MS and GC–MS for 20 years. She is current with the Faculty of Science and Technology in the Department of Environmental Science at Aarhus University in Roskilde, Denmark. Bodil Hammer Bech became a medical doctor in 1989, graduating from Aarhus University in Denmark, and received her PhD in medical science from Aarhus University in 2005. Her PhD focused on the influence of caffeine on the fetus. She has worked in the area of reproductive epidemiology for more than 15 years and has been the daily leader of the Aarhus Birth Cohort Biobank, which collects blood samples from pregnant women, fathers-to-be, and newborns, since 2010. She is currently with the School of Public Health in the Department of Epidemiology at Aarhus University in Århus, Denmark.
References
(1) A. Wang, J. Sun, H. Feng, S. Gao, and Z. He, Chromatographia 67, 281–285 (2008).
(2) T. Arinoubu, H. Hattori, T. Kumazawa, X. Lee, Y. Mizutani, T. Katase, S. Kojima, T. Omori, R. Kaneko, A. Ishii, and H. Seno, Forensic Toxicol. 27, 1–6 (2009).
(3) A.S. Ptolemy, E. Tzioumis, A. Thomke, S. Rifai, and M. Kellog, J. Chromat. B 878, 409–416 (2010).
(4) H. Schneider, L. Ma, and H. Glatt, J. Chromat. B 789, 227–237 (2003).
(5) H. Llaquet, S. Pichini, X. Joya, E. Papaseit, O. Vall, J. Klein, and O. Garcia-Algar, Anal. Bioanal. Chem. 396, 379–399 (2010).
(6) J. Olsen, M. Melbye, S.F. Olsen, T.I.A. Sørensen, P. Aaby, A.M. Nybo Andersen, D. Taxbøl, K. Dynnes Hansen, M. Juhl, T. Broby Schow, H. Toft Sørensen, J. Andresen, E. Lykke Mortensen, A. Wind Olesen, and C. Søndergaard, Scand. J. Public Health 29, 300–307 (2001).
(7) Eurachem/WELAC, Accreditation for chemical laboratories, WELAC Guidance Document No. WGD 2, EURACHEM Guidance Document No.1 (1993).

High-Speed Laser MS for Precise, Prep-Free Environmental Particle Tracking
April 21st 2025Scientists at Oak Ridge National Laboratory have demonstrated that a fast, laser-based mass spectrometry method—LA-ICP-TOF-MS—can accurately detect and identify airborne environmental particles, including toxic metal particles like ruthenium, without the need for complex sample preparation. The work offers a breakthrough in rapid, high-resolution analysis of environmental pollutants.
The Fundamental Role of Advanced Hyphenated Techniques in Lithium-Ion Battery Research
December 4th 2024Spectroscopy spoke with Uwe Karst, a full professor at the University of Münster in the Institute of Inorganic and Analytical Chemistry, to discuss his research on hyphenated analytical techniques in battery research.
Mass Spectrometry for Forensic Analysis: An Interview with Glen Jackson
November 27th 2024As part of “The Future of Forensic Analysis” content series, Spectroscopy sat down with Glen P. Jackson of West Virginia University to talk about the historical development of mass spectrometry in forensic analysis.
Detecting Cancer Biomarkers in Canines: An Interview with Landulfo Silveira Jr.
November 5th 2024Spectroscopy sat down with Landulfo Silveira Jr. of Universidade Anhembi Morumbi-UAM and Center for Innovation, Technology and Education-CITÉ (São Paulo, Brazil) to talk about his team’s latest research using Raman spectroscopy to detect biomarkers of cancer in canine sera.