Spectral Background Radiation and the "Background Equivalent Concentration" in Elemental Spectrochemistry
For any given spectrometric system with a defined resolution and excition results, the background equivalent concentration is a characteristic of spectral lines.

The concept of spectral background radiation and its quantification in the background equivalent concentration are important in analytical atomic emission spectrometry, whether the excitation is by inductively coupled plasma, arc/spark, or X-ray fluorescence. This tutorial explains the sources of background, including the spectral background from neighboring spectral lines. It also explains the relationships between the background equivalent concentration, the limit of detection, and related quantities. Several examples are provided.
The concepts of spectral background radiation, the background equivalent concentration (BEC), and the relationship to the limit of detection are important in quantitative analysis by optical emission spectrometry (OES) and X-ray fluorescence (XRF).
The spectral background is noise in the measurement. Using the analogy of acoustical noise, the relationship to limit of detection (LOD) becomes clearer. Consider a noisy room. A whisper would not be heard, and to communicate one would need to shout. This situation corresponds to a high or "poor" limit of detection as a result of the high background noise. Now consider a quiet room. Here a pin-drop, a very quiet sound, or low signal can be heard. This would correspond to a low limit of detection.
This provides an intuitive introduction to the relationship between these two important quantities, spectral background (noise) and LOD. The exact relationship will be derived after a discussion of spectral background radiation and the definition of BEC.
The Spectral Background
We consider here the spectral background radiation in the optical and X-ray regions of the electromagnetic (EM) spectrum. Also, the change in spectral background resulting from the presence of neighboring spectral lines is addressed.
Optical Background Radiation
The radiant energy given off by an object is dependent on both the temperature and nature of the surface of the object. The energy radiated is small at low temperatures and increases with the temperature. The relationship between the amount of energy radiated and the temperature of the radiating body is given by the Stefan-Boltzmann law:

where A is the area, ε is the emissivity (ε = 1 for ideal radiator), σ = 5.67 × 10⁻⁸ W/m2 · K-4 is the Stefan-Boltzmann constant, and T is the absolute temperature. This shows that the radiated energy increases with the fourth power of the temperature.
The peak wavelength at which the radiant energy is emitted is inversely proportional to the temperature. This is called the Wien displacement law:

Example 1: Estimates for the temperature at the surface of the Sun vary from 5500 to 6000 K. Taking a mean of 5750 K, what is the peak wavelength of light emitted?
Solution: λmax = 2.898 mm
K/5750 K = 0.000504 mm = 504 nm. It is interesting to note that this is approximately the maximum sensitivity of the human eye.
The radiated energy is emitted across a broad spectrum of wavelengths. At a temperature of 300 °C, just about all of this energy is in the infrared portion of the spectrum. As the temperature increases, however, the wavelength at which the peak energy is emitted decreases, in accordance with the Wien displacement law noted above. For example, at 800 °C the object will emit enough visible light to appear "red hot." At 3000 °C, the object will appear "white hot" as a result of the greater presence of the shorter wavelengths.
At the plasma temperatures involved in excitation by the inductively coupled plasma (ICP) and arc/spark optical emission instrumental techniques, there is background (light) radiation at all wavelengths of analytical interest. This effect is shown in Figure 1.
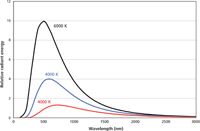
Figure 1: Spectral background radiation at various temperatures.
X-ray Background Radiation
In the X-ray region of the electromagnetic spectrum, the background radiation is a result of the acceleration of charged particles, generally because of either bremsstrahlung or backscattering.
Bremsstrahlung, from the German meaning "braking radiation," is the radiation emitted when electrons are decelerated when they slam into a metal target as in an X-ray tube. This background radiation is characterized by a continuous distribution, which becomes more intense and shifts toward higher energies when the energy of the bombarding electrons is increased. Figure 2 shows the form of this background radiation from a silver anode X-ray tube operated at 40 kV. The peaks at 22 and 25 keV result from the silver anode.
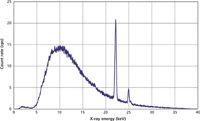
Figure 2: Bremmstrahlung from X-ray tube, 40 kV, silver anode.
The backscattered radiation may be either Rayleigh (elastic) or Compton (inelastic). Both of these effects are essentially collision phenomena, so one may think of a pool table with the exciting X-ray being the cue ball. In Rayleigh scattering, the cue ball collides elastically (that is, with no loss of energy) with the bank of the table (the atom) and is reflected back at some angle. In the Compton effect, the cue ball strikes another ball (an electron), which is initially stationary. In the collision, the cue ball gives up some of its energy to the other ball and they both go off in different directions, with the cue ball (incoming X-ray) having given up some of its initial energy.
With a 109 Cd radioisotope source of X-rays, we see the Rayleigh peak in the X-ray spectrum at 22 and 25 keV. With an 241 Am source, this Rayleigh peak is at 60 keV. In the Compton effect, some energy is transferred to the electron in the collision and so the X-ray leaves the collision with less energy. That's why we see the "Compton peak" at an energy lower than the source excitation energy, around 20 keV for 109 Cd and 50 keV for 241 Am. Figure 3 shows the backscattering from several samples. It is instructive to note the decrease in peak intensities with increasing sample mean atomic number. A derivation of the Compton effect is presented in Appendix I.
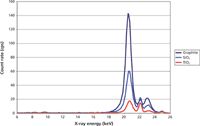
Figure 3: Spectral background radiation because of X-ray scattering.
Spectral Background from Other Spectral Lines
We should note that spectral background also may result from the flanks or wings of neighboring spectral lines, especially of the matrix element. Thus, in OES for example, we find generally higher background levels for spectrum-rich matrices such as iron when compared with elements such as aluminum, which has about 10 times fewer spectral lines.
Figure 4 shows an example from X-ray fluorescence spectrometry (3). The sample is a rare-earth–thorium phosphate mineral known as monazite. It is excited by an 241 Am radioisotope with the X-ray fluorescence detected by a 280-eV resolution Si PIN detector. Note the elevated background levels in the energy regions with multiple spectral lines.
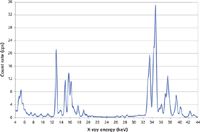
Figure 4: Spectral background from many spectral lines.
Background Equivalent Concentration
The BEC provides a quantitative measure of the amount of background radiation at a specified spectral line. It is defined as the analyte concentration that produces a net signal (peak minus background) equal to the background. That is, an analyte concentration for which the signal-to-background ratio is one.
Example 2: A practicing spectrochemist measures a blank and gets an intensity reading of 1211 "counts." A 10-ppm sample results in 2459 counts. What is the BEC?
Solution: By subtracting the background counts, we get 1248 for the net signal, which is almost the same as the background. Thus, the chemist knows immediately that the BEC is approximately 10 ppm for this particular spectral line of the element of interest.
The BEC may be calculated from the calibration curve or from a formula derivable from this curve. Both methods have their applications.
Consider the calibration curve shown in Figure 5. Here we plot measured light intensity (x axis) against concentration on the y axis. The point at which the line intersects the x axis (B) defines the background intensity for this particular spectral line. The equivalent concentration of this background can be found by moving to the point (2B) and reading off the BEC from the curve. Note that this is just the y-intercept of the calibration curve. Also worth noting is that the point "2B" corresponds to a signal-to-background ratio of one.
When a calibration curve is not available, the BEC may be calculated from the following formula:

or

where ΔC = CH – CL is the difference in concentration between the high (H) and low (L) standards, ΔI = IH – IL is the difference in measured light intensity (or intensity ratio) of these high (H) and low (L) standards, and DC is the dark current or electronic noise. This formula is derivable from the calibration curve shown in Figure 5 by elementary algebra, as shown in Appendix II.
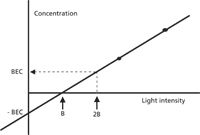
Figure 5: Calibration curve and relationship to BEC.
It is convenient to choose the low standard as a blank with no analyte present (CL = 0). Then IL = IB, the background intensity. Assuming a dark current negligible with respect to the background (DC << IB), this reduces this to

Here, IB is the background intensity. This form simplifies the calculation of the BEC.
The Limit of Detection
The analytical chemist defines detection limit as three times the standard deviation of the blank. But just what does this mean? The problem, as already noted above, is one of signal and noise. If the signal is so low or small that it can't be distinguished from the noise, then it is not detectable. In spectrochemistry, the noise is due to the spectral background. We say that the smallest amount detectable is three times the normal, random, statistical fluctuations of the noise or spectral background:

where σB is the standard deviation of the blank or pure sample. The three-sigma ensures that we are out of the noise.
However, this three-sigma number is going to be in intensity (or intensity ratio) units unless there exists a calibration for the element at the spectral line in question. This means that you can't determine an LOD without reference to at least two standards (or a standard and a blank), such as used to compute the BEC above.
In ICP spectrometry, this is often handled by dividing equation 4 by the sensitivity (S), defined as the change in measured spectral line per unit concentration — that is, the slope of the working curve:

However, this method assumes that the curve goes through the origin, and is therefore less general than the method using the BEC.
The approximation generally used in both arc/spark and ICP spectrometry to compute limits of detection from the BEC is as follows: LOD ≈ BEC/30. Where does this formula come from?
We start with the accepted definition of equation 4. Next, make 10 measurements on a blank or pure sample and get an average, standard deviation, and relative standard deviation (RSD) for these measurements in light intensity or intensity ratio units. (The relative standard deviation is the standard deviation, σ, divided by the mean, times 100.)
In terms of the RSD, the standard deviation of the blank is σB = (RSDB × Mean)/100. Substituting into the definition of the LOD above gives LOD = (3 × RSDB × Mean)/100.
But what is the mean or average value of the measurements in concentration units? Given that we're measuring a blank or pure sample, the "signal" in this case is just the background. Therefore, this "average" must be the BEC (4):

Finally, assuming an RSD of 1% for the spectral background, we get LOD = BEC/33, the source of the approximation noted above.
Example 3: Refer back to example 2 above. If the RSD of the measurements of the blank is 1%, what is the LOD for this (unnamed) element?
Solution: Using equation 6, we have LOD = 3 (1)(10 ppm)/100 = 0.33 ppm.
A common misconception is that the limit of detection is the smallest concentration that can be measured. Instead, it is the concentration at which we can decide whether an element is present or not — that is, the point where we can just distinguish a signal from the background. Quantitative analysis is generally agreed to begin at a concentration equal to 10 standard deviations of the blank. This is called the limit of quantitation (LOQ) or sometimes the limit of determination. Therefore, LOQ = 3.3 LOD.
Example 4: Given the LOD of example 2, what is the LOQ?
Solution: LOQ = 3.3 LOD = 1.09 ppm.
As the concentration of the analyte decreases, the precision, as expressed in the relative standard deviation, gets worse. Quantitatively, the RSD is 10% at the limit of quantitation and 33% at the limit of detection (3σ detection limits).
Signal-to-Background and Signal-to-Noise Ratios
In the measurement process it is important to distinguish between these two ratios. First, the signal-to-noise ratio (S/N): Whether we consider a strip-chart recording, a wavelength scan (Figure 6), or repeated measurements made on the same sample, the noise is determined by the statistical fluctuations of the signal. The standard deviation is a measure of this noise and so S/N is defined as the mean signal (I) divided by the standard deviation (σ),
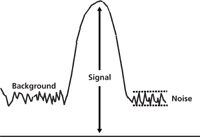
Figure 6: A wavelength scan.

The background is noise in a measurement when no signal is present. In spectroscopy this results from the background radiation discussed above. The relationship of signal to background is shown in Figure 6. The signal-to-background ratio (S/B) is defined as the signal above background (I – IB), that is, the net analyte signal, divided by the intensity of the background (IB ),

Example 5: What is S/B for the data given in example 2?
Solution: Because IB = 1211 counts and the signal I = 2459 counts, we have, S/B = (2459 – 1211)/1211 = 1.03.
Additional Relationships of Interest
BEC and Sensitivity
The sensitivity (S) was defined as the change in measured spectral line per unit concentration in equation 5. Note that this is just the inverse of the first term in equation 3a. Therefore, the relationship between the BEC and sensitivity is simply

Or, using the conditions already noted above, (CL = 0, so that IL = IB , and DC << IB ), we have,

That is, the BEC is inversely proportional to the sensitivity.
Example 6: From the data of example 2, compute the sensitivity.
Solution: With a BEC of approximately 10 ppm and a background signal of 1211 counts, we have S = IB /BEC = 1211 counts/10 ppm = 121.1 counts/ppm.
BEC and S/B
The BEC is also inversely proportional to S/B: The greater S/B, the lower the BEC. This relationship becomes clear when we examine equations 3b and 9 together. We can see that the term (IB )/(IH – IB ) of equation 3b is just the inverse of the S/B of equation 9. Therefore,

Example 7: Once again using the data of example 2, and the S/B already calculated in example 5, what is the BEC?
Solution: Because CH = 10 ppm and the S/B = 1.03, the BEC = 9.71 ppm. This agrees well, as it must, with the approximate BEC estimated in example 2.
BEC and S/N
There are a few other relationships worth developing here. Combining the definition of the relative standard deviation with that of S/N (equation 7), we get

By definition, the RSD at the LOD is 33%. Therefore we can see that the S/N at the LOD is just 3. Similarly, at the LOQ the S/N is 10.
The equation above provides an additional relationship between the various quantities associated with the background equivalent concentration and the limit of detection. Combining this equation 11 with equation 6, we can write the equation as shown below.

Summary
The concept of spectral background radiation and its quantification in the BEC is important in analytical atomic emission spectrometry, whether the excitation be by ICP, arc/spark, or XRF. For any given spectrometric system with a defined resolution and excitation condition, the BEC is a characteristic of the spectral lines. The LOD, however, depends also on the precision of the spectrometer.
Appendix I: Compton Effect Derivation in Energy Terms
An X-ray photon of energy E0 and momentum P = E0/c moving along the x axis collides with electron initially "at rest" at the origin (rest energy E = m0 c2). After the collision, the photon heads off at an angle a to the horizontal (x axis) and the electron goes off at an angle β. This is shown in Figure 3. The photon has an energy EF and momentum EF /c. The electron has an energy Ee and momentum Pe. What is the energy of the X-ray photon after the collision (EF)?
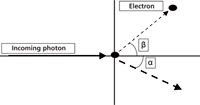
Figure 7: Schematic diagram for Compton effect derivation.
The solution of collision problems generally requires both the principles of conservation of energy and conservation of momentum.
Conservation of energy:

Conservation of momentum (x-direction):

Conservation of momentum (y-direction):

The steps to solution are as follows:
First, eliminate the variable β from the momentum equations by squaring both equations 2 and 3 and then adding them. This gives the following equation:

Then, use the trigonometric identity cos2 θ + sin2 θ = 1 to simplify:

The energy and momentum of the electron are related by the following relativistic relationship:

Now substitute equations 1 and 4 into this equation 5. First solve for Ee in equation 1 and square the result:

Multiply equation 4 through by c2:

Substitute the results from equations 1a and 4a into 5 and several terms cancel out. The result is

After simplification, the final result is

As an example, we can compute the position of the Compton peak shown in Figure 2. The excitation energy (E0 in the above equation) is 22 keV. The rest mass of the electron (m0 c2) is 511 keV. The angle a for the spectrometer used is approximately 135° (excitation source to sample and back to detector). Making the substitutions, we find EF = 20.5 keV, in excellent agreement with the Compton peak position in Figure 3.
Appendix II: Deriving BEC from the Calibration Curve
Refer back to Figure 5 in the text above. Let the coordinates of the first point (lowest on curve) be (IL , CL ) and the second (IH , CH ). Because the equation of a straight line is y = mx + b, we can write
CL = mIL + b
and
CH = mIH + b
Subtracting the first equation from the second gives
CH – CL = m(IH – IL )
or
m = (CH – CL )/(IH – IL) = ΔC/ΔI
Substituting this slope back into the first equation above, we find b = CL – (ΔC/ΔI)IL
Because we identify the BEC with the negative of the y-intercept (b), we get BEC = (ΔC/ΔI)IL – CL and we arrive at equation 3a given in the text above.
Volker B.E. Thomsen, a physicist by training, has some 30 years of experience in elemental spectrochemical analysis (OES and XRF). He is currently a consultant in this area from his home in Atibaia, São Paulo, Brazil. His other interests include mineralogy and history of science. Occasionally, he still plays the blues harmonica. He can be reached at vbet1951@uol.com.br

Volker B.E. Thomsen
References
(1) V. Thomsen, G. Roberts, and K. Burgess, Spectroscopy 15(1), 33–36. (2000).
(2) V. Thomsen, D. Schatzlein, and D. Mercuro, Spectroscopy 18(12), 112–114 (2003).
(3) V. Thomsen and D. Schatzlein, Spectroscopy, 18(7), 18–21 (2003).
(4) P.W.J.M Boumans, Inductively Coupled Plasma Emission Spectroscopy — Part I (John Wiley & Sons, New York, New York, 1987).

Applications of Micro X-Ray Fluorescence Spectroscopy in Food and Agricultural Products
January 25th 2025In recent years, advances in X-ray optics and detectors have enabled the commercialization of laboratory μXRF spectrometers with spot sizes of ~3 to 30 μm that are suitable for routine imaging of element localization, which was previously only available with scanning electron microscopy (SEM-EDS). This new technique opens a variety of new μXRF applications in the food and agricultural sciences, which have the potential to provide researchers with valuable data that can enhance food safety, improve product consistency, and refine our understanding of the mechanisms of elemental uptake and homeostasis in agricultural crops. This month’s column takes a more detailed look at some of those application areas.