Spectrometers for Elemental Spectrochemical Analysis, Part IV: Inductively Coupled Plasma Optical Emission Spectrometers
A tutorial on inductively coupled plasma (ICP) excitation and sample introduction systems.
In this tutorial, we discuss inductively coupled plasma (ICP) spectrometers. The basic modules of spectrometer systems already have been discussed in Part I of this series (1). Here, we focus on the ICP excitation and sample introduction system. A discussion of some optical configurations used in ICP is included.
The plasma excitation spectrometer is a relative newcomer, invented in the 1960s, although commercially available units were not sold until the late 1970s. The term "plasma" here describes what is commonly referred to as the "fourth state of matter;" that is, a very hot, ionized gas. Plasma sources are typically used for the analysis of liquids, finding their primary application in environmental monitoring and other areas where samples may be readily available in liquid form. Although there are different ways to produce these plasmas, by far the most common is the inductively coupled plasma (ICP).
In ICP–optical emission spectroscopy (OES), the energy from the high-temperature argon plasma (5000-10,000 K) excites the sample atoms. Generally, the sample must be in liquid form.
The Plasma
A radio-frequency (RF) generator, typically run at either 27.12 or 40.68 MHz and between 1 and 5 kW, provides energy to the argon gas flowing through the quartz torch by means of an induction coil or RF coil (Figure 1). In terms of electronic design, the generators can be grouped as either "free run" or "quartz controlled" types, with similar overall performances. The former keeps the loaded energy transferred to the plasma constant, independently of variations in the physical properties of the sample aerosol, and the latter keeps the plasma frequency constant, controlled by a quartz oscillator, even under different aerosol conditions.
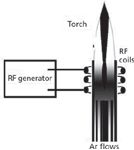
Figure 1: Schematic diagram of ICP excitation source.
RF power is applied to an air- or water-cooled coil, generating a magnetic field that induces electrical currents in the matter within the coil, thereby producing heat. Argon gas is introduced through the torch and a high-voltage spark (typically generated by a Tesla coil) is applied, causing the argon atoms to ionize. The free electrons provide the conductive matter that allows the flow of electrical current, which results in a high-temperature gas (plasma). Part of the argon gas flow is swirled in such a way as to shape and contain the plasma.

Figure 2: Schematic of the temperature profile in ICP plasmas.
Gases other than argon can be used to generate plasma. However, for analytical purposes, argon is the most suitable. It presents the following advantages:
- It is an inert gas and does not react with the sample constituents introduced in the plasma.
- It has the necessary electron energy to excite most of the element lines in the periodic table.
- It is relatively transparent to the bulk of emitted photons, which translates into a linear relationship with the atom concentration of the elements in the sample (that is, straight line calibration curves).
- It requires relatively low running costs to cope with the high consumption required to keep the plasma operative (about 18 L/min).
The temperature profile in the plasma is shown in Figure 2. The injected sample solution undergoes multiple transformations along the way, as described below.
- The first step is desolvation, the removal of the solvent from the droplet, to leave a tiny salt particle, which is rapidly vaporized into a gas of the molecule. This occurs at the very bottom of the plasma.
- The second step is atomization, where the gaseous molecules are further broken down or dissociated into their component atoms. This occurs just above the desolvation zone.
- The third step, excitation, takes place at the plasma's hottest region, around 10,000 K, where the electrons of the atoms that constitute the sample elements are excited by the energy transferred from the plasma. The excited electrons jump to high energy levels within the atoms or leave the atom completely, producing ions. The electrons of the ions may themselves be excited to higher energy levels.
- The fourth step takes place in the lower temperature region, called the emission zone, from about 7000 K to 6000 K. Here, the electrons return to their ground state, or lower energy levels, with a subsequent emission of photons with discrete characteristic energies. The ionic lines of the element will be emitted at higher observation heights in the plasma.
- Finally, the recombination step occurs in the plume of the plasma, where the free electrons and ions can recombine to produce neutral atoms and molecules. This region is responsible for partially absorbing the emitted photons (self-absorption) and therefore must be removed in axial plasma viewing spectrometers (see below). As noted in reference 2, "Measurements in the plasma tail zone with pronounced temperature gradients are severely affected by interferences mainly caused by the formation of molecular compounds and to the presence of EIEs (easily ionizable elements)."
The Torch
The ICP torch consists of three concentric tubes that allow appropriate argon flows to maintain and constrain the plasma, as well as delivering the sample to the plasma. Figure 3 shows a diagram of the ICP torch. There are three separate argon flows:
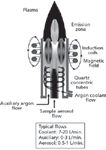
Figure 3: Schematic diagram of an ICP torch.
The Coolant Flow: The narrow spacing between the outer and middle tubes is shaped in such a way as to make the argon gas spiral tangentially between the tubes as the gas rapidly rises. The function of this so-called "coolant gas" is to keep the walls of the torch cool and to shape and constrain the plasma.
The Auxiliary Flow: The auxiliary, or intermediate, flow supports the plasma, allowing the whole plasma to be raised or lowered as the flow is increased or decreased. By increasing the flow, the distance between the bottom of the plasma and the tip of the injector tube becomes greater. Thus, the heat generated at the injector's tip is reduced, minimizing the build-up of salts or carbon deposits (organics), which may clog the admission of the sample solution.
The Nebulizer Flow: The nebulizer flow carries the sample aerosol up into the plasma. The narrow tip at the end of the injector allows the gas to flow at high velocity and punch a hole through the plasma. Torches may be made from a variety of materials, and may be one piece or of the demountable type. The outer tubes typically are manufactured from quartz, and the injector tube may be made of quartz or a ceramic material if corrosion resistance (such as to HF) is required.
Torches can be manufactured to work either in the vertical position (radial view) or a horizontal position (axial view). See Figure 4.
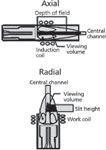
Figure 4: Schematic of the two torch configurations.
The vertical torch, despite its smaller analytical viewing volume, allows the plasma to be viewed in its various regions by a simple adjustment of the torch observation height. This reduces the background radiation from the high background emission zone just above the induction coils. However, since the emitted photons produced in the most unstable outer regions of the plasma also contribute to the total emission, the stability of measurement is affected and higher RSDs are produced.
Horizontal torches are "viewed" by the optics along their entire axis, in the central region of the plasma. The useful analytical central volume region is the most stable region within the plasma, as well as the least affected by the electromagnetic field that generates the plasma. Therefore, it produces a more stable emission resulting in less noise and, as a consequence, better detection limits. On average the LODs are 2–10 times better than those obtained with vertical torches (Table I). The downside of these torches is that the optical system "sees" the entire plasma along its axis. Therefore, all the emission coming from the higher temperature regions of the plasma, responsible for the higher background noise, are incorporated into the resulting emission spectra. High molecular order samples, such as organic substances, may produce a complex spectral background, in particular in the UV emission range. Also, the use of axially viewed torches requires the elimination of the plume region of the plasma. This region, because of its lower temperature, may absorb a great portion of the emitted photons, resulting in the reduction of the analytical sensitivity and production of nonlinear calibration curves (self-absorption). Finally, because of their operational mode, horizontal torches usually require more frequent cleaning and replacement.
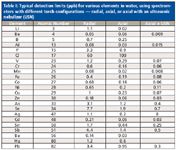
Table I: Typical detection limits (ppb) for various elements in water, using spectrometers with different torch configurations - radial, axial, or axial with an ultrasonic nebulizer (USN)
Although both viewing modes can cope with any type of matrix, it is generally accepted that horizontal torches (axial) perform better for very low concentration levels in relatively matrix-free sample environments, whereas vertical torches show better performance in matrices where flux agents or a high quantity of total dissolved solids (TDS) are present and where higher element concentrations are expected. Some instruments make use of a series of mirrors placed around a fixed horizontal (axially viewed) torch to allow a subsequent radial observation of the emitted radiation, thus combining both axial and radial views in one instrument.
Sample Introduction System
Analyses by ICP are usually carried out with samples in liquid form, although solid and gas forms also can be used. In this section we will restrict ourselves to liquid samples. The introduction of samples in the solid and gas states will be discussed in the "Special Topics" section below.
The reason for a sample introduction system is to deliver a consistent flow of sample to the plasma torch through an argon flow (Figure 3). The aerosol generated to be introduced into the plasma consists of fine droplets of the aqueous sample. Only small droplets of liquid will go through these stages reproducibly, and so a sample introduction system must be capable of providing these. Only in this way can quantitative analysis be performed. If samples are injected at different rates into the plasma, then results may not be comparable.
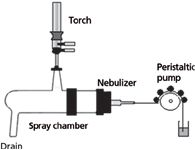
Figure 5: Schematic of an ICP sample introduction system.
How is the liquid sample introduced into the plasma? The sample introduction system consists of several parts, as shown in Figure 5:
- the peristaltic pump
- the nebulizer
- the spray chamber
- the drain
The Peristaltic Pump: Liquid samples are removed from the sample container through a small bore (capillary) tube. This is generally produced by the action of a peristaltic pump, which provides even sample delivery. However, the peristaltic pump must be of a sufficient size and have a suitable number of rollers to ensure a constant flow of solution, rather than a pumping action. The peristaltic tubing (internal diameter of tube) also must be carefully selected to guarantee the appropriate sample delivery rate. It also must be chemically inert with respect to the liquid being pumped through it.
The Nebulizer: The sample runs through the tubing from the peristaltic pump until it reaches the nebulizer. The purpose of the nebulizer is to generate an aerosol that can be consistently delivered to the plasma. There are two basic types of nebulizer used by ICP: pneumatic and ultrasonic. These terms merely describe the type of force used to break down the liquid into an aerosol.
Pneumatic nebulizers were the first to be used in ICP as they were simply an extension of those already in use in atomic absorption (AA) spectrometry instrumentation. The biggest difference between ICP and AA nebulizers is the delivery rate. It is typical for the delivery of the gas flow in AA to run at approximately 10 L/min. The gas flow rate for the ICP is much lower, generally around 1 L/min. More information on nebulizers may be found in Appendix I.
Spray Chamber: The spray chamber connects the nebulizer to the torch. The primary function of the spray chamber is to remove the larger aerosol droplets and only allow the very finest of the droplets, usually below 8 µm, to be carried into the plasma. In fact, only about 2–3% of the sample volume reaches the plasma.
Spray chambers vary in design, and include the Scott double pass, conical with impact bead, and cyclonic types. In each case, the construction of the spray chamber is such that it causes the larger drops to impact some part of the chamber and be transported to the drain.
Drain: The drain has two important functions; the obvious one is that it removes the excess sample solution from the spray chamber to a waste container. The second function is to supply the back pressure necessary to ensure the nebulizer gas flows through the torch. Drains may be either gravity fed with a loop or U-tube to provide the necessary back pressure, or be pumped through peristaltic tubing. The back pressure should be kept constant; otherwise it can change the sample flow into the plasma and affect the emission signal.
Optical System Configurations
The principles of diffraction and interference, on which the various optical arrangements are based, were discussed in Part I of this series (1). Some ICP spectrometers use an optical configuration other than the Paschen-Runge mount (1). Despite the different geometries, the optical configurations used in ICP spectrometers have the sole function of dispersing the emission spectra of the sample generated in the plasma into their characteristic spectral lines.
Types of ICP Optical Configurations: Many different types of optical arrangements are commercially available for ICP spectrometers. Perhaps the most common are the traditional Paschen-Runge mount, the echelle configuration, and the Czerny-Turner mount.
The Paschen-Runge mount benefits from the sensitivity provided by the first-order diffraction and its few component elements, and can cope either with photomultiplier detectors or a multiple series of linear-array CCDs arranged along the Rowland Circle.
The echelle optical configuration produces multiple diffraction patterns of higher orders displaced in a format specially designed to cope with a two-dimensional solid state detector array (CCD). For instruments covering wavelengths in the UV region, a specific optic–CCD combination is required, avoiding quartz components that heavily absorb the UV radiation.
The use of large-size CCDs with a binning array of sensitive pixels, or equipped with traditional photomultiplier detectors may require a different type of optical arrangement: the Czerny-Turner mount.
Some ICP spectrometers nowadays make use of more than one optical system, mounted in one single optical chamber, to improve their performance in specific wavelength ranges.
It is worth mentioning that the emitted photons in the UV range are partially or even totally absorbed by the air and moisture environment trapped inside the optical bench. Therefore, vacuum or an argon flush in the optical chamber is required. As the flushing of a relatively large optical chamber may require a longer instrument start-up time to completely eliminate all the air and moisture, some instruments have their optics factory sealed with argon, thus providing faster start-up with the additional benefit of no consumption of this gas.
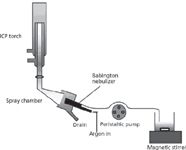
Figure 6: Introduction system for slurries.
It is beyond the scope of this tutorial to comment on the advantages or disadvantages of each type of optical arrangement. However, Appendix II presents some guidelines in terms of the following performance characteristics: speed of analysis, resolution, stability, sensitivity, wavelength coverage, and overall cost.
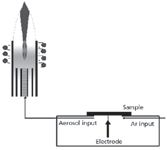
Figure 7: Spark ablation sample introduction.
Special Topics
Introduction of Solids: Under special circumstances, solid samples also may be analyzed using an ICP instrument. This introduction of solid samples typically takes one of two forms:
- The sample is introduced in the form of a slurry where the particles, after being reduced to a small mesh size, are mixed with a solvent and kept under continuous agitation by means of a magnetic stirrer before their introduction in the plasma (Figure 6).
- Using a more sophisticated sample introduction system, such as an electrical spark or laser, tiny particles are ablated from the surface of the sample, which are then carried in a stream of argon to the plasma (Figure 7). Because of the complexity of this type of matrix, a "robust" plasma condition is required. In the literature, a plasma condition is considered "robust" if it is capable of supporting the introduction of a complex matrix aerosol without significantly changing the plasma physical properties. The assessment of such a state can be carried out by measuring the intensity ratio of two lines, an atomic and an ionic, such as the Mg II (280.2 nm)/Mg I (285.2 nm) ratio. A ratio of around 10 is said to be an efficient indicator of the plasma robustness to cope with complex matrices (3).
The spark and laser ablation techniques tend to deliver the sample in a small discrete amount of time, and so the analytical reading must be timed very carefully for the actual analysis.
Introduction of Gases and Vapors: Some hydride-forming elements, such as As, Se, and others (Hg, Sb, Bi, Ge, Pb, Te, and Sn), can be introduced directly in the plasma in the vapor form. This provides detection limits in the parts-per-billion and sub-part-per-billion range. A hydride-generating sample introduction system is shown schematically in Figure 8.
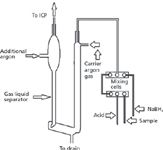
Figure 8: Schematic of a hydride generator.
Summary
The ICP excitation source provides a powerful addition for those involved in optical emission spectrochemical analysis. Here, we have discussed the ICP excitation and sample introduction system. A discussion of some optical configurations used in ICP-OES also has been included. The flexibility of this technique to handle various types of materials, its ability to detect most of the elements in the periodic table over a very wide range of concentrations (from parts-per-billion to percent levels), and the capability of simultaneous analysis of a large number of elements per sample in times below 2 min, makes ICP a very important tool in any modern laboratory.
Appendix I: ICP Nebulizers
There are three basic designs of pneumatic nebulizers. The first of these is the concentric nebulizer. A concentric nebulizer typically is made from glass and contains a very fine capillary running the length of the nebulizer. Concentric nebulizers (Figure 9) are very popular because of their excellent stability and sensitivity. The biggest drawback is the material that is used to manufacture them, which means these nebulizers are fragile and cannot be used with solutions containing hydrofluoric (HF) acid. Also, because of the small capillary diameter, they tend to clog in the presence of solutions with high TDS content. There are variations on this type of nebulizer, including the microconcentric nebulizer, which is manufactured from plastic rather than glass and therefore does not suffer ill effects from the use of HF. However, the sample delivery rate is much lower.
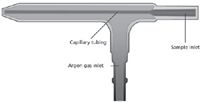
Figure 9: Schematic of a concentric nebulizer.
The second main design of pneumatic nebulizer is that of the cross-flow nebulizer (Figure 10). This consists of two capillary tubes at right angles to each other. A high speed flow of argon is forced across the liquid stream in the second capillary, creating the aerosol. The slightly larger capillary tubes in this design minimize clogging, which is an advantage over the concentric nebulizer, thus increasing their capacity to handle solutions with up to 20% TDS. However, depending on its design, the cross-flow may not be as efficient in producing the fine droplets required for analysis, resulting in slightly poorer RSDs as compared to the concentric nebulizers.
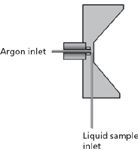
Figure 10: Schematic of a cross-flow nebulizer.
The third design of pneumatic nebulizer is the Babington nebulizer. The sample solution is allowed to pour over a surface with a small orifice, through which high pressure argon is passing. The argon shears the liquid into small droplets. Because it is only the argon gas that passes though the small hole, this design is perfect for both viscous samples and for samples containing high total dissolved solids, as it is essentially clog-proof (Figure 11). A variation on the Babington is the V-groove nebulizer.

Figure 11: Schematic of a Babington nebulizer.
The ultrasonic nebulizer (USN) uses the oscillations of a piezoelectric transducer to break up the sample into the aerosol (Figure 12). This type of nebulization is more efficient than the previously mentioned pneumatic types, so more sample gets to the plasma. An important limitation of this type of nebulizer is its reduced capacity to handle high-TDS samples, mainly related to its cleaning and memory effects.
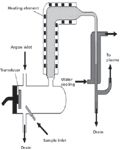
Figure 12: Schematic of an ultrasonic nebulizer.
Appendix II: Optical System Requirements for a Modern ICP Spectrometer
This appendix presents some guidelines regarding the following performance characteristics: analysis speed, resolution, stability, sensitivity, wavelength coverage, and overall cost.
Analysis speed: Polychromators, fitted with various sensor devices, are capable of simultaneously carrying out the analysis of multiple element lines, thereby drastically reducing the overall time required to produce a result. The typical analysis time for this type of arrangement is around 1 min for almost an unlimited number of elements. Monochromators, on the other hand, are capable of doing only one or a limited number of elements at a time, carrying out their analytical task in a sequential mode. Typical analysis time in this optical arrangement depends on the number of elements to be analyzed. On average, no more than two to three elements per minute are determined, a rather long analysis time as compared with the immediate response of the simultaneous optical arrangements. Therefore, the use of sequential spectrometers should be considered only in laboratories with a limited sample throughput, or laboratories where the number of elements required per sample is small. Note: The widespread use of CCDs, replacing the traditional photomultipliers, has greatly reduced the number of commercially available ICP spectrometers equipped with a monochromator design.
Resolution: The resolution required depends on the spectral complexity of the sample matrix. Rare earth materials, for example, have notoriously complex spectra and an optical arrangement designed with a high capability of separating adjacent spectral lines that is recommended to eliminate spectral line interferences. That is, an optical system with a high "resolving power" is required to cope with the problem of overlapping, unwanted lines on the analytical lines of interest.
Stability: The more components an optical arrangement has, the more complex its design and the longer the path length from the plasma-emitted photons to the detector or detectors. In this case, rigid thermal control of the optical bench may be necessary to prevent minute displacements of the optical components' alignment because of thermal expansion and contraction. Such temperature changes may result in spectral line shifts, which are responsible for long-term instrumental drift. Clever solutions to this problem have been adopted, such as a close monitoring of a reference line throughout all the analysis integration time with automatic compensation and correction of eventual line shifts through a dedicated software mathematical model.
Sensitivity: The more reflective or refractive surfaces in the light path of the optical system, the greater the attenuation of the beam, reducing overall sensitivity. Modern digital sensor devices can partially cope with this signal reduction by electronically enhancing the threshold peak values, sometimes at the expenses of an overall background noise increase. In this type of instrument, a background reduction can be achieved by Peltier cooling of the detector at temperatures around –30 °C, sometimes at the expense of a longer instrument start-up time.
Wavelength Coverage: The greater the wavelength range that the optical system covers, the more versatile an ICP spectrometer will be. Certain families of elements, such as the halogens, only have sensitive lines below
170 nm. Therefore, if their analysis is required, an optical system covering this region is mandatory. However, it should be noted that, depending on the optical system geometry, greater wavelength coverage may be obtained at the expense of instrument resolution.
Overall Cost: The combination optical bench–detector is the most expensive component of an ICP spectrometer. Therefore, "simple" analytical tasks, a situation often found in laboratories carrying out straight production control analysis of few elements at parts-per-million or percent concentration levels, do not necessarily require expensive optical devices. For this kind of application, many instruments in the range of US$60,000 are available.
Readers must carefully balance all the optical performance requirements necessary to fulfill their particular analytical needs with the benefits brought by each arrangement.
References
(1) V. Thomsen, Spectroscopy 25(1), 46–54 (2010).
(2) L. Trevizan and J. N brega, J. Braz. Chem. Soc. 18(4), 678–690 (2007).
(3) J.M. Mermet and E. Poussel, Applied Spectroscopy, Focal Point 49(10), 12A–18A (1995).
Carlos Augusto Coutinho, a retired senior researcher at Usiminas Steelworks R&D Analytical Division, is presently a consultant in Brazil. As a hobby, he enjoys reading subjects related to anthropology and playing the piano. He can be reached at cacoutinho@task.com.br.
Volker Thomsen, a physicist by training, has some 30 years of experience in elemental spectrochemical analysis (OES and XRF). He is currently a consultant in this area from his home in Atibaia, São Paulo, Brazil. His other interests include mineralogy and history of science. Occasionally, he still plays the blues harmonica. He can be reached at vbet1951@uol.com.br.
Suggestions for Further Reading
P.W.J.M. Boumans, Ed. Inductively Coupled Plasma Emission Spectroscopy – Part I, Methodology, Instrumentation, and Performance (John Wiley & Sons, New York, 1987).
P.W.J.M. Boumans, Ed. Inductively Coupled Plasma Emission Spectroscopy – Part II, Applications and Fundamentals (John Wiley & Sons, New York, 1987).
P. Gaines, ICP Operation, A Guide for New ICP Users. Online at http:// www.ivstandards.com/tech/icp-ops/
P. Gaines, Reliable Measurements. Online at
http://www.ivstandards.com/tech/reliability/
A. Montaser and D.W. Golightly, Inductively Coupled Plasmas in Analytical Atomic Spectrometry. (VCH, Weinheim, Germany, 1992).
High-Speed Laser MS for Precise, Prep-Free Environmental Particle Tracking
April 21st 2025Scientists at Oak Ridge National Laboratory have demonstrated that a fast, laser-based mass spectrometry method—LA-ICP-TOF-MS—can accurately detect and identify airborne environmental particles, including toxic metal particles like ruthenium, without the need for complex sample preparation. The work offers a breakthrough in rapid, high-resolution analysis of environmental pollutants.
Trending on Spectroscopy: The Top Content of 2024
December 30th 2024In 2024, we launched multiple content series, covered major conferences, presented two awards, and continued our monthly Analytically Speaking episodes. Below, you'll find a selection of the most popular content from Spectroscopy over the past year.