Synthesis and Structural Elucidation of Impurities in Ramipril Tablets
Special Issues
In this article, the authors take a look at the identification, synthesis, and characterization of impurities in Ramipril tablets.
Ramipril impurities D and E are well-known degradation products of ramipril in the finished dosage form. A significant amount of an additional impurity was detected in ramipril tablets by an isocratic reversed-phase high performance liquid chromatography (HPLC) method on a short column. The structure of this impurity was proposed based on liquid chromatography–mass spectrometry (LC–MS) data using an electron spray ionization source. Structural elucidation using nuclear magnetic resonance (NMR) and infrared (IR) spectroscopy was facilitated by a newly developed preparative isolation method. This impurity was characterized as (2R,3aR,6aR)-1-[(R)-2-[[(R)-1-(ethoxycarbonyl)-3-phenylpropyl]amino]propanoyl]octahydrocyclopenta[b]pyrrole-2-carboxylic acid (impurity L). Its identification, synthesis and characterization are discussed.
Ramipril, (2S,3aS,6aS)-1-[(S)-2-[[(S)-1-(ethoxycarbonyl)-3-phenylpropyl]amino] propanoyl] octahydropcyclopenta[b]pyrrole-2-carboxylic acid, is an angiotensin-converting enzyme (ACE) inhibitor that is used for the treatment of hypertension, heart failure, and nephropathia (1–5). The degradation of ramipril occurs mainly via two pathways: the hydrolysis to rampiril diacid (impurity E described in the European Pharmacopoeia) and the cyclization to rampiril diketopiperazine (impurity D described in the European Pharmacopoeia) (6,7). We have detected an additional impurity above the level of 0.2% in ramipril tablets. As per regulatory guidelines (8), all of the individual impurities that are ≥0.2% in ramipril must be identified and characterized. Because the major degradant in rampiril tablets is impurity D, it was our assumption that the unknown impurity could be formed from impurity D. The current paper outlines the identification, synthesis, and characterization of this additional unknown impurity in ramipril tablets.
Experimental
Materials and Reagents
Samples of ramipril tablets and ramipril API were obtained from Cipla (Mumbai, India). High performance liquid chromatography (HPLC)-grade methanol and acetonitrile were purchased from Runa (Mumbai, India). AR-grade trifluoroacetic acid and ammonia were purchased from Merck (Mumbai, India).
HPLC
An HPLC system equipped with a low-pressure quaternary gradient pump and a UV detector and auto liquid sampler handling system (Agilent Technologies, Santa Clara, California) was used for the analysis of samples. The data were collected and processed using Chemstation software (Agilent Technologies). A 50 mm × 4.6 mm, 1.8-μm Zorbax SB C18 (Agilent Technologies) column was employed for the separation of impurity from ramipril tablets. The column eluent was monitored at a detection wavelength of 210 nm. A linear gradient program was optimized for the clear separation of impurity from ramipril tablets, using water (pH = 3 with trifluoroacetic acid) and acetonitrile in the ratio of 86:14 as a mobile phase at a flow rate of 1 mL/min.
Mass Spectrometry
The LC–mass spectrometry (MS) and MS-MS studies were carried out on an Iontrap 6320 Series electron spray ion trap spectrometer (Agilent Technologies). The source voltage was kept at 3.0 kV. Parameters: neblizer gas = 30 psi; dry gas = 3 L/min; dry temperature = 150 °C; capillary voltage = –4500 to –1500 V. Nitrogen was used as both a sheath and auxiliary gas. Mass range was kept at m/z 50–600. The chromatography conditions and mobile phase are as described under the heading "HPLC" earlier. The flow rate was maintained at 1 mL/min.
Flash Chromatography
The purification of impurity was performed from reaction mass using a Combi Flash Companion system, consisting of a binary gradient pump and a model 2487 UV detector (Teledyne ISCO, Lincoln, Nebraska). A 250 mm × 20 mm, 35-μm dp Combi Flash C18 column (Teledyne ISCO) was used. A mixture of water (pH = 3 with trifuoroacetic acid) and acetonitrile in the ratio of 30:70 (v/v), at a flow rate of 35 mL/min, was used as a mobile phase. The detection was carried out at 210 nm. The sample solution (500 mg/mL) was prepared, and 5 mL of injection volume was injected.
Nuclear Magnetic Resonance
The 1H, and 13C nuclear magnetic resonance (NMR) spectroscopy experiment of the impurities ramipril D and ramipril L were carried out at a frequency of 300 MHz at 25 °C on an NMR spectrometer (Varian, Palo Alto, California). 1H and 13C chemical shifts are reported on the δ scale in ppm relative to tetramethyl silane 0.00 and CDCl3 77.00 ppm in 13C NMR, respectively. A D2O exchange experiment was performed to confirm the exchangeable protons.
IR Spectroscopy
The IR spectrum of the isolated impurity was recorded in the solid state as a KBr powder dispersion using a Fourier-transform IR spectrometer (PerkinElmer, Waltham, Massachusetts).

Figure 1: HPLC chromatograms of (a) ramipril sample and (b) ramipril placebo.
Results and Discussion
Detection of Impurity by HPLC and LC–MS
Typical analytical LC chromatograms of ramipril tablets and placebo obtained using the LC method discussed in the experimental section are shown in Figures 1a and 1b, respectively. The analysis revealed the presence of two impurities: Imp-D and an unknown impurity (marked as Imp-L). Impurities L and D are eluted at 3.99 min and 8.28 min, respectively.
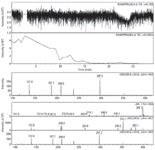
Figure 2: MS and MS-MS data for ramipril D.
LC–MS-MS Analysis
LC–MS-MS analysis of ramipril tablets was performed using the solvent system as described in the experimental section. Results of the LC–MS-MS analysis (Figures 2 and 3) revealed that the additional impurity exhibited a molecular ion at m/z (M+1) 415 amu. Mass fragmentation was carried out for this molecular ion. The mass fragmentation pattern of this impurity revealed a first fragment of 397 amu, which is due to loss of a hydroxyl group from the molecule, as shown in Figure 4. This indicated that the additional impurity could be hydroxy impurity D (or impurity L). To further confirm the structure of the impurity (m/z 415, M+1), this impurity was synthesized and purified by flash chromatography.
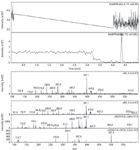
Figure 3: MS and MS-MS data for ramipril impurity L.
Synthesis and Isolation of Impurity by Flash Chromatography
The level of additional impurity ramipril L in the tablets was in the range of 0.2–0.6%. Because isolation of such a low level was difficult, synthesis of this impurity was attempted. On the basis of LC–MS-MS studies, the additional impurity was proposed as hydroxy-impurity D or impurity L.
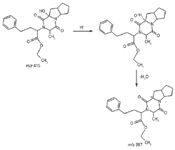
Figure 4: Fragmentation mechanism for product ion with m/z 415.
Formation and Synthesis of Impurity
Ramipril was heated at 120 °C for 6–8 h to convert it into ramipril D. Ramipril D was then further subjected to selective oxidation with benzyl peroxide at 55 °C. After 48 h, the reaction was cooled and the peroxide complex was broken by dimethyl sulfite to get ramipril impurity L, as shown in Figure 5.
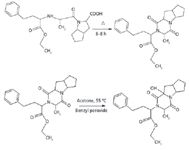
Figure 5: Schematic path for synthesis of ramipril impurity L.
The sample obtained from the reaction mixture was subjected to flash chromatography isolation. All of the fractions were checked for retention time and purity. The fractions showing the presence of impurity above 97% were mixed together. The targeted impurity L was isolated as described earlier. Ramipril and the impurities L and D were eluted at 15, 26, and 30 min, respectively (Figure 6). The collected fractions were concentrated to dryness under high vacuum using lyophilization. The chromatographic purity of the isolated impurity sample was tested in analytical mode by HPLC and found to be 99%. This isolated solid was used, without further puriBDcation, to generate spectroscopic and spectrometric data (Figure 7).
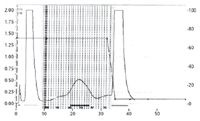
Figure 6: Flash chromatogram of ramipril and impurities L and D.
Structural Elucidation of Impurity D
The IR spectrum of the impurity exhibited a sharp peak for carbonyl at 1745 cm–1 for ester. The peaks at 1637 cm–1 and 1660 cm–1 are due to an amido carbonyl group.
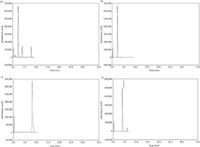
Figure 7: HPLC chromatograms of (a) ramipril sample spiked with samples of impurities D and L, (b) ramipril ID, (c) ramipril impurity D (ID), and (d) ramipril impurity L (ID). The chromatographic conditions were as discussed in the "HPLC" section.
The proton NMR showed a triplet at 1.35 ppm for three protons, a doublet at 1.6 ppm for three protons, a quartet at 4.2 for a CH2 proton, a multiplet at 1.8–3.8 ppm for 14 protons, and a multiplet at 7.2 for five aromatic protons (Figure 8). This added further support to the conclusion of the former being structure impurity D (Figure 9). This further confirms and supports that the impurity is D as per the European Pharmacopeia.

Figure 8: NMR and CMR spectra of ramipril impurity D.
Structural Elucidation of Impurity L
LC–MS-MS spectral data of impurity L are compared with the spectral data of impurity D. This impurity exhibited a molecular ion at m/z 415 (M+1) in the LC–MS-MS analysis. This molecular ion is exactly 16 amu more than that of impurity D. This impurity is formed as a result of the oxidation of impurity D.
The mass fragmentation of impurity L (Figure 4) supports the predicted chemical structure (Figure 10).
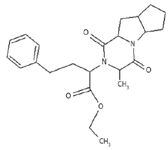
Figure 9: Structure of ramipril impurity D.
The IR spectrum of the impurity exhibited an additional broad hump at 3398 cm–1 , which was due to an OH group.
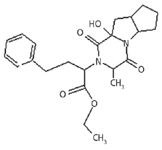
Figure 10: Structure of ramipril impurity L.
An additional signal in the proton NMR spectrum at 4.6 ppm was found to be exchanged with D2O. These observations indicated the presence of an OH group. The proton NMR further revealed a triplet at 1.35 ppm for three protons, a doublet at 1.6 ppm for three protons, a quartet at 4.2 for a CH2 proton, a multiplet at 1.8–3.8 ppm for 14 protons, and a multiplet at 7.2 for five aromatic protons (Figure 11). This added further support to the conclusion of the former being impurity L.
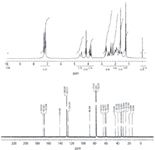
Figure 11: NMR and CMR spectra of ramipril impurity L.
The carbon nuclear magnetic resonance (CMR) spectrum shows the peak at 88.399 ppm, which was due to a carbon attached to alcohol. The spectral data confirm the structure of impurity L.
Conclusion
This article describes the identification, synthesis, and structural elucidation of a degradation product present in ramipril tablets. This impurity was detected and identified by LC–MS-MS. The impurity was further synthesized by selective oxidation of impurity D and purification by flash chromatography. The impurity was characterized using spectroscopic techniques.
Acknowledgments
The authors would like to thank Pharmasolve Laboratories (Mumbai, India) for providing necessary facilities and technical assistance.
N.P. Shetgiri and Amjad Anwari are with the Department of Chemistry, The Institute of Science, Mumbai, India.
Sudesh Bhure, Anirudha Rakhe,Sandeep Patil, and Rajendra Mukherjee are with the Department of Chemistry, The Institute of Science, Mumbai, India, and Pharmasolve, Vikhroli (West), Mumbai, India.
References
(1) T. Seeman, J. Dusek, and K. Vondrak, Am. J. Hypertens. 17, 415–420 (2004).
(2) M. O'Rourke, W. Nicholas, and E. O'Brien, Hypertension 46, 14 (2005).
(3) P. Todd and P. Benefield, Drugs 39, 110–135 (1990).
(4) Therapeutic Drugs, Sir Collin Dollery, Ed. (Churchill Livingstone, 1999), pp. R3–R6.
(5) S. Yusuf, P. Sleight. J. Pogue, J. Bosch, R. Davies, and G. Dagenais, N. Engl. J. Med. 342, 142–153 (2000).
(6) W. Fuelberth, R. Leeb, M. Radau, and W. Stammberger, US Patent 5,442,008.
(7) W. Fuelbreth, R. Leeb, M. Radau, and W. Stammberger, US Patent 5,151,433.
(8) Impurities in New Medicinal Products (ICH Q3B), CPMP/ICH/ 2738/99-ICH Q3B (R2) (Aug. 2003).

Advanced Raman Spectroscopy Method Boosts Precision in Drug Component Detection
April 7th 2025Researchers in China have developed a rapid, non-destructive Raman spectroscopy method that accurately detects active components in complex drug formulations by combining advanced algorithms to eliminate noise and fluorescence interference.
The Fundamental Role of Advanced Hyphenated Techniques in Lithium-Ion Battery Research
December 4th 2024Spectroscopy spoke with Uwe Karst, a full professor at the University of Münster in the Institute of Inorganic and Analytical Chemistry, to discuss his research on hyphenated analytical techniques in battery research.
Mass Spectrometry for Forensic Analysis: An Interview with Glen Jackson
November 27th 2024As part of “The Future of Forensic Analysis” content series, Spectroscopy sat down with Glen P. Jackson of West Virginia University to talk about the historical development of mass spectrometry in forensic analysis.