Terahertz Spectral Investigation of L-Cysteine Hydrochloride and its Monohydrate
Although terahertz waves are susceptible to water of crystallization (bound water), we found that the terahertz absorption spectra of cysteine hydrochloride (LCH) and its monohydrate (LCHM) are highly similar. To explain this particular phenomenon, density functional theory (DFT) and the independent gradient model (IGM) were used to obtain the vibration mode and intermolecular interaction of LCH and LCHM. The molecular polarities of LCH and LCHM were then obtained by calculating their molecular polarity index (MPI). The characteristic peak positions in the terahertz spectra of LCH and LCHM basically corresponded, with the superimposed interference of vibration modes and the van der Waals interaction between molecules concealing the expression of hydrogen bonds produced by bound water in the LCHM terahertz spectrum. In addition, the intensity of the characteristic peaks in the LCHM terahertz spectrum was higher because of its higher molecular polarity. In general, the analysis method combining THz-TDS and MPI provides a new theoretical reference for studying the relationship between biomolecules and water.
Terahertz waves are electromagnetic waves located between the microwave and infrared spectral regions, with a wavelength range of 0.03–3 mm (1). The timescales for the dynamics of water molecules affected by the presence of a molecule fall in the terahertz frequencies, specifically the sub-picosecond region (2). Therefore, in general, the changes of water of crystallization in biomolecules can be observed by the corresponding terahertz spectra (3–5). Pan and associates (6) found that the terahertz spectral characteristic peak position deviation of L-phenylalanine and its monohydrate originated from the hydrogen bonding produced by the water of crystallization in the monohydrate. Similarly, Yan and associates (7) studied the dehydration kinetics of methylene blue (MB) at different temperatures through the differences in the position of the characteristic absorption peaks of MB and its two hydrates in the terahertz spectra. These studies showed that most of the terahertz spectral differences between anhydrate and hydrates were mainly reflected in the position of the characteristic peaks. However, we found that the terahertz spectra characteristic peak positions of cysteine hydrochloride (LCH) and its monohydrate (LCHM) corresponded, and the latter’s intensity was higher, which is inconsistent with existing research.
Hydrochloric acid derivatives of cysteine generally include anhydrous form (LCH) and monohydrate form (LCHM). LCH is used as an antioxidant (8) and a scavenger of active oxygen in food chemistry (9). LCHM is an effective radiation protection drug (10) which can be used to prepare nonlinear optical crystals with excellent properties (11). Considering the importances of LCH and LCHM in medicine and optics, we have conducted a deeper study of their optical characteristics and other essential characteristics in the terahertz band. LCH and LCHM were selected as the experimental subjects, and their terahertz spectra were measured in the frequency range of 0.5 to 2.5 THz at 298 K. DFT and IGM were used to analyze the molecular interactions and the low-frequency vibration sources, respectively. MPI was calculated to study the influence of polar molecules on the terahertz spectra.
Materials and Methods
Materials
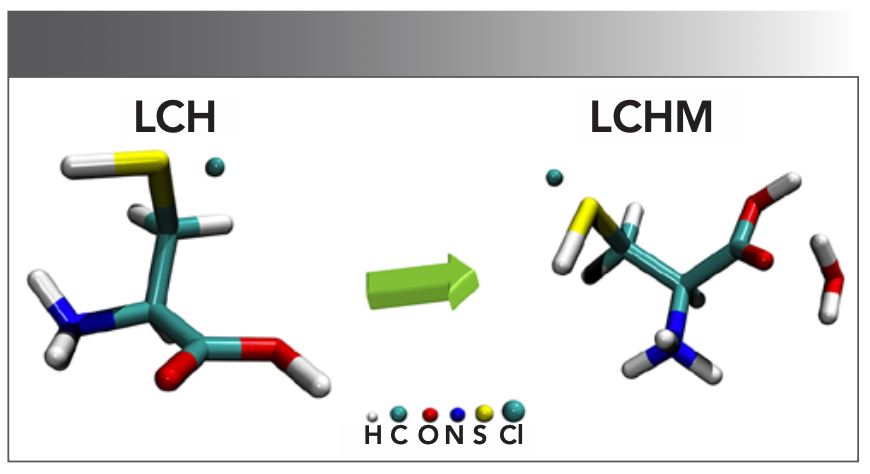
L-cysteine hydrochloride (LCH, assay ≥ 98%, CAS: 52-89-1) and L-cysteine hydrochloride monohydrate (LCHM, CAS: 7048-04-6) were the derived comparison sample; the high-density polyethylene (particles size 40–48 μm) powder was the substrate. All reagents were obtained from Sigma-Aldrich and without additional purification. The molecular structures of all reagents are shown in Figure 1 (12). All tablet densities must be uniform to obtain stable spectral data, so all reagents were passed through a 200-mesh sieve during preparation.
FIGURE 1: Molecular straw structures of LCH and LCHM. The atoms are designated as H (white), C (cyan cylinders), O (red), N (blue), S (yellow), and Cl (cyan spheres). Note the independent cyan spheres illustrated in LCH and LCHM are chlorine atoms.
THz-TDS Measurements
Each reagent was mixed with polyethylene powder at a ratio of 1:5 (reagent: 40 mg; polyethylene: 200 mg). After pressing the mixtures at 30 MPa for 3 min, the tablets with 13 mm diameter and 1.9 ± 0.05 mm thickness were obtained. THz-TDS were performed by the CIP–TDS (Da Heng New Epoch Technology Inc.). The dynamic range for the whole setup was better than 70 dB, and the frequency resolution was less than 5 GHz. During the measurement, the THz path was fully sealed, and high purity nitrogen was continuously purged to keep the humidity ≤ 3.7% to avoid water absorption. To get a good signal-to-noise (S/N) ratio, 300 scans were recorded and averaged. The spectra collection was carried out in a constant temperature and humidity laboratory with a temperature of 25 °C and a humidity of 30%. An HDPE tablet (200 mg) was also measured, and the obtained spectra were used as the reference in calculating the sample absorbance spectra. The baseline spectra were stable since the particle size and tablet thickness were adjusted, so other spectral processes, such as normalization, were not required.
We needed to further process the obtained THz time-domain spectra to obtain optical parameters of the sample, such as absorbance, absorption coefficient, and refractive index. By applying the fast Fourier transform (FFT), we would obtain the corresponding frequency-domain signals, which contain the THz amplitude of sample (Esam [ω]) and reference (Eref [ω]). Then, according to the Fresnel formula (13), the THz absorbance A(ω) can be obtained as follows:

Thermogravimetric Analysis (TGA)
TGA was performed using PYRIS 1 (Perkin Elmer). The samples were put in a corundum crucible and heated from 25 to 400 °C with a heating rate of 10 °C/min under a nitrogen atmosphere. The thermogravimetric (TG) curves of each reagent are shown in Supplementary Materials Figure S1 (at the bottom of the article).
Powder X-ray Diffraction (PXRD)
XRD patterns were performed using D8 Discover (Cu source, 50 kV voltage, 40 mA filament emission, Bruker Corporation). The samples were laid on the holder’s surface of the diffractometer and scanned through a 2θ range of 5–50°, with an angle of 0.2°.
Computational Method Details
Geometry Optimization and Vibration Analysis
The quantum chemistry calculation was based on solid-state density functional theory (DFT). All of the calculations were performed on the crystalline state within the generalized gradient approximation (GGA) at Perdew-Burke-Ernzerhof correlation (PBE) functional (14). Grimme’s dispersion-corrected method was used for DFT-D correction and norm-conserving pseudopotential, as implemented in CASTEP-20.11 (15) (Cambridge Sequential Total Energy Package). The crystalline structures of L-cysteine hydrochloride and its monohydrate were downloaded from Cambridge Crystallographic Data Centre (CCDC). The measured PXRD spectra of L-cysteine hydrochloride and its monohydrate were confirmed to be consistent with previously published unit cell parameters (16) (see Supplementary Materials Figure S2). There was no imaginary frequency in the calculated results for both LCH and LCHM, and no scaling factors were applied to the calculated frequency values. The quality of energy calculation was set to ultrafine. The plane-wave cut off energy was 830 eV.
Interaction Analysis and Polarity Analysis
To further explain the spectral differences, we combined Multiwfn (17) and VMD for independent gradient model (IGM) analysis, as proposed by Corentin and associates (18), and molecular polarity index (MPI) analysis (19). Unlike the traditional calculation methods, the interference between the atomic density gradients did not affect the phase when using IGM to calculate the initial molecular electron density gradient. The interaction area can be judged clearly through the graphical display of the three-dimensional real space function δg.

In the above formula, i is the atomic number; ρ is the gradient vector; abs (ρ) represents the absolute value of each component of the ρ vector (still maintaining the vector form), and | | represents the modulus of the vector. δg describes the interactions between all atoms in the system, and can be divided into δgintra(r) (showing intrafragment interactions) and δginter(r) (showing interactions between fragments). The δginter(r) formula required in the research is as follows:

where A is the fragment number of the molecule in the above formula. To visualize the calculated results when representing the interaction between molecules, the sign (λ2) rho function (20) was introduced, which is the symbol of the eigenvalue λ2 of the electron density Hessian matrix, which can be abbreviated as the sign (λ2). The noncovalent interactions between molecules can be judged using the sign (λ2) rho function to project the isosurface of δginter(r) in different colors. Among them, electrostatic attraction (hydrogen bond), van der Waals interaction, and electrostatic repulsion (nonbonded overlap) are expressed as blue, green, and red isosurfaces, respectively. It is worth noting that the IGM calculation must be based on the optimized molecular structure.
When discussing the relationship between samples’ polarity and their THz spectra, MPI was used (19) to quantify the understanding of polarity. This parameter can measure the system’s polarity based on the characteristics of the electrostatic potential distribution on the molecular surface. The integral form of the MPI formula is as follows:

In the above formula, the molecular surface S is integrated; V is the molecular electrostatic potential; and A is the molecular surface area. The uniformity of the charge distribution in the system reflects the polarity of the molecule. Uneven charge distribution will lead to extreme areas of the electrostatic potential on the molecular surface, which would increase the MPI. We calculated the MPI value of different substances based on Multiwfn and established a connection with the dielectric constant obtained from the spectrum.
Results and Discussion
THz Absorption Spectrum
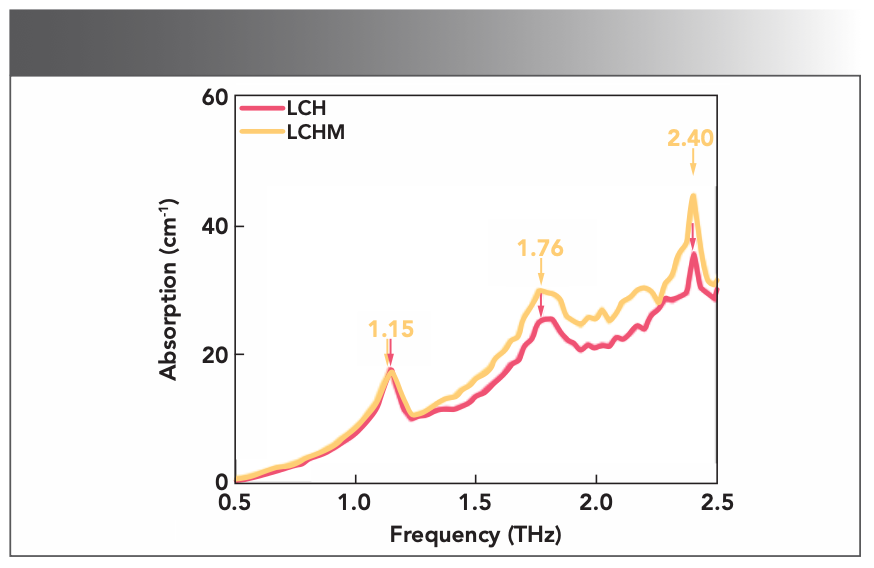
Observation and Analysis of L-cysteine Hydrochloride and its Monohydrate The measured THz time-domain signals were converted into absorption spectra by FFT, and the absorption spectra of cysteine and its derivatives are plotted in Figure 2. Under the test conditions, there is a significant noise increase in the high-frequency part of the spectrum of these substances, which increased the difficulty of locating characteristic peaks. The THz absorption spectra of LCH and LCHM are characterized by absorption peaks at 1.15, 1.76, and 2.40 THz. The characteristic peak positions of the LCH and LCHM are almost the same, but the characteristic peak widths are slightly different at 1.76 THz. We found that the experimental spectral results of LCH and LCHM only have slight differences in the intensity of the characteristic peaks, which is quite different from previous research. To explain these phenomena, we conducted the following series of studies based on quantum chemical calculations.
FIGURE 2: The experimental THz absorption spectra of LCH and LCHM.
At first, geometric optimization and vibration analysis were performed on the unit cell so as to analyze the source of terahertz characteristic absorption through DFT. Before obtaining the vibrational properties of these samples, Grimme’s dispersion-corrected method was combined to optimize their structures. The THz experimental absorption spectra and calculated spectra of the samples are summarized in Figures 3a and 3b. It can be seen that the calculated spectrum is relatively consistent with the experimental spectrum, with the subtle differences mainly due to the differences in temperature and crystal structure between actual testing and calculation simulations. This phenomenon shows that the chosen basis set and method are suitable for the current experiment, and can be used for further analysis (6,21). Additionally, we combined the VMD to perform vibration analysis on the calculation results to distinguish different vibration modes.
FIGURE 3: The experimental and calculated THz absorption spectra of (a) LCH and (b) LCHM. Also showing terahertz spectroscopy-active vibration modes of (c) LCH and (d) LCHM, and relevant simulated peak positions.
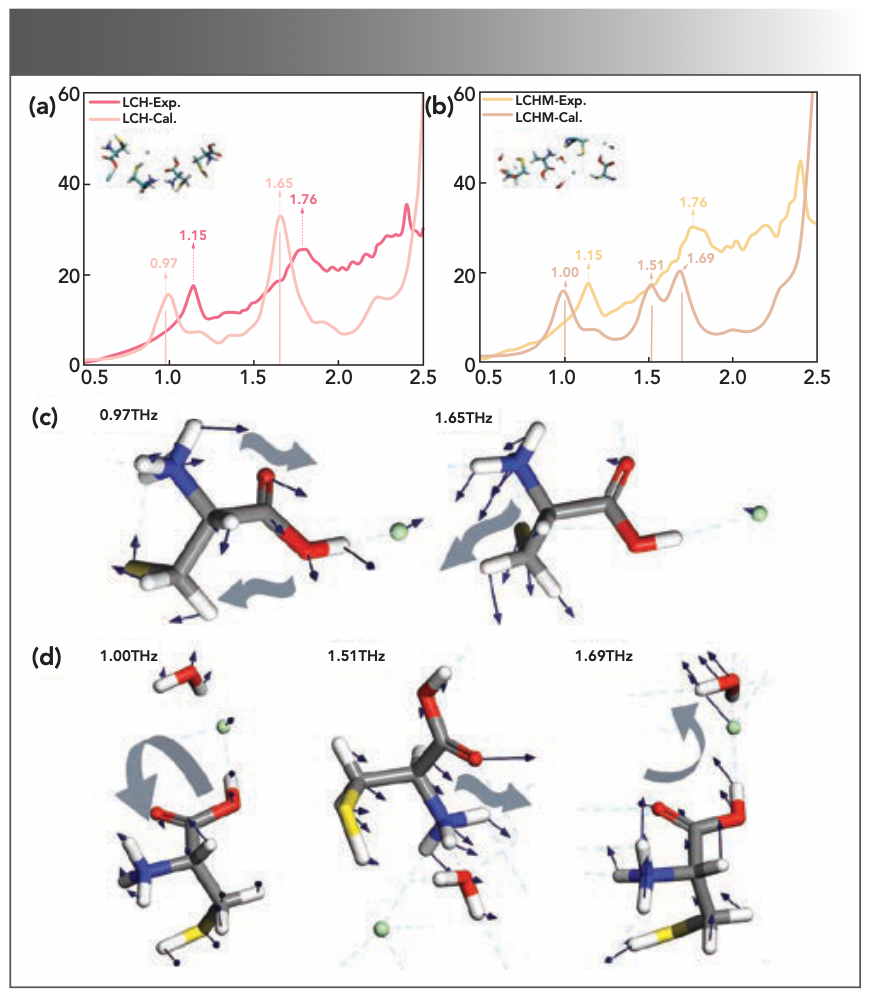
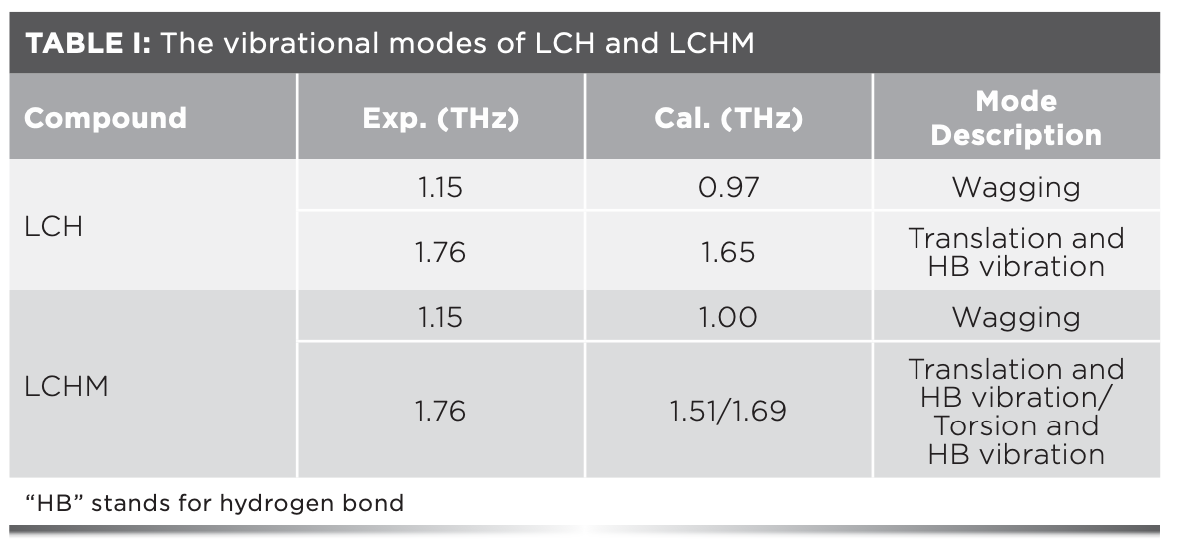
The detailed vibration mode analysis results of the two substances are plotted in Table I and Figures 3c and 3d. For LCH, the experimental peaks at 1.15 THz and 1.76 THz correspond to the calculated peaks at 0.97 THz and 1.65 THz, respectively. The former was led by the rocking vibration of the molecule, and the latter was led by the translational vibration of the molecule along the b-axis. For LCHM, the experimental peak at 1.15 THz corresponds to the calculated peak at 1.00 THz, which was led by the rocking vibration of the LCHM molecules, and the experimental peak at 1.76 THz corresponds to the calculated peaks at 1.51 THz and 1.69 THz, which were led by the translational vibration of LCHM molecules along the b-axis and the torsional vibration along the a-axis, respectively. It is worth mentioning that the vibration mode of the characteristic peak at 2.41 THz in the LCH and LCHM experimental spectra is uncertain, because the corresponding calculated peak may exceed the test range. Additionally, in the LCHM experimental spectrum, a broad experimental characteristic peak was formed by the superposition of two vibration modes, which may be led by various reasons. The temperature difference between the experiments and the calculations may be an influencing factor (22), and other factors still need further verification.
IGM Analysis of L-cysteine Hydrochloride and its Monohydrate
In addition to sensing the low-frequency vibration of lattice and molecular skeleton, THz-TDS is also very sensitive to the change of weak interaction between molecules (23,24). To obtain the corresponding information on the interactions within and between the fragments of the substance molecules, the IGM was selected in this study because the interaction between molecules in the selected area can be plotted with the information provided by the IGM. Therefore, the type and strength of the interactions in the system are visualized. The unit cell structures of LCH and LCHM were optimized using the method in 3.1, and the optimized unit cell structures were analyzed by IGM. The IGM isosurface of the two substances is shown in Figure 4a and 4b. The electrostatic attraction (such as hydrogen bonds), van der Waals effect, and electrostatic repulsion (such as non-bonded overlap) were marked with blue, green, and red, respectively.
FIGURE 4: IGM isosurface maps for (a) LCH and (b) LCHM models. Intermolecular interaction type derived from the value of sign( 2) (blue: sign(2) < −0.005 au, sign(2) (green: −0.005 au < sign(2) < 0.005 au, red: sign(2) > 0.005 au). where represents the quantitative parameter of the critical point of weak interaction in the IGM theory. (c) Dielectric constant spectra (real part of the dielectric spectra) of LCH and LCHM. (d) The relative permittivity and the normalized MPI results of the LCH and LCHM.
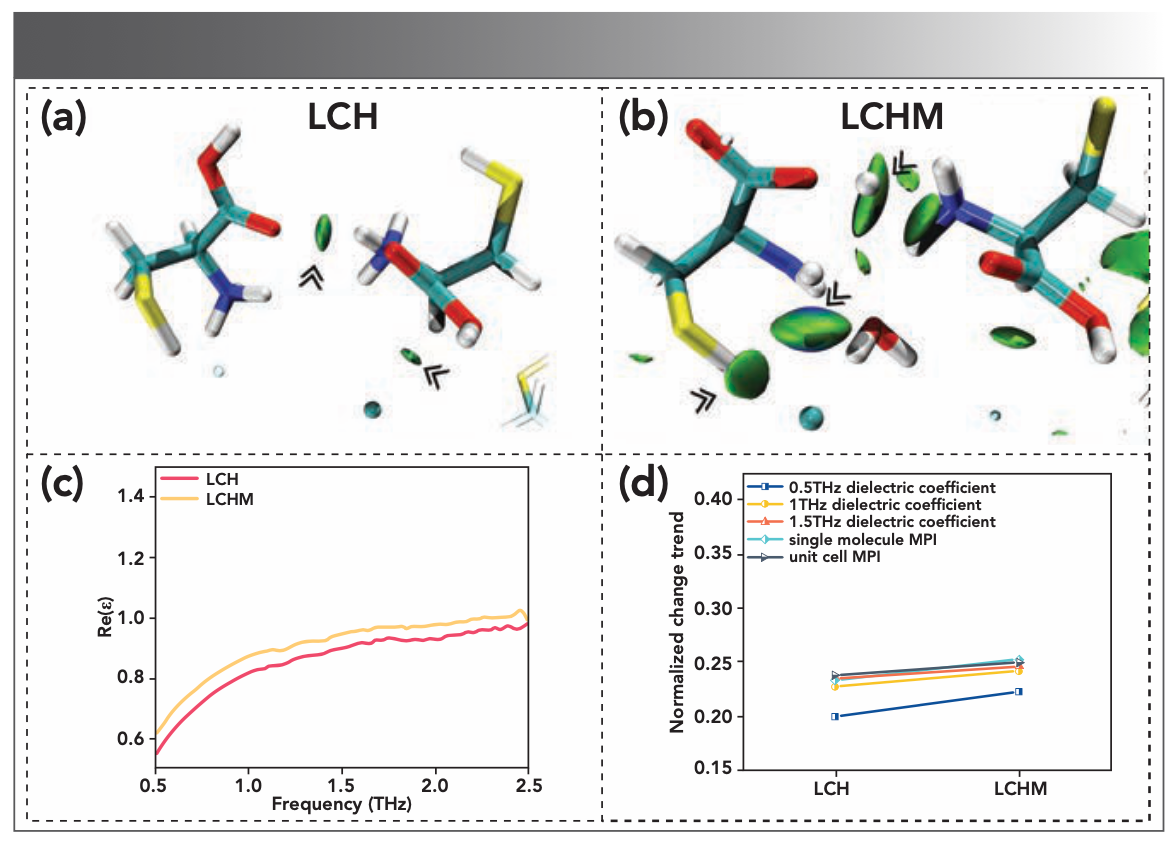
There is an apparent green isosurface between the chlorine atom and the cysteine molecule in LCH, indicating that the van der Waals interactions between LCH molecules are dominant. The inside of LCHM is mixed with the combined effect of hydrogen bond and van der Waals, and the intermolecular interaction is still dominated by van der Waals. It should be noted that the van der Waals force between LCHM molecules is stronger than LCH. Although the unit cell conformation of the LCH and LCHM varies greatly, the type of intermolecular interaction is still dominated by van der Waals interaction.
Based on the IGM analysis, we found the reason for the high similarity between the LCH and LCHM terahertz experimental spectra. After the water molecule and cysteine hydrochloride are combined, the hydrogen bond does not constitute the dominant interaction between the molecules—on the contrary, hydrogen bonds formed a stronger mixed interaction dominated by van der Waals interaction. Therefore, it is difficult to find the difference in the position of the spectral characteristic peaks on the terahertz spectra of LCH and LCHM. It is worth noting that the characteristic peak intensities are different in the terahertz spectra of LCH and LCHM. Considering that water molecules are polar, the addition of water molecules may increase the polarity of the LCHM, thereby affecting the intensity of the corresponding terahertz spectrum. To verify this conjecture, firstly, we calculated the MPI of LCH and LCHM, and then obtained the relative permittivity of the two through terahertz spectra to obtain the polarities of the two and analyzed the influence of the polarity on their corresponding terahertz spectra.
Polarity Analysis of L-cysteine Hydrochloride and its Monohydrate
Because polar molecules like water molecules affect the absorption of THz (25), we further explored the influence of material polarity on the intensity of THz spectra. First, the dielectric constant spectra of the two substances are obtained through THz dielectric spectra. Previous studies have shown that the relative permittivity of a molecule is closely related to its polarity (19). Generally, the higher the polarity, the higher the relative permittivity of the molecule. We would take the average of the test data of three sets of parallel samples with uniform thickness to reduce the error caused by the tablet density or porosity. The experimental results are plotted in Figure 4c. It can be seen that the dielectric constants of the samples show that LCH is less than LCHM. To prevent the influence of high-frequency scattering effects, the relative permittivity data at 0.5 THz, 1.0 THz, and 1.5 THz are selected to measure the two substances’ polarity further; these values are summarized in Table II.
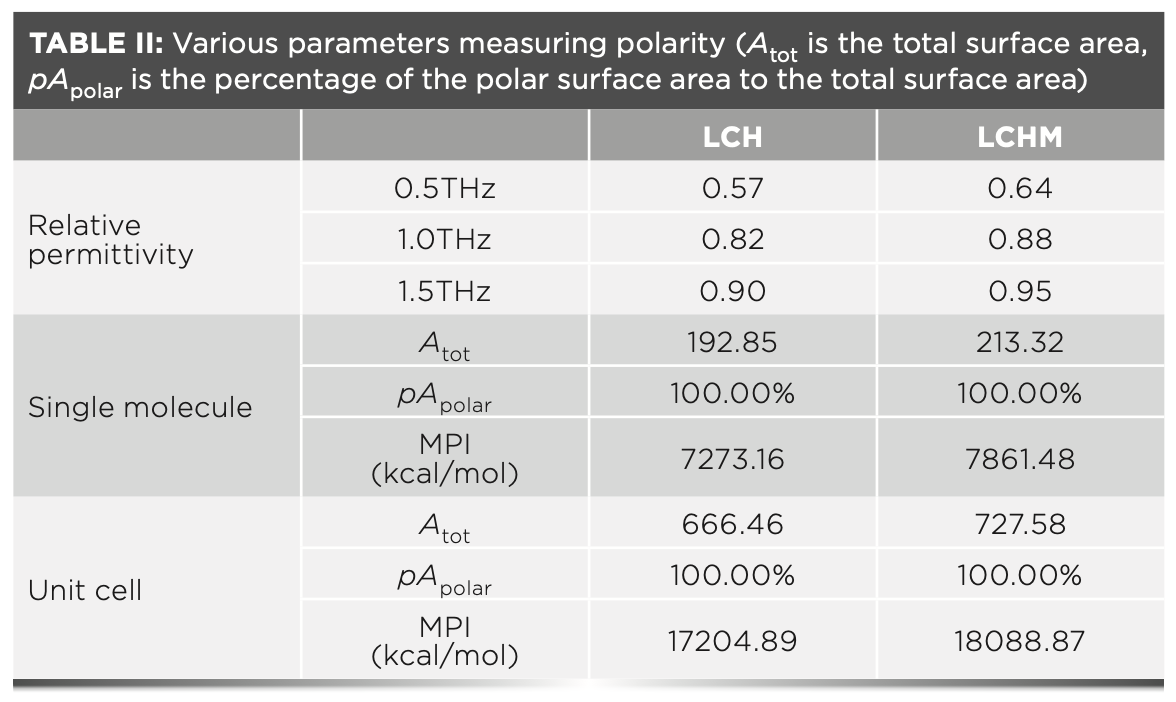
However, the relative permittivity is relatively unstable because of external influences. To verify the relative permittivity of the substances, we introduced MPI based on the calculation of the molecular electrostatic potential distribution (26). This parameter judges the polarity by using the characteristics of the electrostatic potential distribution on the molecular surface. We have calculated the MPI of the single molecule and the optimized unit cell, respectively. The MPI of the unit cell is the average value of the MPI calculated based on the unit cell in different vibration modes. The calculated results are also summarized in Table II. The order of polarity based on MPI is consistent with the result of relative permittivity.
To more intuitively observe the relationship between the polarity of the substance and the terahertz spectrum, the results obtained by the two methods are normalized and plotted in Figure 4d. Combining Table II and Figure 4d, we can see that the relative dielectric constants of the four materials at 1.0 THz and 1.5 THz are highly similar to MPI. However, the changing trend of the relative permittivity at 0.50 THz is quite different from the other two places because of the error caused by the background noise in the low-frequency spectrum (27). This result verified the relative consistency between the relative permittivity obtained by terahertz dielectric spectroscopy and the MPI results. The relative dielectric constants establish a connection between MPI and terahertz absorption spectra. Integrating the MPI and terahertz absorption spectra results, we can infer that the stronger the material’s polarity, the higher the intensity of the terahertz absorption characteristic peak, and the less its THz spectrum is affected by background noise and other factors. In addition, based on the experimental results of LCH and LCHM, this method shows high sensitivity.
The MPI results of single molecule and unit cell present consistent after normalization, which shows that MPI is hardly affected by molecular conformation and local polarity. Therefore, MPI can be used in terahertz spectroscopy because of its better anti-interference ability and stronger stability. Therefore, the polarity of the substance can be judged based on MPI before the spectrum test. The absorption intensity of the terahertz spectrum of the substance can then be predicted. Similarly, when analyzing terahertz spectra with similar structures, the difference in terahertz spectra can be predicted efficiently based on the MPI differences of substances.
Conclusion
In this study, we combined a series of quantum chemical calculations to conduct a systematic theoretical analysis of the difference between the terahertz spectra of LCH and LCHM. First, the characteristic vibration modes of the LCH and LCHM terahertz spectra were analyzed by DFT with dispersion correction. It was found that the characteristic peak at 1.76 THz in the experimental spectrum of LCHM is produced by the superposition of two vibration modes.
Second, the intermolecular interactions of LCH and LCHM were compared through IGM analysis, and it was found that both were dominated by the van der Waals effect. This finding indicates that the van der Waals interaction may conceal the expression of the hydrogen bonds generated by the water of crystallization in the LCHM terahertz spectrum.
Finally, we found that the more polar LCHM showed higher characteristic peak intensity in the terahertz absorption spectrum in further MPI analysis. Therefore, intermolecular interaction analysis and polarity analysis are also necessary for the study of terahertz spectroscopy. In short, this terahertz method provides a new theoretical reference for studying the relationship between biomolecules and water, which can have value in the fields of biology and medicine.
Supplemental Information
Figure S1 shows the PXRD information of L-cysteine hydrochloride and its monohydrate. Compared with the previously published unit cell parameters, we found that it is in good agreement with the experimental data. This shows that our experimental materials are reliable, and that the experimental materials’ lattice information is the same as the database.
FIGURE S1: PXRD data of (a) LCH and (b) LCHM.
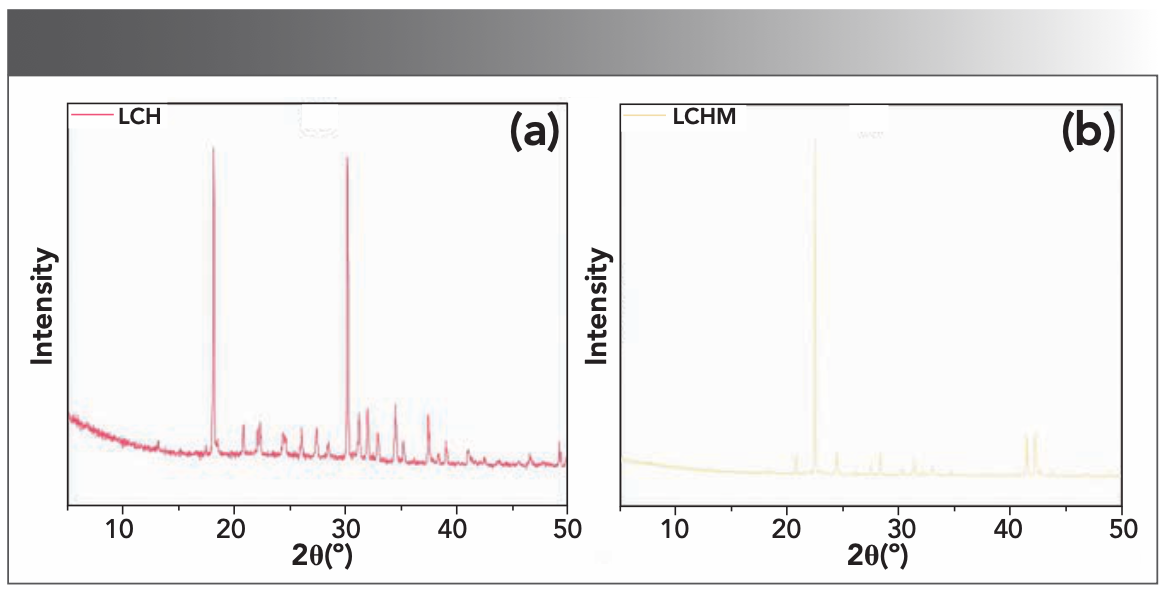
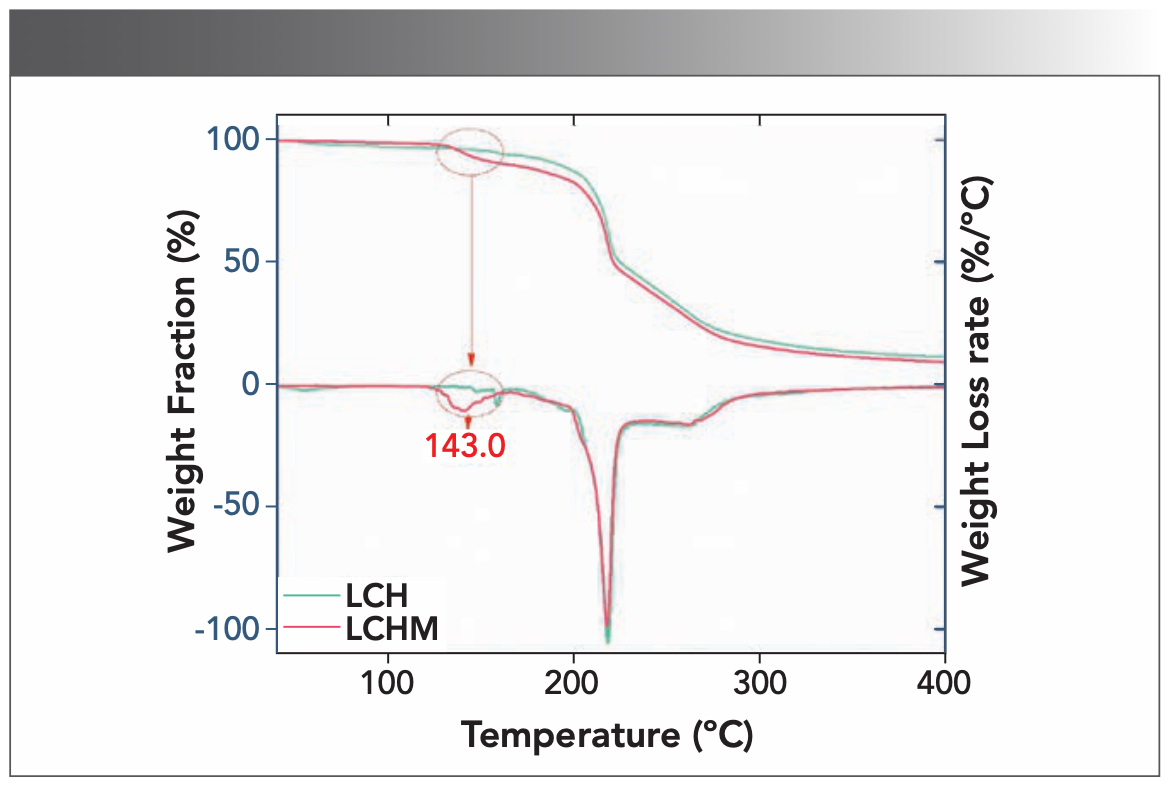
Figure S2 shows the TGA information of L-cysteine hydrochloride and its monohydrate. It can be seen that the water molecules escaped when the LCHM was at 143 oC. This verifies the accuracy of the experimental materials.
FIGURE S2: TGA data of LCH (green) and LCHM (red).
References
(1) Liang, J.; Zhang, X.; Wang, N.; Chang, T.; Cui, H. L. Vibrational Spectra of Pyrazinamide and Isoniazid Studied by Terahertz Spectroscopy and Density Functional Theory. Spectrochim. Acta A Mol. Biomol. 2020, 228, 117591. DOI: 10.1016/j.saa.2019.117591
(2) Morales-Hernandez, J. A.; Singh, A. K.; Villanueva-Rodriguez, S. J.; Castro-Camus, E. Hydration Shells of Carbohydrate Polymers Studied by Calorimetry and Terahertz Spectroscopy. Food Chem. 2019, 291, 94–100. DOI: 10.1016/j.foodchem.2019.03.132
(3) Takahashi, M.; Ishikawa, Y. Terahertz Vibrations of Crystalline α-D-glucose and the Spectral Change in Mutual Transitions Between the Anhydride and Monohydrate. Chem. Phys. Lett. 2015, 642 (2015), 29–34. DOI: 10.1016/j.cplett.2015.11.003
(4) Zhang, B.; Li, S.; Wang, C.; Zou, T.; Pan, T.; Zhang, J.; Xu, Z.; Ren, G.; Zhao, H. Terahertz Spectroscopic Investigation of Gallic Acid and its Monohydrate. Spectrochim. Acta A Mol. Biomol. 2018, 190, 40–46. DOI: 10.1016/j.saa.2017.09.004
(5) Zong, S. Q.; Ren, G. H.; Li, S. P.; Zhang, B.; Zhang, J. B.; Qi, W. P.; Han, J. G.; Zhao, H. W. Terahertz Time-Domain Spectroscopy of L-histidine Hydrochloride Monohydrate. J. Mol. Struct. 2018, 1157, 486–491. DOI: 10.1016/j.molstruc.2017.12.088
(6) Pan, T.; Li, S.; Zou, T.; Yu, Z.; Zhang, B.; Wang, C.; Zhang, J.; He, M.; Zhao, H. Terahertz Spectra of l-phenylalanine and its Monohydrate. Spectrochim. Acta A Mol. Biomol. 2017, 178, 19–23. DOI: 10.1016/j.saa.2017.01.050
(7) Yan, S. H.; Zhang, H.; Yang, Z. B.; Tang, M. J.; Zhang, M. K.; Du, C. L.; Cui, H. L.; Wei, D. S. Transformation and Dehydration Kinetics of Methylene Blue Hydrates Detected by Terahertz Time-Domain Spectroscopy. Rsc Adv. 2017, 7 (66), 41667–41674. DOI: 10.1039/c7ra07118c
(8) Li, T. T.; Wu, Q. X.; Zhou, Y. J.; Yun, Z.; Duan, X. W.; Jiang, Y. M. L-Cysteine Hydrochloride Delays Senescence of Harvested Longan Fruit in Relation to Modification of Redox Status. Postharvest Biol. Technol. 2018, 143, 35–42. DOI: 10.1016/j.postharvbio.2018.04.011
(9) Duan, X.; Zhang, H.; Zhang, D.; Sheng, J.; Lin, H.; Jiang, Y. Role of Hydroxyl Radical in Modification of Cell Wall Polysaccharides and Aril Breakdown During Senescence of Harvested Longan Fruit. Food Chem. 2011, 128 (1), 203–207. DOI: 10.1016/j.foodchem.2011.03.031
(10) Ren, G.; Zong, S.; Zhu, Z.; Cheng, C.; Chen, L.; Zhou, L.; Zhang, J.; Liu, L.; Han, J.; Zhao, H. Far-Infrared Terahertz Properties of L-cysteine and its Hydrochloride Monohydrate. Spectrochim. Acta A Mol. Biomol. 2020, 225, 117476. DOI: 10.1016/j.saa.2019.117476
(11) Prasad, P. V.; Visweswara Rao, T. K.; Ramachandra Rao, K.; Satya Kamal, C.; Samuel, T. Studies on Influence of Cd(2+) Ions in Unidirectional Growth and Characterization of l-Cysteine Hdrochloride Monohydrate Single Crystals. Spectrochim. Acta A Mol. Biomol. 2015, 136 (2015), 1950–1954. DOI: 10.1016/j.saa.2014.10.115
(12) Humphrey, W.; Dalke, A.; Schulten, K. VMD: Visual Molecular Dynamics. J. Mol. Graphics 1996, 14 (1), 33–38. DOI: 10.1016/0263-7855(96)00018-5
(13) Dorney, T. D.; Baraniuk, R. G.; Mittleman, D. M. Material Parameter Estimation with Terahertz Time-Domain Spectroscopy. J. Opt. Soc. Am. A 2001, 18 (7), 1562–1571. DOI: 10.1364/josaa.18.001562
(14) Perdew, J. P.; Burke, K.; Ernzerhof, M. Generalized Gradient Approximation Made Simple. Phys. Rev. Lett. 1996, 77 (18), 3865–3868. DOI: 10.1103/PhysRevLett.77.3865
(15) Clark, S. J.; Segall, M. D.; Pickard, C. J.; Hasnip, P. J.; Probert, M. I. J.; Refson, K.; Payne, M. C. First Principles Methods using CASTEP. Zeitschrift für Kristallographie - Crystalline Materials 2005, 220 (5-6), 567–570. DOI: 10.1524/zkri.220.5.567.65075
(16) Chapman, R. P.; Bryce, D. L. A High-Field Solid-State 35/37Cl NMR and Quantum Chemical Investigation of the Chlorine Quadrupolar and Chemical Shift Tensors in Amino Acid Hydrochlorides. Phys. Chem. Chem. Phys. 2007, 9 (47), 6219–6230. DOI: 10.1039/b712688c
(17) Lu, T.; Chen, F. Multiwfn: A Multifunctional Wavefunction Analyzer. J. Comput. Chem. 2012, 33 (5), 580–592. DOI: 10.1002/jcc.22885
(18) Lefebvre, C.; Rubez, G.; Khartabil, H.; Boisson, J. C.; Contreras-Garcia, J.; Henon, E. Accurately Extracting the Signature of Intermolecular Interactions Present in the NCI Plot of the Reduced Density Gradient Versus Electron Density. Phys. Chem. Chem. Phys. 2017, 19 (27), 17928–17936. DOI: 10.1039/c7cp02110k
(19) Liu, Z. Y.; Lu, T.; Chen, Q. X. Intermolecular Interaction Characteristics of the All-Carboatomic Rng, Cyclo[18]carbon: Focusing on Molecular Adsorption and Stacking. Carbon 2021, 171, 514–523. DOI: 10.1016/j.carbon.2020.09.048
(20) Johnson, E. R.; Keinan, S.; Mori-Sanchez, P.; Contreras-Garcia, J.; Cohen, A. J.; Yang, W. Revealing Noncovalent Interactions. J. Am. Chem. Soc. 2010, 132 (18), 6498–6506. DOI: 10.1021/ja100936w
(21) Allen, J. L.; Sanders, T. J.; Horvat, J.; Lewis, R. A. Anharmonicity-Driven Redshift and Broadening of Sharp Terahertz Features of Alpha-Glycine Single Crystal from 20 K to 300 K: Theory and Experiment. Spectrochim. Acta A Mol. Biomol. 2021, 244, 118635. DOI: 10.1016/j.saa.2020.118635
(22) Chen, L.; Ren, G.; Liu, L.; Guo, P.; Wang, E.; Zhu, Z.; Yang, J.; Shen, J.; Zhang, Z.; Zhou, L.; et al. Probing NaCl Hydrate Formation from Aqueous Solutions by Terahertz Time-Domain Spectroscopy. Phys. Chem. Chem. Phys. 2020, 22 (32), 17791–17797. DOI: 10.1039/d0cp01571g
(23) Ding, L.; Fan, W. H.; Song, C.; Chen, X.; Chen, Z. Y. Terahertz Spectroscopic Investigation of Salicylic Acid and Sodium Salicylate. J. Appl. Spectrosc. 2019, 85 (6), 1143–1150. DOI: 10.1007/s10812-019-00773-w
(24) Wang, F.; Zhao, D.; Dong, H.; Jiang, L.; Liu, Y.; Li, S. Terahertz Spectra of DNA Nucleobase Crystals: A Joint Experimental and Computational Study. Spectrochim. Acta A Mol. Biomol. 2017, 179, 255–260. DOI: 10.1016/j.saa.2017.02.037
(25) Li, J.; Yao, Y. X.; Jiang, L. W.; Li, S.; Yi, Z. H.; Chen, X. Y.; Tian, Z.; Zhang, W. L. Time-Domain Terahertz Optoacoustics: Manipulable Water Sensing and Dampening. Adv. Photonics 2021, 3 (2). DOI: 10.1117/1.Ap.3.2.026003
(26) Lu, T. Multiwfn Manual, version 3.7, Section 3.15.1, available at http://sobereva.com/multiwfn (accessed Sep 29, 2020).
(27) Nickel, D. V.; Garza, A. J.; Scuseria, G. E.; Mittleman, D. M. The Isotropic Molecular Polarizabilities of Single Methyl-Branched Alkanes in the Terahertz Range. Chem. Phys. Lett. 2014, 592, 292–296. DOI: 10.1016/j.cplett.2013.12.055
Xun Zhang, Bin Yang, Zhenqi Zhu, Yujing Bian, Ruonan Zeng, and Wenlong Zhou are with the College of Textile Science and Engineering (International College of Silk) at Zhejiang Sci-Tech University, in Hangzhou, Zhejiang, PR China. Bin Yang is also with the Key Laboratory of Advanced Textile Materials and Manufacturing Technology of the Ministry of Education at Zhejiang Sci-Tech University. Direct correspondence to: yangbin665959@gmail.com ●

Geographical Traceability of Millet by Mid-Infrared Spectroscopy and Feature Extraction
February 13th 2025The study developed an effective mid-infrared spectroscopic identification model, combining principal component analysis (PCA) and support vector machine (SVM), to accurately determine the geographical origin of five types of millet with a recognition accuracy of up to 99.2% for the training set and 98.3% for the prediction set.
Authenticity Identification of Panax notoginseng by Terahertz Spectroscopy Combined with LS-SVM
In this article, it is explored whether THz-TDS combined with LS-SVM can be used to effectively identify the authenticity of Panax notoginseng, a traditional Chinese medicine.