Terahertz Spectrometry and Reflectometry: A New Frontier for Noninvasive Picoscale Investigations
Terahertz spectroscopy is suitable for interrogating molecular motions that are not easily visible with other methods, providing an opportunity to discover critical molecular signatures.
A wide broadband terahertz spectrometer was used to illustrate unique applications of terahertz spectroscopy as an analytical tool. Following a brief discussion on spectrometer calibration, illustrative examples are outlined for a chemical compound from the Department of Homeland Security, nanoparticles with ligand, and contamination in gasoline. It was found that the technique is suitable for interrogating molecular motions that are not easily visible by other methods such as UV, infrared, or Raman spectroscopy.
Spectroscopy is the tool of choice for investigations of molecular structures. Probing molecular properties such as resonances is the key for a number of real-world applications including sensing, detection, identification, and diagnostics. Recently, scientists have been increasingly confronted with the term "terahertz spectrometry," which is not commonly found in the standard spectroscopy textbooks, nor does it appear in the classical molecular spectroscopy bible by Gerhard Herzberg (1). There are terms such as "far-infrared spectroscopy" or submillimeter waves that have been used in the literature for portions of the electromagnetic spectrum implying a part of the terahertz region.
Although the term "spectrophotometer" has traditionally been used based on the fact that most spectrometer's functionality depends on the measurements of light of one kind or another, the terahertz spectrometer deploys a different mode of measurements; that is, the time-domain measurements based on electro-optic sampling. Therefore, most authors in this area use the term "terahertz time-domain spectroscopy" (THz-TDS). Increasingly, the practitioners of molecular spectroscopy are expecting the branch of terahertz science and technology to be the mainstream of spectroscopy because of some unique capabilities offered by this newer tool. Until recently, this portion of the electromagnetic spectrum used to be referred to as the "terahertz gap." However, with the discovery of compact and high efficiency terahertz sources, it is no longer a gap; instead terahertz spectroscopy is emerging as the main mode of spectroscopic investigation.

Table I: Comparison of measured polyethylene peaks with those reported in the literature
Most electronic-based technologies are built around the magic material group known as "semiconductors." As such, photonics technologies have also been trying to follow the time-honored tradition of riding on the proven semiconductor technology; perhaps this is the main reason that photonics-based devices are still not in the forefront of modern day applications. Even though lasers are generally considered a photonics device, it is exclusively a special application of semiconductors except for a few organic materials-based efforts. Nevertheless, lasers qualify as "photonics" because the word photonics implies control of photons (or light). The biggest handicap for the flourishing of photonics technologies comes from the inability of forming an "integrated circuit" with photons, because inherently photons lack a charge state of being either negative or positive (unlike the electrons). Consequently, to define the binary 1's and 0's by the photons is still not possible. Another factor is that for photonics integration there is no magic material like silicon or semiconductor in general. Therefore, fabrication of most functional photonic devices requires marrying of the different materials for instilling required functionalities; this is the so-called hybrid integration, which is often prone to failure by thermal degradation.
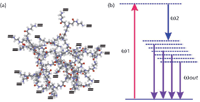
Figure 1: (a) Molecular structure of a third-generation dendrimer. The terminal groups each have two sites available where dopant molecules may be attached. Thus, a distribution of dipoles per molecule is possible via chromophore doping. (b) Schematic of energy level diagram in dendrimer molecule resulting from chromophore doping and poling. A distribution of dipole moments will create multiple bands via which a broadband emission dendrimer dipole excitation (DDE) is energetically possible.
In this article, some unique capabilities of terahertz technology are outlined. In particular, some background of terahertz generation from electro-optic dendrimer is outlined and some practical experimental systems are used to introduce this emerging branch of spectroscopy.
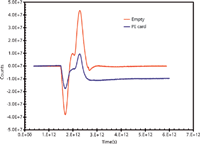
Figure 2: Time-domain signal of the empty spectrometer exhibits a very high signal-to-noise ratio.
Terahertz Generation for Spectroscopy Use
Here, a nanomaterial called dendrimer plays an important role by enabling monolithic photonic integration (2). Terahertz generation from dendrimer exploits its one special property, that is, its multifunctional molecular architecture that is capable of being doped by chromophores and thereby creates a high second-order susceptibility (χ(2)) material, termed an electro-optic dendrimer. The process is described elsewhere (3), and suffice it to mention here that more than 5 mW continuous wave (CW) terahertz power has been obtained with very high stability. Such a source is suitable for spectroscopy applications. Furthermore, a wide broadband terahertz range of up to >30 THz has also been possible (4), which is important for probing closely spaced molecular phenomena. The key property of dendrimer is the ability to create a dipole moment distribution via the distribution of charge centers in a doped dendrimer molecule (see Figure 1): μ(r) = Ql(r), where μ is the dipole moment and Q is the charge. Note here that l, the separation between the charge centers, is not fixed but is a function of the coordinate, l(r), of the charge centers themselves. Consequently, the energy level diagram in Figure 1b has multiple quasi states within the bandgap. When excited by a suitable pump laser combination, this dipole moment distribution generates a wide-range terahertz radiation via broadband emission. This is termed the dendrimer dipole excitation (DDE) process. A spectrometer was designed based on this principle and has been described elsewhere (4).

Figure 3: Fourier transform magnitude spectrum card of the polyethylene card obtained from the time-domain signal of Figure 2. The absorbance peaks (downward peaks) are compared in Table I.
Spectrometer Calibration
Unlike the predecessor spectrometers, a terahertz spectrometer carries out its measurements in time-domain. As illustrated in the literature (5), when a stationary beam is scanned by an interrogating beam, an interferogram is generated because of the interference of the two beams. The intensity distribution is then captured by a pair of detectors (5). Figure 2 exhibits the time-domain pulses (or interferogram) generated when no sample is present and when a polyethylene card is placed in the spectrometer. A self-calibrating algorithm is implemented to minimize the effect of atmospheric moisture. A sample must be placed in the spectrometer for it to be measured; otherwise, the spectrometer will produce the "empty" interferogram. A Fourier transform magnitude spectrum corresponding to the time-domain signal of the polyethylene card (Figure 2) is shown in Figure 3 and reveals that the terahertz spectrum spans up to ~40 THz. In practical measurements, the polyethylene card spectrum will serve as the background but when the sample is placed on another substrate (for example, a glass slide), then the blank substrate spectrum will serve as the background.
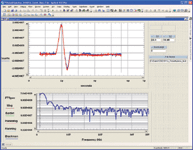
Figure 4: The front-end for spectral data acquisition.
Calibration of a spectrometer involves reproducing known absorption peaks of standard materials to ensure measurement accuracies in a given spectral region. As previously mentioned, a terahertz spectrometer deploys time-domain measurement where the sample response resulting from the molecular interaction is recorded; the frequency spectrum is then obtained by means of Fourier analysis. Here, the absorbance is expected to exhibit established peaks of known standards. While the known peaks of polyethylene have been reproduced, however, the spectrometer yields additional peaks because of its high sensitivity. We hypothesize that these additional peaks become visible by the interaction of terahertz radiation with the polyethylene matrix. Terahertz radiation is sensitive to resonances because of translational, rotational, vibrational, and torsional motions. Additional peaks are thus expected, and therefore, justify the emergence of a new spectrometer where indeed additional information is generated that is not available from its predecessors.
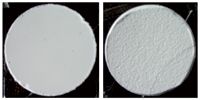
Figure 5: Terahertz demonstration sample (diameter: 2 in.; thickness: ~0.35 in.) from Dr. Wilkinson's laboratory. Left: smooth side; right: rough side.
The Fourier transform process has a number of different manifestations to suit the versatility of experimental measurements. In addition, short-time Fourier transform and wavelet transform allow examining data simultaneously in time- and frequency-domain via 3-D plots. Furthermore, techniques such as Prony frequency spectrum, auto regressive spectrum, and eigen analysis spectrum allow one to learn details about the specimen's molecular properties (8).
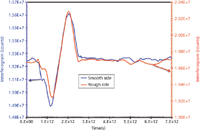
Figure 6: Time-domain signal (interferogram or terahertz pulse) of the DHS sample shown in Figure 5. The pulses are generated by an arrangement where the detection system was very close to the reflecting surface. The frequency domain spectra are shown in Figure 7.
Experimental
In this section, a few example experiments are illustrated. Some were produced utilizing a polyethylene card mounted on the xyz-stage; centered and positioned for maximum transmission. The spectrometer used here (TeraSpectra, Applied Research and Photonics) allows analysis of samples in solid, liquid, or gaseous states. For specimens that may be dissolved in aqueous or in organic solvents, the solution is dispensed on a substrate. For example, 20–30 μL of solution is placed on a polyethylene card and allowed to dry at room temperature to produce a spot. Alternatively, 30–50 μL of solution is dispensed on a glass slide and dried on a hot plate at ~40 °C to create a spot. A xyz-stage is used to introduce the spot in the beam path. The stage helps position the spot for maximum interaction by the beam. Although the terahertz beam is collimated to produce a homogeneous field over a large diameter (~1 in.), in real systems, the collimated beam still has some intensity distribution that resembles a wide Gaussian peak. As a result, the xyz-stage is used to position the sample spot at the most intense portion of the beam. For liquid samples, a special cuvette was used that has a wide area (~1" dia) and short path length (~1 mm). This is especially suitable for aqueous solutions because water absorbs terahertz radiation relatively strongly; although a 2–3 mm pathlength in aqueous media is allowable with reasonable transmission because of the high power source installed in spectrometer. For gaseous samples, pathlength is not an issue: A sealed rectangular container fitted with gas-in and gas-out orifices is used, with transparent side walls for beam propagation. In all cases, the sample being measured is introduced in the beam path without any external disturbance of the sample. At that point, the front-end software is used for recording the interferogram. A snap-shot of the front end is shown in Figure 4.
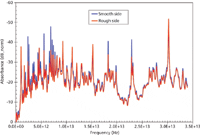
Figure 7: Fourier transform absorbance spectra corresponding to the interferogram of Figure 6.
Results and Discussion
Here, the results of a few sample experiments are described as practical illustrations of investigations that can be conducted with this high-sensitivity terahertz system.
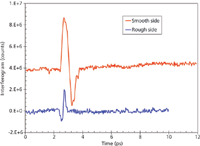
Figure 8: Normalized time-resolved spectra of gasoline (red) and chromium(III) acetate hydroxide ([CH3CO2]7Cr3[OH]2) solution in gasoline at 1.91 mg/mL (blue). The presence of salt in gasoline reduces the transmission of terahertz power through the sample.
Simulated Explosive-Like Sample
The Department of Homeland Security (DHS) sample was received courtesy of Dr. John Wilkinson from the Naval Surface Warfare Center Research Department in Indian Head, Maryland. The supplied sample is a common pharmaceutical compound that is not flammable or caustic, but its exact molecular composition is unknown. The disk has a 2-in. diameter and its thickness is ~0.35 in. One side is smooth and the other side is roughened with 100 grit sandpaper (see Figure 5). Here, the objective is to generate terahertz spectra of the supplied sample in the reflection mode. Despite differences in surface texture, the detected spectra should be able to uniquely identify the compound. The spectrometer was reconfigured by adding optics for the purpose of reflection measurements where the terahertz beam was reflected off of the sample into the detection system. Figure 6 shows the temporal reflection signal from both smooth and rough surfaces. The pulses are generated by an arrangement where the detection system was kept close to the reflecting surface. The frequency-domain spectra corresponding to the pulses are shown in Figure 7. As can be seen, both spectra overlap consistently, indicating that the sample may be identified regardless of its surface texture. However, because these measurements were done keeping the sample in close proximity to the detection system, the effect of distance must be carefully calibrated to pinpoint the common features in the spectra. A protocol then must be worked out for remote identification of the actual chemical ingredients. In view of Figure 7, it is evident that the specimen under test (SUT) exhibits rich spectral features over the entire range of 0.1 to ~35 THz. After the spectral signature of the real (known) compound is established, then either a deterministic or a statistical model may be used to identify the ingredients from remotely measured spectra.

Figure 9: Fourier spectra of gasoline (red) and 1.91 mg/mL CrAH solution (blue) corresponding to the time-resolved spectra of Figure 1. The spectra are clearly different allowing differentiating between the two samples. (Cuvette effect, if any, was not subtracted.)
Gasoline Contamination
The detection of a small amount of contaminant in fuel (such as gasoline or diesel) is of practical importance. This can be conveniently done by terahertz measurements. For example, the detection of chromium salt in regular gasoline was attempted. Chromium(III) acetate hydroxide (CrAH, [CH3CO2]7 Cr3 [OH]2) (Aldrich) was dissolved in gasoline at 1.9105 mg/mL. A rectangular cuvette with a volume of ~1.5 mL and a pathlength of ~1 mm was used to introduce both the pure and CrAH-contaminated samples in the beam path. Time-resolved spectra of both pure and mixed gasoline are shown in Figure 8. It is seen that gasoline alone has a higher transmission compared to the CrAH contaminated one. Figure 9 shows the Fourier transform frequency spectra corresponding to the interferogram of Figure 8. There are significant identifying features in the respective spectra that can be exploited for discerning the contaminated gasoline from the uncontaminated one. An interesting observation is that at low frequencies (below ~1.5 THz, Figure 9, red curve) gasoline exhibits higher transmission than CrAH-contaminated gasoline (blue curve). However, at higher frequencies (above ~1.5 THz) gasoline exhibits a lower magnitude than that of the CrAH-mixed gasoline (Figure 9). Thus, the frequency-dependent behavior of the two specimens reveals some interesting molecular interaction between the CrAH and gasoline that needs to be investigated further for molecular level conclusions.

Figure 10: The sequence of reactions yielding the aminated (NH2âterminated) nanodiamond: ND-EDA (ethylenediamine).
Nanoparticle-Ligand System
Nanodiamond (ND) is a promising material as a nontoxic, carbon-based, solid drug delivery platform. Functional nanodiamonds are expected to be effective as carriers for the therapeutics. Nanodiamonds have been reported as vectors for in vitro gene delivery via surface-immobilization with 800 Da polyethyleneimine (PEI800) and covalent conjugation with amine groups (8). The sequence of reactions yielding the aminated (NH2–terminated) nanodiamond ND-EDA (ethylenediamine) is shown in Figure 10 (9). However, without accurate quantitation of the degree of amination of a nanodiamond particle surface (amine–nanodiamond), its use in emerging applications such as targeted drug delivery, diagnostics, pharmaceuticals, and antimicrobials cannot be fully exploited. Fourier transform infrared (FT-IR) and Raman spectroscopy do not adequately quantify the degree of amination; gas chromatography (GC) and mass spectrometry (MS) cannot discern sp3 (diamond phase) and sp2 (graphene phase) content. The most promising analytical technique available is nonionizing terahertz spectroscopy (5). Nanodiamond and amine-terminated nanodiamond samples (samples courtesy of S.C. Picardi) (10) were prepared as follows: 1% dispersant of the respective materials in powder form were prepared in deionized water at room temperature. Aliquots of 30 μL of each dispersant were dispensed on glass slides and allowed to dry at 50 °C for ~10 min. The resulting spots were introduced in the spectrometer's beam path, and the response of the samples were recorded by the front-end. Figure 11 exhibits the Fourier transform absorbance spectra of both samples. It can be seen that aminated nanodiamond exhibit significantly higher absorbance than the nonaminated nanodiamond. It is expected that the low frequency offset should scale as a function of the degree of amination per nanodiamond. Thus, the spectra enable the formulation of criteria to be able to quantify the degree of amination of the nanodiamond particles. For example, the absorbance magnitude at low frequencies will be proportional to the number of amine molecules attached to the nanodiamond surface. Also, the shift of the absorbance peaks at different frequencies may be assigned to different molecular interactions. A systematic investigation should lead to an analytical protocol for routine and deterministic applications.

Figure 11: Broadband terahertz absorbance spectra of nanodiamond and amine-terminated nanodiamond obtained via Fourier analysis of the temporal signals (not shown). The aminated nanodiamond exhibits significantly higher absorbance.
Conclusion
Terahertz spectroscopy has been discussed in terms of practical examples. An important property of terahertz radiation is that it can penetrate almost all nonmetallic objects without causing radiation damage. This presents an opportunity to study intrinsic properties of materials in their native states. A wide broadband terahertz spectrometer was utilized to illustrate some unique applications of this tool. A brief discussion of the spectrometer calibration was also included. Illustrative examples exhibit that the method offers very high sensitivity measurements of chemical compounds for DHS applications, characterization of nanoparticles for quantitation of surface ligand coverage, and the determination of contamination in gasoline, among many others. It was found that the technique is suitable for interrogating molecular motions that are not easily visible by other methods such as UV, IR, or Raman spectroscopy. Thus, the terahertz spectrometer not only reproduces the known absorbance peaks of standard materials, it generates many peaks that were not visible with the previous spectroscopic methods. The difficulty, however, is that interpretation of these newly discovered peaks may not be readily available. The technique provides a unique opportunity for discovering critical molecular signatures of a cross-section of materials.
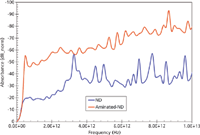
Figure 12: A close-up of Figure 11. The jump in absorbance of aminated nanodiamond can be exploited for formulation of a protocol for deterministic calculation of degree of amination.
Anis Rahman is with Applied Research & Photonics in Harrisburg, Pennsylvania. Direct correspondence to: a.rahman@arphotonics.net.
References
(1) A.J. Barnes et al., J. Mol. Struct. 1006(1–3), 1 (2011).
(2) A. Rahman and D. Tomalia, Novel Photonic Waveguide Structures for Chip-Scale Photonic Integrated Circuit. US Patent No. 7389029 B2, Jun. 17, 2009.
(3) A. Rahman, in SPIE Proceedings Vol. 7601: Terahertz Technology and Applications III, L.P. Sadwick and C.M. O'Sullivan, Eds., 7601, 76010C (2010).
(4) A. Rahman and A.K. Rahman, Wide Range Broadband Terahertz Emission From High χ(2) Dendrimer. Proc. of SPIE: Terahertz Technology and Applications V, L.P. Sadwick and C.M. O'Sullivan, Eds., 8261, 82610H (2012).
(5) A. Rahman, J. Mol. Struct.1006, 59–65 (2011).
(6) Sigma-Aldrich, Polyethylene spectrophotometric grade. http://thzdb.org/image.php?image=000000773, 2007.
(7) FreeSnell, Polyethylene http://people.csail.mit.edu/jaffer/FreeSnell/polyethylene.html.
(8) Terahertz Spectrometer (TeraSpectra) Brochure: http://arphotonics.net/TeraSpectraBrochure_spec_2011_.pdf.
(9) X.-Q. Zhang, M. Chen, R. Lam, X. Xu, E. Osawa, and D. Ho, ACS Nano3(9), 2609–2616 (2009).
(10) V. Mochalin and Y. Gogotsi, J. Am. Chem. Soc.131(13), 4594–4595 (2009).
(11) I. Neitzel, M. Sullivan, V. Mochalin, G. Palmese, and Y. Gogotsi, "Nanodiamond Polymer Composites," presented at the MRS Symposium, Boston, Massachusetts, 2010.

LIBS Illuminates the Hidden Health Risks of Indoor Welding and Soldering
April 23rd 2025A new dual-spectroscopy approach reveals real-time pollution threats in indoor workspaces. Chinese researchers have pioneered the use of laser-induced breakdown spectroscopy (LIBS) and aerosol mass spectrometry to uncover and monitor harmful heavy metal and dust emissions from soldering and welding in real-time. These complementary tools offer a fast, accurate means to evaluate air quality threats in industrial and indoor environments—where people spend most of their time.
NIR Spectroscopy Explored as Sustainable Approach to Detecting Bovine Mastitis
April 23rd 2025A new study published in Applied Food Research demonstrates that near-infrared spectroscopy (NIRS) can effectively detect subclinical bovine mastitis in milk, offering a fast, non-invasive method to guide targeted antibiotic treatment and support sustainable dairy practices.