Terahertz Spectroscopic Analysis of Co-Crystallized Mixtures in an L-threonine Diastereomer System
Terahertz (THz) resonance absorption originates from intermolecular interactions, which are suitable for identifying amino acids with multiple isomers. L-threonine and L-allo-threonine are diastereomers with two characteristic peaks in the effective spectrum range of 1.0–2.3 THz, which are located at 1.42 and 2.14 THz for L-threonine (L-thr) and 1.63 and 2.16 THz for L-allo-threonine (L-allo-thr). Based on the density functional theory (DFT) of the crystal structures of L-thr and L-allo-thr, the vibration frequencies of 1.56, 1.87, 2.16 THz, and 2.22 THz were obtained, corresponding to the THz characteristic peaks. Through vibration model analysis, it was found that lattice and skeleton vibrations mediated by intermolecular hydrogen bonds play a crucial role in the THz response. Studying the experimental absorption spectra of different proportions co-crystallized mixtures and 1:1 physical mixture of L-thr and L-allo-thr, it was found that the characteristic peaks of the physical mixture include the characteristic peaks of the two diastereomers in the THz band, while amino-acid co-crystallized mixtures formed their own characteristic peaks depending on the proportion. The results show that the co-crystallized mixture composition of diastereomers can be quantitatively analyzed by THz time-domain spectroscopy (THz-TDS).
As one of the eight essential proteinogenic amino acids, L-threonine (L-thr) is required for body growth, uric acid metabolism, and the immune system. L-allo-threonine (L-allo-thr) is used as a starting material in the chemical synthesis of lysobactin, which displays strong antibiotic activity (1). L-thr and L-allo-thr are diastereomers and the molecular formula is C4H9NO3, but the molecule configuration is different. The main difference between the two isomers is that the chirality of the center carbon atom C3 can be interchanged through the chiral conversion of the C3 atom (2,3). Another characteristic of the two isomers is that they can also be completely miscible to form a continuous set of co-crystallized mixtures (4,5). L-thr and L-allo-thr have the same functional groups (amino, carboxyl, and side-chain hydroxyl), and the same type of hydrogen bonds. Among them, proton donors, such as -OH and -NH2, and proton acceptors, such as oxygen and nitrogen atoms, can form not only intramolecular hydrogen bonds but also intermolecular hydrogen bonds. Therefore, the three structures of L-thr, L-allo-thr, and L-thr-L-allo-thr all have similar “framework” characteristics comprised of hydrogen bonds.
A terahertz (THz) wave refers to electromagnetic wave with frequencies in the 0.1–10 THz frequency band. The intermolecular and intramolecular interaction energies of many polar macromolecules are in tune with photons of frequencies in the THz band. For compounds with similar molecular structures and the same functional groups, their infrared (IR) spectroscopies are similar or the same, whereas THz can distinguish intermolecular hydrogen bonds, which is mainly because the IR resonance absorption originates from intramolecular vibrations. The molecular arrangement and intermolecular interactions of these compounds are different where most of the THz resonance absorption originates. Therefore, THz spectroscopy is more suitable for identifying such substances than IR spectroscopy (6,7). The 20 basic amino acids that comprise various proteins in organisms, except for glycine (the α-carbon atoms of other amino acids), are all chiral carbon atoms. Therefore, amino acids are isomers of various configurations. For various amino acids, the vibrational and torsional motions of groups of atoms, hydrogen bondings, van der Waals forces, and lattice vibrations have strong resonance absorption in the THz band, and they have their own distinct characteristic peaks, which can form a unique THz “fingerprint” spectra (8–10). For biomolecules with a large number of weak molecular interactions (such as hydrogen bonds), low-frequency vibration strongly affects their structure, conformation, and function because of the complexity of this type of vibration; the analysis of the THz spectrum lacks the corresponding molecular vibration model. Currently, solid density functional theory (DFT) simulation is considered to be an effective way to connect the predicted vibration mode and molecular structure. Simulated spectrum calculation refers to modeling with the aid of quantum mechanics calculation software to obtain a theoretical spectrum. Combined with experimental data and related visualization software, the vibration mode of absorption peaks can be identified, and the source of these absorption peaks can be explained.
In recent years, DFT has been well ap- plied to simulate the THZ spectrum of threonine molecules. In 2009, Wang and others used THz time-domain spectroscopy (THz-TDS) and Raman spectroscopy to test L-thr (11), compare THz absorption and Raman spectroscopy, and then combine them with quantum chemistry calculations to analyze threonine. In 2019, Li Wei and others studied the THz absorption spectra of three configurations of single molecule, dimer, and unit cell of L-thr samples (12) before comparing them with the calculated THz spectra of single molecule and dimer configurations. Their study determined that the calculated THz spectra of crystal cell configurations are in good agreement with the experimental spectra, indicating that the unit cell is the smallest structure that is more consistent with the sample structure and maintains the physical properties of threonine. The results showed that the use of THz spectroscopy could achieve rapid and accurate identification of L-thr and a better theoretical interpretation of its low-frequency vibration mode. Therefore, to understand how the configuration of the hydrogen bond network affects the low-frequency vibra- tions of the diastereoisomers L-thr and L-allo-thr, we further used THz spectroscopy and solid-state DFT calculations to compare their low-frequency vibration characteristics. For this study, it was helpful to comprehensively understand the diastereomer system of L-thr-L-allo-thr.
Currently, studies on binary solid solution systems formed by different amino acids roughly includes L-valine–L-iso-leucine (L-val-L-ile) (13,14), L-val-L-leucine (L-leu) (15), L-ile-L-leu and L-ala-L-ser (16), and L-thr-L-allo-thr (1,4), where the similarity of sizes and shapes of these amino acid molecules indicates that they can form solid solutions in their mixtures. However, most of them are nonequimolar discrete heterocompounds and limited solid solutions in the vicinities of pure components, whereas in the L-thr-L-allo-thr study system exists the phenomenon of the continuous isomorphic miscibility of the components, which is rarely found in chiral systems. In addition, in the synthesis or purification process of L-amino acid products, many impurities are often encountered, including pure compounds, physical mixtures, intermediate compounds, or co-crystallized mixtures. Therefore, a fast and accurate method is needed to determine whether a pure monomer or eutectic is formed (4,8,17). The THz absorption spectra is sensitive to the structural changes of diastereomers, taking L-thr and L-allo-thr as the research objects and analyzing the THz absorption of threonine and allo-threonine. The low-frequency vibration mode of them is calculated by using DFT, and the effects of intermolecular hydrogen bonds on different cell configurations and various low-frequency vibration modes in amino acid molecules are analyzed. To understand this process, it is helpful to further understand the molecular interaction of the co-crystallized mixtures L-thr-L-allo-thr.
Experimental Methods and Sample Preparation
Experimental System
This experiment used the transmission TDS system produced by Daheng Optoelectronics. The THz emission source was a light guide antenna, and the THz detector was zinc telluride (ZnTe). The center wavelength was 800 nm, the laser pulse width was 100 fs, and the repetition frequency was set at a 84 MHz pulse. The effective THz spectral range was 0.2–3.0 THz. The sample was placed in a sample chamber filled with nitrogen, and the relative humidity was less than 1%, which was measured at room temperature.
A powder X-ray diffraction (PXRD) system from ThermoARL was used in this experiment. The working voltage was 40 kV. The working current was 40 mA. The scanning range was 5–50°. The scanning speed was 0.2°/step.
IR spectroscopy was performed using a Nicolet 5700 Fourier transform IR (FT- IR) spectrometer under the conditions of a pressure of 15 MPa and a temperature of room temperature. The scanning range was 400–4000 cm-1, the number of scanning was 32 times, and the resolution was 4 cm-1.
Sample Preparation
L-thr (CAS: 72-19-5, purity >99%) and L-allo-thr (CAS: 1509-34-08, purity >98%) were purchased from Aladdin. The samples used in the experiment were not purified further. The sample and polyethylene (PE) were mixed thoroughly at a ratio of 1:5. Then, the mixture was compressed into pellets with a diameter of 13 mm and a thickness of approximately 1 mm at room temperature under a pressure of 10 MPa for 3 min.
Theoretical Method
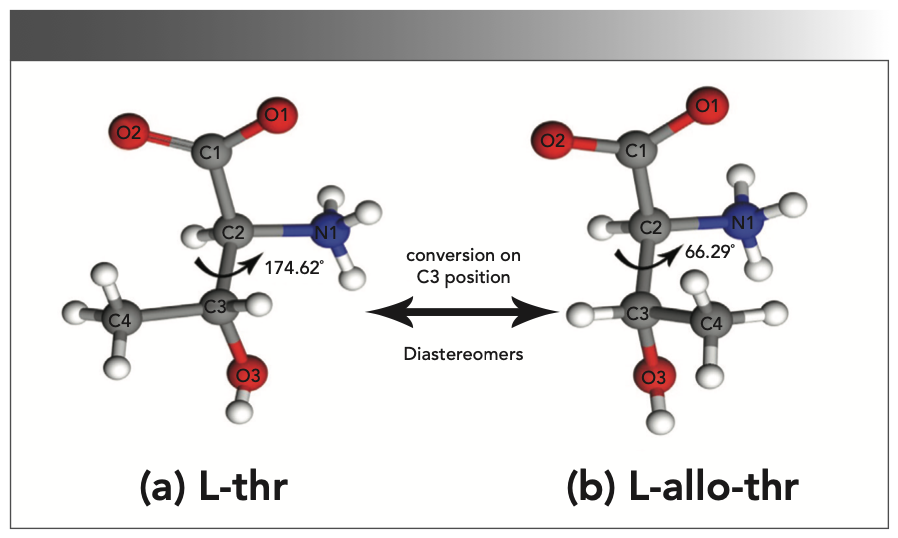
The theoretical calculations in this study were all performed using Castep-20.11 software (18). The generalized gradient approximation method (GGA) based on the plane wave was used for the calculation, and the exchange correlation functional used was the typical Perdew-Burke-Ernzerhof (PBE) functional method. The mass calculated by the energy was ultrafine, and the plane-wave cutoff energy was 750 eV. The total energy converges to 5.0 × 10⁻⁶ eV/atom, and the maximum forces between atoms were less than 0.01 eV/Å. The crystal structure data of L-thr (identifier: 128538) and L-allo-thr (identifier: 1061093) come from the Cambridge Crystallographic Data Center (CCDC). The space group of L-thr and L-allo-thr is p212121 (Z = 4), and the corresponding lattice parameters are a = 13.628 Å; b = 7.618 Å; c = 5.110 Å, α, β, γ = 90°(19,20), and a = 13.71 Å, b = 7.74 Å, c = 5.14 Å, α, β, γ = 90° (4,21), respectively. The crystal structures of L-thr and L-allo- thr are shown in Figure 1.
FIGURE 1: The molecular structure of (a) L-thr (a) and (b) L-allo-thr.
Experimental Results and Discussion
XRD Analysis of L-thr and L-allo-thr
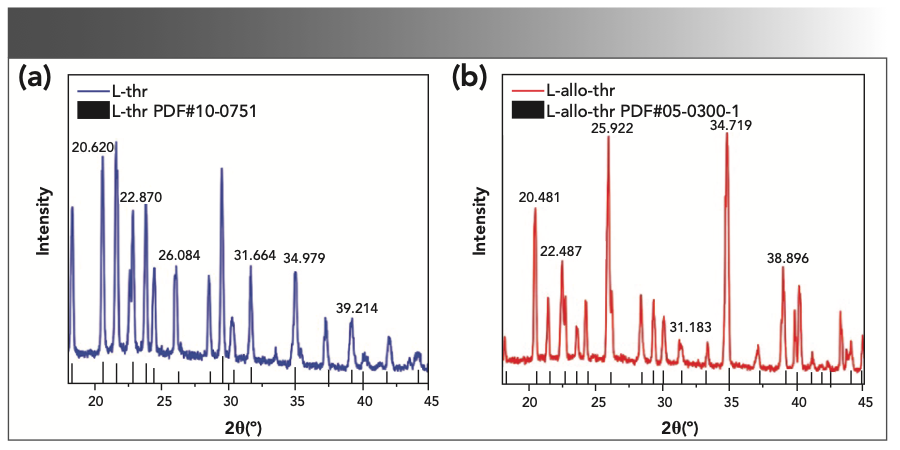
To confirm the crystal structure of the amino acid samples in this experiment, PXRD technology was used, and the results are shown in Figure 2. The measured main peak positions are in good agreement with the spectra matched by the Jade 6.0 standard PDF library (L-thr (PDF #10-0751), L-allo-thr (PDF #05-0300)). The agreement shows that the quality of the samples used in this experiment was higher. The XRD spectrum of L-thr was different from that of L-allo-thr, which was caused by the different crystal structures of the two amino acids.
FIGURE 2: XRD patterns of (a) L-thr and (b) L-allo-thr.
THz Spectral Analysis and Cell Simulation Calculation of L-thr and L-allo-thr
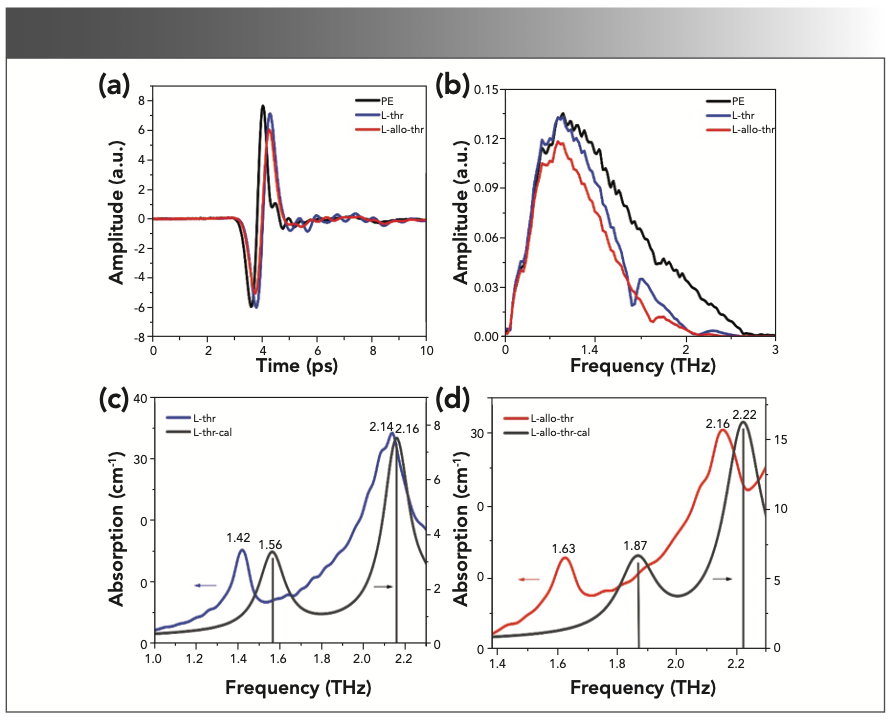
PE has almost no absorption of the THz waves and can be used as the reference. The time domain spectra and frequency domain spectra of the reference and experimental samples are shown in the Figure 3a and 3b. Compared with the pure PE signal, the THz time-domain signal of samples containing amino acids have time delay and amplitude attenuation. The time delay is mainly because the refractive index of the THz wave passing through sample is larger than the reference, and the time delay increases with the increase of sample thickness. Meanwhile, the attenuation of signal intensity is caused by the absorption and random scattering of the THz wave by the samples. Using Matlab software, fast Fourier transform was performed on the THz time-domain spectra of the samples, and the THz frequency domain spectra can be obtained. Compared with PE, the frequency domain spectra of the L-thr and L-allo-thr samples not only has corresponding amplitude attenuation, but also has several distinct and unique characteristic absorption bands.
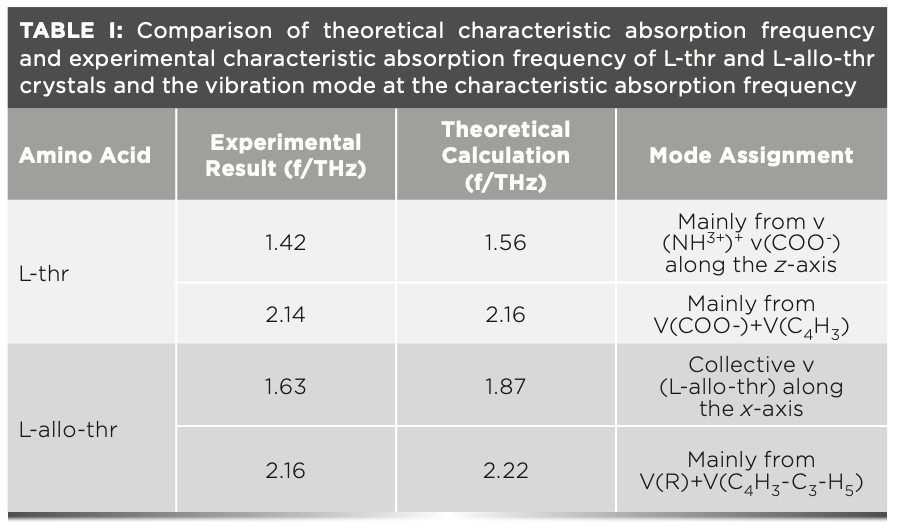
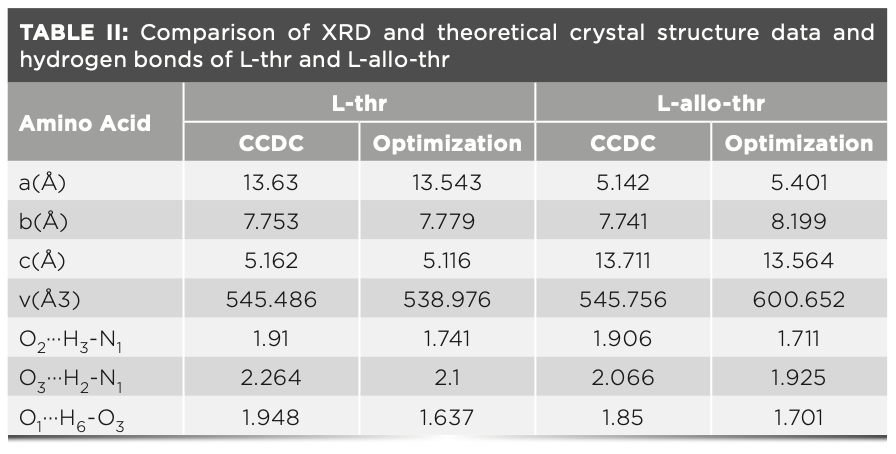
Figure 3 also shows the experimental and theoretical THz absorption spectra of L-thr (Figure 3c) and L-allo-thr (Figure 3d), respectively, with significant differences in the frequency range of 1.0–2.3 THz. The characteristic peaks of L-thr are located at 1.42 and 2.14 THz (11,12,22,23), and the characteristic peaks of L-allo-thr are located at 1.63 and 2.16 THz. It shows that L-thr and L-allo-thr can be distinguished by a THz fingerprint, which is consistent with the THz spectral results of L-thr in other literatures. Currently, there are no reports on the spectral studies of L-allo-thr. In addition, theoretical simulations can link the calculated vibration patterns to the molecular structure. The experimental and theoretical characteristic peaks of these two amino acids obtained by DFT crystal structure calculation based on GGA-PBE are listed in Table I. The theoretical characteristic peaks of L-thr are 1.56 and 2.16 THz, which corresponded to the experimental results of 1.42 and 2.14 THz. The theoretical characteristic peaks of L-allo-thr are 1.87 and 2.22 THz, corresponding to the experimental results of 1.63 and 2.16 THz. The two amino acids simulation peaks are blue shifted relative to the experimental characteristic peaks, and the largest error is that L-allo-thr is blue shifted 0.24 THz at 1.63 THz. According to the comparison of XRD data of L-thr and L-allo-thr and the optimized intermolecular hydrogen bonds in Table II, it can be seen that the intermolecular hydrogen bond lengths in their crystal cells are shortened. These shortened bond lengths further resulted in the increase of vibration frequency, the change of electron orbital density of amino acid molecules, and the internal structure reorganization. Thus, blue shift would be triggered (24,25). On the other hand, the DFT calculates the absorption frequency at the temperature of 0 K, whereas the experimental spectra are all measured at room temperature, and the difference of temperature will also cause blue shift (26–28).
FIGURE 3: (a) Time domain spectra and (b) frequency domain spectra of reference PE and amino acid samples. Experimental and theoretical THz absorption spectra of (c) L-thr and (d) L-allo-thr.
Hydrogen Bond Network Structure Analysis and Vibration Mode Attribution of L-thr and L-allo-thr
Figure 4 shows the hydrogen bond network structure in unit cell of L-thr (Figure 4a) and L-allo-thr (Figure 4b), respectively. L-thr and L-allo-thr have the same atoms and number of atoms, forming three identical hydrogen bond types, namely O2···H3-N1, O3···H2-N1 and O1···H6-O3, respectively. The threonine molecules in the crystal exist in the form of zwitterions, where two hydrogen bonds come from NH3+ and one hydrogen bond from COO- (29). Both of them are all hydrogen bond networks formed between carbonyl, carboxyl, and amino groups through O···H-N and O···H-O, connecting with neighboring molecules (7,30–32). However, L-thr and L-allo-thr are diastereomers of each other, and there are certain differences in the hydrogen bond interaction between them. Between cells, L-thr requires three threonine molecules to form a three-dimensional (3D) hydrogen bond network, whereas L-allo-thr requires four allo-threonine molecules.
FIGURE 4: The crystal structure of unit cells of (a) L-thr and (b) L-allo-thr.
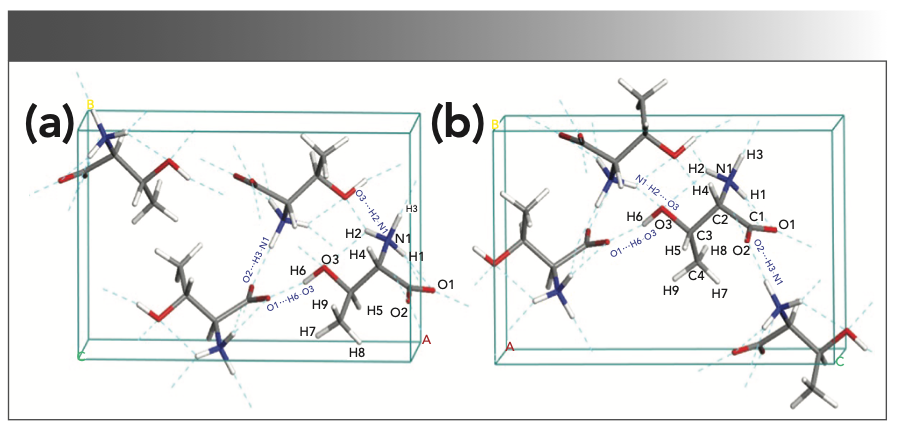
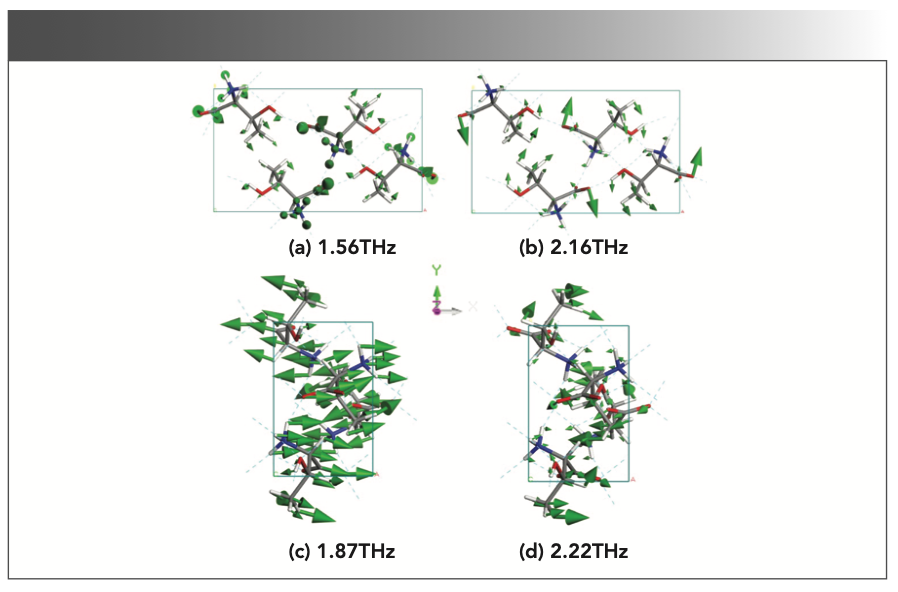
Figure 5 shows the calculated crystal structure vibration modes of L-thr at 1.56 (Figure 5a) and 2.16 (Figure 5b), and the structural modes of THz and L-allo-thr at 1.87 (Figure 5c) and 2.22 (Figure 5d) THz, respectively. A variety of vibration modes exist in the 1–2.3 THz region mainly because of the hydrogen bond interaction, leading to the specific structure in the crystal and resulting in the specific vibration behavior of different characteristic peaks in the THz frequency band (6). There are certain differences in the location of the THz characteristic peak and corresponding vibration modes between L-thr and L-allo-thr, which are mainly attributed to the deviation of their cell parameters, including the length of hydrogen bonds and the volume of the unit cell (33). It can be seen from Table I that the volume of the unit cell of L-allo-thr after optimization is much larger than that of L-thr. The reduction in the distance between the nitrogen and oxygen atoms in adjacent molecules in a unit cell leads to the enhancement of intermolecular interactions, especially the short-range force of hydrogen bonds. Small differences in the structure of molecules will cause changes in the hydrogen bond energy and bond length (7,33,34). Therefore, compared with L-allo-thr, the crystal structure of L-thr is denser, the noncovalent interaction is stronger, and the intermolecular motion is stronger. The detailed description of the calculated vibration modes of L-thr and L- allo-thr is shown in Table I. At 1.56 THz, L-thr is reflected in the swinging vibration of the amino and carboxyl groups connected with hydrogen bonds along the z-axis. The vibration mode at 2.16 THz was the carboxyl group in-plane swing vibration and the collective swing vibration of C4H3, whereas the vibration mode of L-allo-thr at 1.87 THz was mainly because of the collective swing vibration of all atoms along the x-axis. The absorption peak at 2.22 THz was the rocking vibration in the base plane of R and the collective swing vibration of C4H3-C3-H5. It can also be seen from Figure 5 that the group connected with hydrogen bond in the crystal cell vibrates significantly. Therefore, within the effective THz frequency range, the vibration mode between L-thr and L-allo-thr molecules were mainly swing vibration modes centered on intermolecular hydrogen bonds.
FIGURE 5: The vibration modes of the crystal structure calculated by L-thr at (a) 1.56 THz and (b) 2.16 THz, and L-allo-thr at (c) 1.87 THz and (d) 2.22 THz, respectively.
Qualitative and Quantitative Analysis of the Co-crystallized Mixtures of L-thr and L-allo-thr
The L-thr and L-allo-thr powders were mixed in a fixed ratio and completely dissolved in deionized water, recrystallized in a vacuum oven at 50 °C, and formed a new phase. In addition, a 1:1 physical mixed tablet of L-thr and L-allo-thr was prepared. The two solid drugs were simply mixed together and pressed into tablets. To further determine the formation of co-crystallized mixtures, we also used PXRD technology to characterize the structure of these samples. The crystal structure changes after co-crystallized can be clearly seen from Figure 6a. The diffraction patterns of L-thr and L-allo-thr in Figure 6 have similar configurations; for the physical mixtures, the diffraction patterns contain most of the diffraction peaks of the two groups of pure enantiomers. For co-crystallized mixtures, their diffraction peaks tend to be wider and not as sharp as those measured by the pure components. Moreover, the total diffraction peaks are gradually biased to the pure L-allo-thr with the increase of the L-allo-thr component. The results show that L-thr and L-allo-thr form co-crystallized structures through noncovalent bonding successfully, especially driven by strong intermolecular hydrogen bonds, whereas the mixtures do not involve such hydrogen bonds or other noncovalent interactions (35).
FIGURE 6: (a) The XRD patterns of co-crystallized mixtures and physical mixture, (b) THz spectra of L-thr, L-allo-thr and their physical mixture, (c) THz spectra of cocrystallized mixtures (L-thr, 25%, 50%, 75%, L-allo-thr), (d) the correlation between the frequency offset of the co-crystallized mixtures’ characteristic peaks (Δf, relative to the characteristic peaks at 1.42 and 2.14 THz of L-thr at zero) and the composition ratio of L-allo-thr.
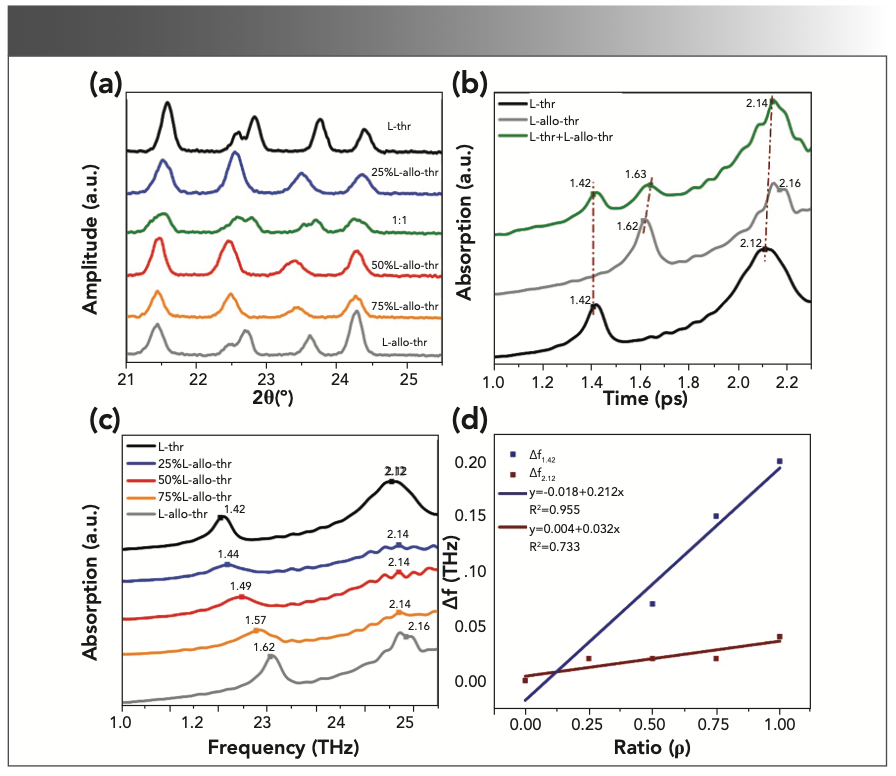
Figure 6b shows the THz absorption spectra of L-thr, L-allo-thr, and their 1:1 physical mixture. Figure 6c shows the THz absorption spectra of co-crystallized mixtures with different proportions. The THz spectra of the physical mixture has three characteristic peaks: one of the absorption peaks at 2.14 THz was relatively strong, and the other two absorption peaks at 1.42 THz and 1.63 THz were relatively weak because the spectra at 2.14 THz was affected by the common absorption of two amino acids (36). As a result, the absorbance was slightly improved. The results showed that the measured absorption peaks of the physical mixture corresponded to the experimental absorption peaks of the two pure diastereomeric components L-thr and L-allo-thr. However, the THz spectra of the eutectics contained two characteristic peaks. One of the weaker absorption peaks was located at 2.14 THz, and the other characteristic peaks of co-crystallized mixtures were respectively located at 1.44, 1.49, and 1.57 THz for 25%, 50% and 75% L-allo-thr. With the gradual increase of L-allo-thr components in co-crystal- lized mixtures, their characteristic peaks are closer to those of pure L-allo-thr (4). The significant difference here can be used for identifying co-crystallized mixtures in different proportions. The co-crystallized mixtures with different crystal structures have their own characteristic peaks, and the difference in the characteristic absorption peaks of the 1:1 physical mixture and co-crystallized mixtures was because of the THz experimental spectra caused by the collective low frequency vibration mode of the molecules (16).
In addition, Figure 6d is a linear fitting between the frequency offset of the co-crystallized mixtures characteristic peaks (Δf) and the composition ratio of L-allo-thr, which was relative to the characteristic peaks of L-thr at 1.42 and 2.14 THz. The results show a blue–red straight line, in which the fitting equation of Δf1.42 is y = -0.018 + 0.212x, R2 = 0.955 (1), and the fitting equation of Δf2.12 is y = 0.004 + 0.032x, R2 = 0.733 (2), where y represents the relative frequency offset, x represents the composition ratio of L-allo-thr, R2 is the correlation coefficient of linear fitting, where the R2 of the blue line is greater than the R2 of the red line, indicating that the fitted line between Δf1.42 and the composition ratio of L-allo-thr is in good agreement with the experimental data because with the increase of the absorption coefficient of the THz spectrum in the high-frequency region, the signal-to-noise (S/N) ratio decreases. This relationship enabled us to quickly determine the composition ratio of L-thr and L-allo-thr in co-crystallized mixtures according to the frequency offset of characteristic peaks (8,17,37,38).
Conclusion
The absorption spectra of the L-thr and L- allo-thr diastereomers were studied by THz-TDS, and the results calculated by DFT were in good agreement with the measured characteristic peaks. The cell configurations of L-thr, L-allo-thr, and the differences between various low-frequency vibration modes were analyzed from the perspective of hydrogen bond configurations. It was found that the hydrogen bond between the amino group, carboxyl group, and the side hydroxyl group between the cell molecules was the main cause of the molecular skeleton vibration. The THz spectra of the 1:1 physical mixture and co-crystallized mixtures of L-thr and L-allo-thr showed that the THz absorption characteristics of the physical mixture included the absorption characteristics of the two pure diastereomers, and the co-crystallized mixtures comprised of diastereomers in different proportions had their own distinct characteristic peaks. It was indicated that the THz-TDS technique provided a feasible method for the quantitative analysis of the co-crystallized mixtures formed by diastereomers L-thr and L-allo-thr.
References
(1) N. Taratin, H. Lorenz, D. Binev, et al, Cryst. Growth Des. 15(1), 137–144 (2015).
(2) H. Zhao, K. Hamase, A. Morikawa, et al, J. Chromatogr. B Analyt Technol. Biomed. Life Sci. 810(2), 245–250 (2004).
(3) X. Xu and Z. Lin, J. Mol. Struct.: Theochem. 962(1–3), 23–32 (2010).
(4) D. Binev, N. Taratin, E. Kotelnikova, et al., Cryst. Growth Des. 14(1), 367–373 (2014).
(5) E.N. Kotelnikova, A.I. Isakov, L.Y. Kryuchkova, and A.A. Zolotarev, in Processes and Phenomena on the Boundary between Biogenic and Abiogenic Nature (Springer, Berlin, Germany, 2020), pp. 695–719.
(6) C. Song, W.-H. Fan, L. Ding, et al, Sci. Rep. 8(1), 8964 (2018).
(7) L.-j. Huang, X. Zhang, G. Wang, et al, Spectrosc. Spect. Anal. 37(8), 2462–2466 (2017).
(8) T. Zhou, Y. Wu, J. Cao, et al, Appl. Spectrosc. 71(2), 194–202 (2017).
(9) L. Xu, Y. Li, Q. Zhou, et al., Spectrochim. Acta A. 224, 117468 (2020).
(10) Z. Wu, Z. Zhu, C. Cheng, et al., Spectrochim. Acta A. 225, 117509 (2020).
(11) W.-N. Wang, Acta Physica Sinica. 58(11), 7640–7645 (2009).
(12) W. Li, F. Yan, Z.-c. Wang, et al, Spectrosc. Spect. Anal. 40(7), 2054–2058 (2020).
(13) A.I. Isakov, E.N. Kotelnikova, S. Muenzberg, et al, Crys. Growth Des. 16(5), 2653–2661 (2016).
(14) E.N. Kotelnikova, A.I. Isakov, and H. Lorenz, Crystengcomm. 19(14), 1851–1869 (2017).
(15) A.I. Isakov, H. Lorenz, A.A. Zolotarev, Jr., et al, Crystengcomm. 22(5), 986–997 (2020).
(16) E. Kotelnikova, R. Sadovnichii, L. Kryuchkova, et al, Crystals 10(7), 618 (2020).
(17) M. Yamaguchi, F. Miyamaru, K. Yamamoto, et al, Appl. Phys. Lett. 86(5), (2005).
(18) S.J. Clark, M.D. Segall, C.J. Pickard et al, Z. Kristallogr. 220, 2567–2570 (2005).
(19) D.P. Shoemaker and B.G. Bergman, J. Am. Chem. 72(12), 5793(1950).
(20) D.Z.J. Janczak and P. Luger, Acta Crystallogr. C Cryst. Struct. Commun. C53, 1901–1904 (1997).
(21) P.S. Swaminathan, Acta Cryst. B31, 217–221 (1975).
(22) W.-N. Wang, H.-Q. Li, Y. Zhang, et al, Acta Physico-Chimica Sinica. 25(10), 2074–2079 (2009).
(23) Z.-f. Tang, H.-t. Lin, X.-w. Chen, et al, Spectrosc. Spec. Anal. 29(9), 2351–2356 (2009).
(24) Q. Cai, J. Xue, Q. Wang, et al, J. Mol. Struc. 1153, 170–178 (2018).
(25) P. Hobza and Z. Havlas, Chem. Rev. 100(11), 4253–4264 (2000).
(26) S. Zong, G. Ren, S. Li, et al, J. Mol. Struct. 1157, 486–491 (2018).
(27) J. Liang, X. Zhang, N. Wang, et al, Spectrochim. Acta A Mol. Biomol. Spectrosc. 228, 117591 (2020).
(28) Z. Zhu, G. Ren, C. Cheng, et al, Chin. J. Lasers 46(6), 0614017 (2019).
(29) M.T. Ruggiero, J. Sibik, J.A. Zeitler, et al, J. Phys. Chem. A. 120(38), 7490–7495 (2016).
(30) Y. Li, L. Xu, Q. Zhou, et al, Spectrochim. Acta A Mol. Biomol. Spectrosc. 214, 246–251 (2019).
(31) T.B. Issa, F. Sayari, H. Ghalla, et al, J. Mol. Struct. 1178, 436–449 (2019).
(32) Y. Li, L. Xu, H. Li, et al, J. Mol. Struct. 1180, 636–641 (2019).
(33) Z. Wu, Z. Zhu, C. Cheng, et al, Spectrochim. Acta A Mol. Biomol. Spectrosc. 225, 117509 (2020).
(34) M. Ge, H. Zhao, W. Wang, et al, J. Biol. Phys. 32(5), 403–412 (2006).
(35) B. Xwa, C. Yw, D. Jx, et al, Spectrochim. Acta A. 234, 118265 (2020).
(36) F. Huang, S. Zhuang, W. Liu, et al, Spectrochim. Acta A Mol. Biomol. Spectrosc. 248, 119277 (2021).
(37) Y. Du, Y. Xia, H. Zhang, et al, Spectrochim. Acta A Mol. Biomol. Spectrosc. 111, 192–195 (2013).
(38) H. Yan, W. Fan, X. Chen, et al, Spectrochim. Acta. A Mol. Biomol. Spectrosc. 258, 119825 (2021).
Ruonan Zeng, Yujing Bian, Xun Zhang, Zhenqi Zhu, and Bin Yang are with the College of Materials and Textiles at Zhejiang Sci-Tech University, in Zhejiang, China. Yang is also with the Key Laboratory of Advanced Textile Materials and Manufacturing Technology of Ministry of Education at Zhejiang Sci–Tech University, in Zhejiang, China. Direct correspondence to: yangbin5959@zstu.edu.cn ●

Geographical Traceability of Millet by Mid-Infrared Spectroscopy and Feature Extraction
February 13th 2025The study developed an effective mid-infrared spectroscopic identification model, combining principal component analysis (PCA) and support vector machine (SVM), to accurately determine the geographical origin of five types of millet with a recognition accuracy of up to 99.2% for the training set and 98.3% for the prediction set.
Authenticity Identification of Panax notoginseng by Terahertz Spectroscopy Combined with LS-SVM
In this article, it is explored whether THz-TDS combined with LS-SVM can be used to effectively identify the authenticity of Panax notoginseng, a traditional Chinese medicine.