Terahertz Technology: Moving from the Laboratory into the Process World
Guest columnists Phil Taday and colleagues look at the emerging technique of terahertz spectroscopy and its move from the lab to the process world.

The terahertz region of the electromagnetic spectrum lies between 0.06 and 3 THz, which corresponds to 2–100 cm-1 . It is a region that has been largely ignored by the pharmaceutical industry until recently due to the difficulties of undertaking measurements. These difficulties include the lack of conveniently sized sources and the use of cryogenically cooled detectors. But, recent advances in semiconductors and the availability of robust industrial femtosecond pulsed lasers have resulted in a rapid exploration of terahertz region by the pharmaceutical industry. The new semiconductor sources produce extremely short bursts of terahertz radiation, which are emitted from a point source. These bursts have a broad spectral range that is applicable to spectroscopy. The terahertz region is ideally suited to the investigation of the solid-state properties of pharmaceutical materials. Recent studies have included polymorphism (1,2), phase transitions (3,4), and hydrate forms (5,6). One of the major challenges has been assigning features observed in spectra obtained in the terahertz region; assigning of vibrational absorption bands has been difficult due to the complex intermolecular interactions in organic crystalline materials. But a number of groups have begun to attempt to interpret the spectral features observed in the terahertz region (7,8). The ability to generate terahertz radiation from a point source coupled with the fact that many pharmaceutical excipients are semitransparent in this region makes has resulted in the development of imaging systems capable of nondestructive, three-dimensional investigations of solid dosage forms. Terahertz radiation generated at a source can penetrate up to several millimeters into a sample, and whenever there is change in refractive index due to either a change in chemistry or physical (that is, layers) characteristics of the tablet, a reflection results. This reflection is a ballistic reflection that occurs from the surface of the interfaces within a pharmaceutical product and because of the finite speed of light, occurs at different times. We are able to make use of the time-of-flight capabilities of the technique to discriminate between pulses coming from different boundaries in the sample and randomly scattered photons (9,10). By measuring the differences between pulses arriving at different times, maps of the coating thicknesses of dosage form can be obtained. This can be done not only for the top surface but multiple surfaces within the products. Ho and colleagues (11) used the technique to investigate the scale-up failure between a laboratory (4-kg) scale batch and a pilot (20-kg) batch. The researchers reported significant differences in the dissolution profiles of the two batches, which they assigned to differences in the density of coatings. They also were able to develop a robust partial least squares (PLS) model to predict mean dissolution time from the raw terahertz waveform. More recently, Malaterre and colleagues (12) reported the correlation between the coating thickness on push–pull osmotic pump tablet; the thicknesses were obtained via terahertz pulsed imaging and the mean dissolution time. The authors also report the observation of internal within the coating, which correlated to an interruption to the coating process.
Until now, much of this work has been achieved with laboratory-based instruments measuring tablets at high spatial resolution. In this column, we review the progress from the laboratory into the process environment and the monitoring of coating applied to solid dosage forms in-line.
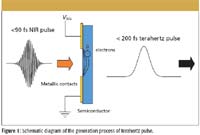
Figure 1
Generating Pulsed Terahertz Radiation
The generation of pulsed terahertz radiation in system is based upon a photoconductive switch. In this technique, a semiconductor material is illuminated by an ultrafast laser with a pulse duration less than 90 X 10-15 s and wavelength normally 800 nm. The laser pulse photo-excites electrons in the semiconductor. An electric field is applied by use of two metallic contact pads placed on either side of the illuminating laser beam, and the metallic contacts are fabricated on the front surface of the semiconductor material, as shown in Figure 1. When the electric field and the laser pulse are both present, the electrons are accelerated, resulting in the generation of an ultrashort terahertz pulse (pulse duration less than 200 fs). These pulses are inherently broadband, with the emitted power distributed over a range from 0.06 THz to 3 THz (or 2 cm-1 to 100 cm-1 ). The strength of the terahertz electric field (ETHz) is proportional dj/dt where, dj is the change in current density of the electrons in the semiconductor. The change in density mainly arises from the acceleration of electrons under the application of the external electric field.

Figure 2
Detection of terahertz radiation can be performed in a similar photoconductive system as the generation technique and also occurs at room temperature. The commonly used scheme is to optically gate a photoconductive switch with a portion of femtosecond pulse. The pulse again generates electrons in the semiconductor. An electric field is provided by the terahertz pulse, which drives photogenerated electrons to generates a dc electric current in the semiconductor. The current is measured by a lock-in amplifier, and it is directly proportional to the terahertz electric field. By changing the optical path difference between terahertz waveform pulse and the femtosecond pulse at the detector, the entire terahertz time domain can be sampled. The photogated switch is opened only for about 200 fs and thus, a very good signal-to-noise ratio can be achieved. It should be noted that we are measuring the terahertz electric field and not intensity, as is common in most other optical techniques, and because we are measuring the electric field, we are allowed to have negatively as well as positively going signals. Fast Fourier transforming the waveform results in a maximum signal height of greater than 70 dB in the frequency domain.
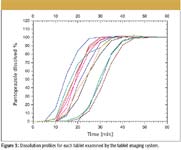
Figure 3
A Laboratory-Based Terahertz Pulsed Imaging System
A laboratory-based terahertz pulsed imaging system, the TPI Imaga 2000 tablet imaging system (TeraView, Cambridge, UK), consists of two units: a core unit and a scanning unit. The core unit consists of all the electronics, the laser, and most of the terahertz generating and detecting optics. The scanning unit consists of a six-axis robot and the terahertz focusing optics. The system currently samples a pharmaceutical product in 200-µm step sizes. The spatial resolution of the system is about 250 µm, while the axial resolution is about 38 µm. The spatial resolution is a function of the wavelength and the optics used in the system, while the axial resolution is determined by the duration of the terahertz pulse. Typically, a 7-mm tablet can be measured in about 20 min, but this depends upon the sample geometry.
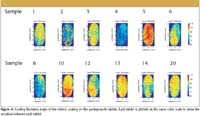
Figure 4
The Importance of Coating on Solid Dosage Forms
To illustrate the importance of coating thickness on product performance, we have studied some commercially available pantoprazole tablets (pantoprazole sodium). These tablets are used as a short-term treatment of erosive esophagitis symptoms, which are associated with gastroesophageal reflux disease. There is known to be an interaction between the pantoprazole molecule (the active ingredient) and the acidic moieties often used in the enteric polymers. To reduce the chance of an interaction, pharmaceutical companies place a thick inert layer between the controlled released coating (the enteric coating) and the tablet core. A schematic diagram of the tablet coating is shown in Figure 2. The enteric coating protects the tablet from the acid environment in the stomach and allows the tablet to be absorbed in the alkaline environment in the gut. Therefore, any imperfection in the enteric coating could result in the drug being delivered to the wrong part of the body. A total of 12 pantoprazole tablets were studied using terahertz pulsed imaging, and the coating thickness of both the inert layer and the enteric layer. After measurement by the tablet imaging system, each tablet was sent for dissolution. The dissolution profile of each tablet is shown in Figure 3. From the terahertz data, we can obtain the coating thickness of the enteric layer, shown in Figure 4. We are able to calculate the mean dissolution time from the data in Figure 3 and correlate it to average coating from enteric coating thickness and the inert layer. A correlation plot is shown in Figure 5; the linear correlation factor between the combined layer and mean dissolution time is R2 = 0.9147. The spread of the dissolution data (a spread of about 33%) highlights the requirement to control the coating process.
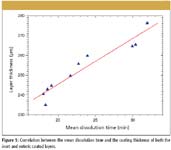
Figure 5
From the Laboratory to Production
While there is excellent correlation between the average tablet layer coating thickness and dissolution, this is only half the story; attention must be paid to both the variation in the tablet-to-tablet distribution across the batch and the coating thickness on individual tablets. To illustrate this variation, we have investigated the coating thickness of a 10-mm diameter biconvex placebo with an HPMC coating layer with samples taken at various times during a standard coating run. At each sample time we have measured 48 tablets off-line on the system. Initially, we validated the thickness measurements against the industry standard technique of percentage weight gain, demonstrating excellent correlation, as depicted in Figure 6.
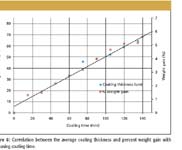
Figure 6
We then look in detail at the individual tablets in the following plots where, plotted as a histogram, we show the distribution of the average thickness of the coating for each tablet taken after 105, 120, and 135 min coating time.

Figure 7
This clearly demonstrates that while the average coating thickness can be correlated directly with weight gain the distribution of average coating thickness for individual tablets is wide. For example, tablets coated for 135 min with an average coating thickness of (approximately) 64 µm show a distribution for individual tablets between 54 and 75 µm. Note that in all cases so far, we have investigated the average coating thickness for tablets. If we extend this to now look at the variation for the coating thickness for individual tablets (measured point-to-point), the distribution widens further.
In Table I, we show data from three tablets chosen from the 135-min sample time. At the extremes of the distribution, the minimum tablet coating thickness is seen to be as low as 40 µm with the maximum thickness some 2.5 times that at 104 µm. Such a large distribution has the potential to significantly impact the dissolution time for individual tablets within a manufacturing batch. Being able to measure not only the average coating thickness of a tablet batch during manufacture but also to establish the distribution of this in real time is clearly desirable, not only from the perspective of quality control but also as a development tool.

Table I: Data from three tablets chosen from the 135-min sample time
Consequently, we have developed a system in which terahertz sensors can be placed directly within a tablet coater to take direct measurements of the increasing coating thickness on tablets during a coating run. These measurements are made on individual tablets and thus provide us with not only the coating thickness but also its distribution across tablets within the batch.
Under typical coating conditions, over 7000 measurements are taken per minute on a large sample of randomly orientated tablets. By the application of strict selection criteria, we only process those waveforms that correspond to tablets that are orientated orthogonally to the terahertz beam. These are then processed in a similar fashion to that identified earlier to extract the coating layer thickness at any given point on any given tablet. This information alone would be sufficient for an operator to stop the coating run when a sufficient thickness of coating has been deposited.
In Figure 8, we have sequentially plotted the average thickness of the tablet coating for the duration of the coating run. Points are plotted for 30 s of collected data, the measurement commencing some 135 min into the run. The average thickness is taken from a subsample measured over 30 s, where typically we measure the individual tablet coating thickness of one tablet per second, plotting the average coating thickness of this subsample sequentially during the run. This data is thus collected over a very large sample of individual tablets, in excess of 5400 tablets measured over the 90-min coating run duration. Our results show an average thickness for the coating of 63 µm at the 135-min measurement start point, increasing to 79 µm at the completion of the run after 240 min total run time. In addition to tracking the increasing coating thickness as we are measuring one tablet per second, we also are able to track the standard distribution of the coating thickness with time. For each 30-s subsample the standard deviation is typically 12. This distribution can be seen in Figure 9, where we have plotted the distribution of the individual tablet coating thickness on a sample collected over 10-min coating time.
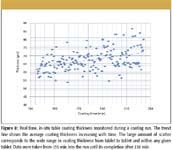
Figure 8
This demonstrates that there is a wide range of tablet coating thickness for individual tablets within the batch. In this snapshot of the coating run a range between 41 and 111 µm has been measured over a sample of 623 individual tablets. By tracking the changing distribution, additional functionality for the terahertz data can be achieved. We postulate that process conditions such as orange peeling and picking can be detected at an early stage of onset, with the potential for an operator to remedy the problem (see Figures 10 and 11).
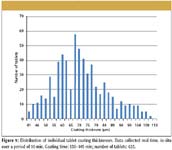
Figure 9
From a production perspective, this then lends itself to the concept of closed loop control with minimal operator intervention (no requirement to take samples for weight gain measurements) and lights-out production. Furthermore, reduced operator exposure is ideal for high-potency products. Advantages can be obtained at the formulation level, where a detailed knowledge of the distribution of the coating thickness can be used to aid process development and improvement.
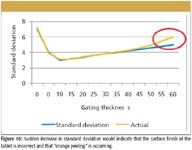
Figure 10
Conclusion
The pharmaceutical industry has been searching for many years for an in-line process-measurement tool to improve quality and reduce design cycles for coated tablets. We have demonstrated that state-of-the-art off-line measurements of physical properties of pharmaceutical tablets, and in particular, the coating thickness can be related to the dissolution properties of that tablet. This latest implementation of a terahertz sensor in-situ into a coating pan demonstrates that such measurement can be taken in-line and consequently shows great potential in achieving this desire.
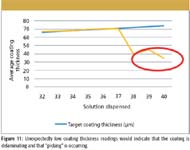
Figure 11
Acknowledgments
This work was supported by the Technology Strategy Board, Collaborative Research and Development Autumn 2007 Competition.
Philip Taday and Michael Evans are with TeraView, Cambridge, UK. Axel Zeitler is with Cambridge University, Yaochun Shen is with Liverpool University, and Dipankar Dey is with Oystar-Manesty.
References
(1) C.J. Strachan, T. Rades, D.A. Newnham, K.C. Gordon, M. Pepper, and P. F. Taday, Chem. Phys. Lett.390, 20–24 (2004).
(2) C.J. Strachan, P.F. Taday, D.A. Newnham, K.C. Gordon, J.A. Zeitler, M. Pepper, and T. Rades, J. Pharm. Sci. 94, 837–846 (2005).
(3) J.A. Zeitler, D.A. Newnham, P.F. Taday, C.J. Strachan, M. Pepper, K.C. Gordon, and T. Rades, Thermochim. Acta 436, 71–77 (2005).
(4) J.A. Zeitler, D.A. Newnham, P.F. Taday, T.L. Threlfall, R.W. Lancaster, R.W. Berg, C.J. Strachan, M. Pepper, K.C. Gordon, T. Rades, J. Pharm.Sci. 95(11), 2486–2498 (2006).
(5) J.A. Zeitler, K. Kogermann, J. Rantanen, T. Rades, P.F. Taday, M. Pepper, J. Aaltonen, and C.J. Strachan, Int. J. Pharm. 334 (1–2), 78–84 (2007).
(6) P. Upadhya, K. Nguyen, Y. Shen, J. Obradovic, , K. Fukushige, R. Griffiths, L. Gladden, A. Davies, and E. Linfield,. Spectr. Lett. 39 (3), 215–224 (2006).
(7) G.M. Day, J.A. Zeitler, W. Jones, T. Rades, and P.F. Taday, J. Phys. Chem. B 110, 447–456 (2006).
(8) D.G. Allis, D.A. Prokhorova, and T.M. Korter, J. Phys. Chem. A 110, 951–1959 (2006).
(9) A.J. Fitzgerald, B.E .Cole, and P.F. Taday, J. Pharm. Sci. 94 (1), 177–183 (2005).
(10) J.A. Zeitler, Y.C. Shen, C. Baker, P.F. Taday, M. Pepper, and T. Rades, J. Pharm. Sci.96 (2), 330–340 (2007).
(11) L. Ho, R. Müller, K.C Gordon, P. Kleinebudde, M. Pepper, T. Rades, Y. Shen, P.F. Taday, and J.A. Zeitler, J. Pharm. Sci., in press. DOI 10.1002/jps.21766
(12) V. Malaterre, M. Pedersen, J. Ogorka, R. Gurny , N. Loggia, and P.F. Taday, Eur. J. Pharmaceut. Biopharmaceut. 74 (1), 21–25 (2010).

Newsletter
Get essential updates on the latest spectroscopy technologies, regulatory standards, and best practices—subscribe today to Spectroscopy.