Time-resolved Fluorescence Spectroscopy Study of Energy Transfer Dynamics in Phycobilisome of Thermophilic Cyanobacterium Thermosynechococcus vulcanus NIES 2134
Phycobilisomes (PBSs) are the largest light-harvesting complex in cyanobacteria and red algae. To understand the energy transfer dynamics in phycobilisome, the cyanobacterium, Thermosynechococcus vulcanus NIES 2134 (T. 2134), with a phycocyanin (PC) trimer PC612 linking the rod and core, was selected. The energy transfer dynamics in PBS from T. 2134 were studied via time-resolved fluorescence spectroscopy in sub-picosecond resolution. The energy transfer pathways and transfer rates were uncovered by deconvolution of the fluorescence decay curve. A fast time-component of 10 ps from PC612 trimer to the core and a slow time-component of 80 ps from rods to the core were recognized in the energy transfer in PBSs. The faster energy transfer rate of 10 ps enables PC612 trimer to modulate the energy transfer dynamics between rods and core. The findings help us understand the structure-induced energy transfer mechanisms in PBSs.
Cyanobacteria constitute a phylogenetically coherent group of evolutionarily ancient, morphologically diverse, and ecologically important phototrophic bacteria (1). Cyanobacteria are defined by their ability to carry out photosynthesis. They synthesize PBSs as light-harvesting antenna and feature high energy transfer efficiency up to 95% (2). Curiosity-driven research has led to the discovery of the intricate structural and functional organization of PBS and its relationship with high energy transfer efficiency (3–5).
The geometrical arrangement of a PBS is elegant in an antenna-like assembly, which is comprised of phycobiliproteins (PBPs), resulting in high efficiency and rate of energy transfer. PBPs have a central core, which is made of two to five allophycocyanin (APC) cylinders and surrounded by six to eight rods (6,7). All rods contain phycocyanin (PC) and occasionally other hypochromic variants of PBPs as well. This mega-structure architecture contains additional non-pigment-binding proteins called linker proteins (LPs) (8). These LPs have a critical role in determining the directionality of excitation energy transfer (6). PBPs are assembled from two types of subunits that form the αβ monomer. The PC monomer has three phycocyanobilin (PCB) chromophores: β155; α84; and β84 (9–11), whereas APC contains only two PCBs, α84 and β84 (12–15). Monomers further assemble into trimers, hexamers, and finally into rod or core cylinders, which further assemble to form the complete PBS.
To date, researchers have proposed different mechanisms of energy transfer between PBS sub-complexes in cyanobacteria. Several ultrafast energy transfer pathways have been identified in PBS from T. 2134. Sauer and others suggested a fast 370 fs component between two different monomers of the PC trimers (16). Edington and others reported the presence of two components with excited state lifetimes of 280 fs and 1000 fs in the APC trimer (17). Zhang and others found an 18 ps component from terminal PC trimer to the APC core (18). However, the structural modulated mechanism of energy transfer in PBS had been hindered, and the energy transfer dynamics are still unclear.
In this study, thermophilic cyanobacterium T. 2134, consisting of five APC core cylinders surrounded by six PC (PC620 hexamers) rods arranged around the core with a PC (PC612 trimer) subunit (identified to date only in T. 2134) filling in the gap between rods and core (19,20), was selected to study the energy transfer within PBS. The steady state and time-resolved fluorescence spectra of PBS of T. 2134 were measured, and the sequential energy flow among PBPs in PBS was examined. The fluorescence relative decay curves of the respective transfer components were estimated by deconvolution of time-resolved spectra. The energy transfer kinetics were analyzed in detail to explore the structure-induced mechanism of energy migration within a PBS antenna system.
Materials and Methods
Growth of T. 2134 and Isolation of PBSs
T. 2134 was cultured at 22 °C in constant low light illumination (40 w-white tubes, a light cycle of 16 h, and a dark cycle of 8 h) in a Bold 1NV: Erdshreiber (1:1) medium (UTEX). Contamination was inhibited by filtering the medium with 0.22 μm paper filters and the air supply with a cotton filter. PBSs from T. 2134 were prepared, according to the methods described in our previous studies (3,4).
Determination of Steady-State and Time-Resolved Spectral Properties
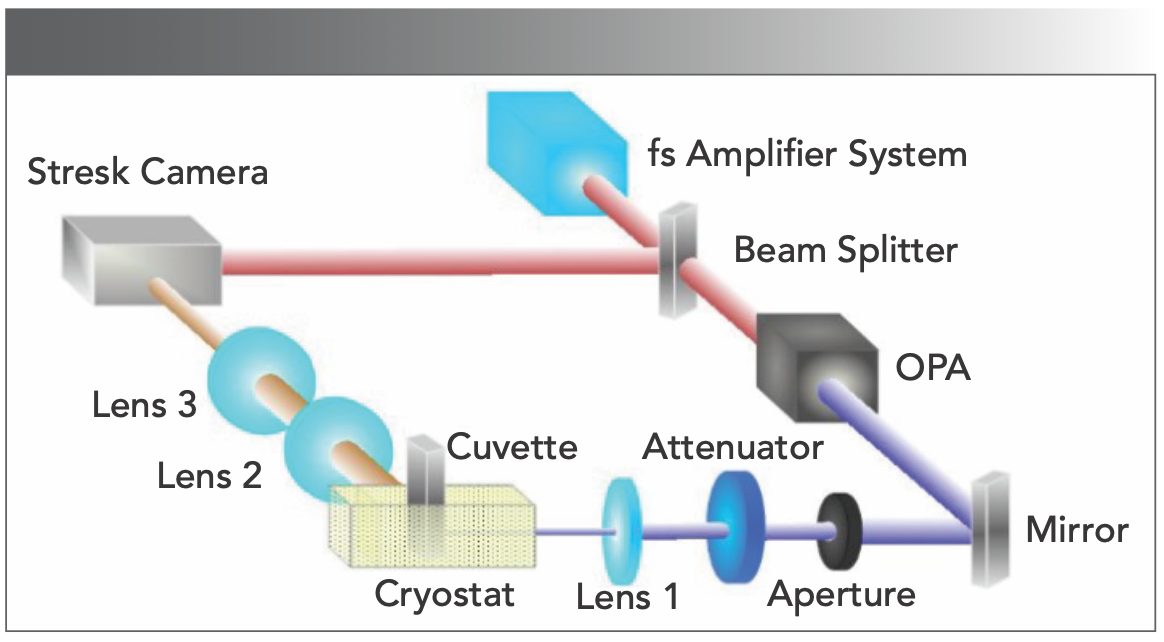
Absorption and steady-state fluorescence spectra were recorded using a spectrophotometer (Persee TU-1810c) and a spectrofluorometer (Hitachi FL- 4500), respectively. The spectral sensitivity of the fluorometer was corrected by the radiation profile of the standard lamp. Time-resolved fluorescence spectra (TRFS) were measured at 77 K by a synchroscan streak-camera (Hamamatsu C6860, time-resolution 700 fs) coupled to a polychromator, as shown in Figure 1. The silica cuvette-containing samples were placed in liquid nitrogen and were frozen in the dark. The light source was a regenerative Ti:sapphire amplifier system (Legend Elite USP HE+, Coherent), with an output pulse laser at the wavelength of 498 nm for excitation. The pulse duration was 35 fs, and the pulse repetition rate was 1 kHz. Spectral data were measured with a 0.2-nm interval and stored, and the TRFS were reconstructed afterwards.
FIGURE 1: Experimental setup for time-resolved spectroscopy measurements.
Analysis of the Time-Resolved Fluorescence Spectra
The fluorescence delay-associated spectra (FDAS) were calculated as follows: fluorescence decay curves were deconvoluted based on a global optimization method (21). After deconvolution, the time resolution was improved to approximately 2 ps. All the decays were re-analyzed using the same lifetime parameters. The amplitudes of these exponential components as a function of emission wavelength provided FDAS (22).
The fluorescence detected by the streak camera was transferred into the computer for deconvolution (23–25). The detected fluorescence intensity Fexp can be described as follows:

here, fpump represents the pump laser pulse. We considered the theoretical fluorescence intensity Ftheo as a sum of multi-exponential form:

We applied a deconvolution procedure based on a global optimization method which described as follows to fit the isotropic fluorescence (21). The variable A denotes the amplitude of the fluorescence isotropic decay constant of τi.

Results
Steady-State Spectroscopy Results
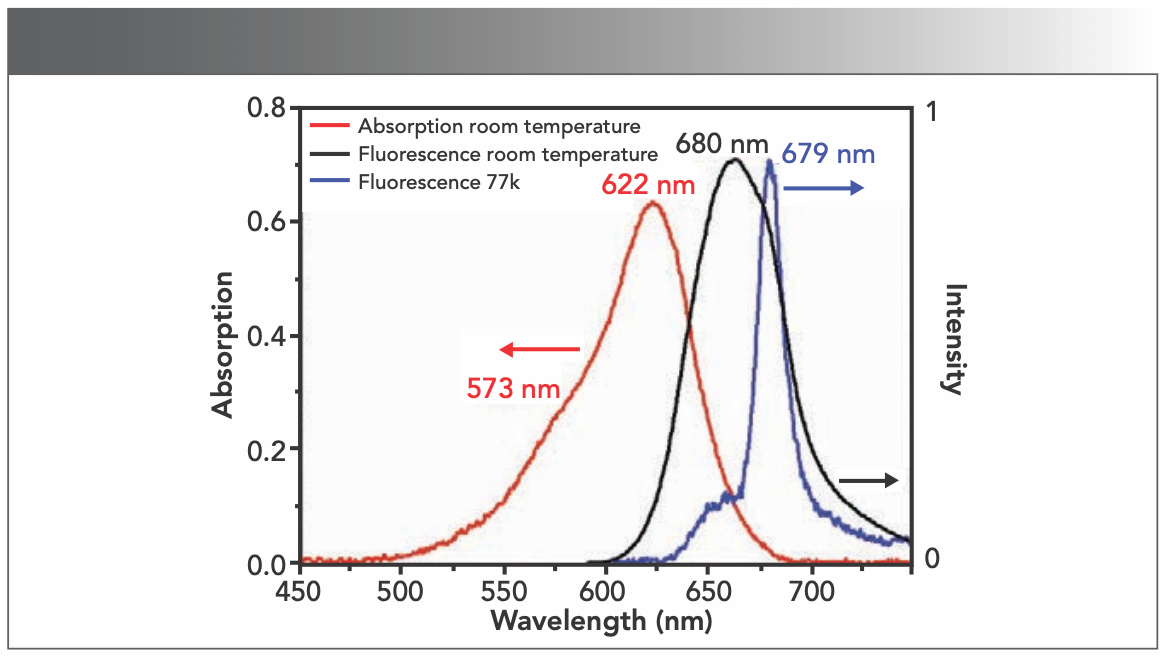
The steady-state spectra of the PBS from T. 2134 were measured at room temperature and 77 K, respectively. The results obtained are displayed in Figure 2. The absorption spectrum of PBS from T. 2134 at room temperature exhibited a peak at 622 nm and a shoulder at 573 nm, with a large half-width because of the absorption of the PCB chromophores. The fluorescence spectra of PBS from T. 2134 were obtained with an excitation at 570 nm. The maximum fluorescence peak at room temperature was at 660 nm. Although the fluorescence spectrum at 77 K is much narrower compared to that at room temperature, it exhibited a peak at 679 nm with a shoulder approximately at 653 nm, which is because of the low temperature at 77 K that leads to the phycobiliprotein conforming again, resulting in the change of the electronic state of chromophoric group (26). This conformational change has a significant effect on the spectral properties of the chromophore, which may increase the rigidity of the chromophore in the PBS and the quantum yield of fluorescence.
FIGURE 2: The steady-state spectra of PBS from T. 2134. (Red line) Absorption spectra of T. vulcanus PBS at room temperature. (Black line) Normalized fluorescence spectra of PBS from T. 2134 at room temperature with excitation at 570 nm. (Blue line) Normalized fluorescence spectra of PBS from T. 2134 at 77K with excitation at 570 nm.
Conclusions
With picosecond time-resolved spectroscopy and the application of deconvolution techniques, we have studied the energy transfer paths, energy transfer time constants, and energy transfer dynamics in a complete PBS of thermophilic cyanobacterium T. 2134. The results indicate that the energy transfer time constant between PC612 trimer and APC core is approximately 10 ps. The energy transfer time constant between PC620 rods to APC core is approximately 80 ps. The flexible PC612 trimer connects the end of the PC rod and the circumference of APC core cylinders, acts as the energy transfer bridge in the rod-core structural antenna system. The PC612 trimer exhibits a fast energy transfer route to the core and modulates the energy transfer dynamics between the rods and the core.
The large and complex structure complicated the energy transfer in PBSs and PBPs. In theory, energy transfer takes place among different chromophores, and more than half of the energy transfer with a time constant of less than 1 ps greatly hindered the direct observation in available methods. With the development of ultrafast techniques, the future research on the physical mechanism of the energy transfer in the initial photosynthesis process can go deep into the energy localization kinetics in its coherence condition of the excited state, which may bring us a more accurate understanding of the energy transfer dynamics in the photosynthesis antenna systems.
Time-Resolved Spectroscopy Results
Fluorescence spectra in the steady state are combinations of emissions from fluorescence components. The energy transfer among the spectra are described on the base of their kinetics. Thus, the time-resolved fluorescence spectra of PBS from T. 2134 were analyzed in detail. The time-resolved fluorescence spectrum was conducted at 77 K, at which the molecular vibration effect and solvent effect that affect the precise reflection of energy transfer process could be neglected, allowing large signal-to-noise (S/N) ratios to guarantee that the time-resolved fluorescence spectrum is close to the necessary assumption of the energy transfer in theoretical models (27).
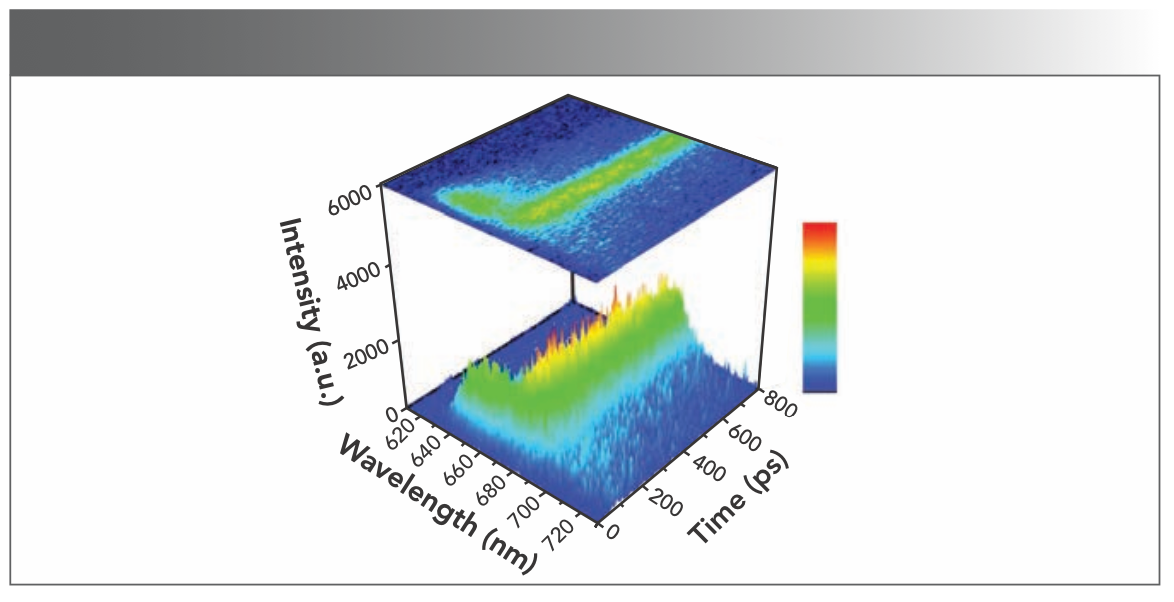
Figure 3 shows the reconstructed three-dimensional (3D) time-resolved fluorescence spectra of PBS from T. 2134 at 77 K, represented in color gradation. The time-resolved fluorescence spectra show the changes of spectra with time. As the different wavelengths of fluorescence spectra correspond to the different chromophores emissions in PBS, we can get the emission information of chromophores fluorescence in different positions of PBS with time. The expression helps us to understand the energy flow conceptually. With an excitation at 570 nm when it excites the chromophore in the PCB, the time-resolved fluorescence spectrum of PBS showed initially a spike of the PC fluorescence band at approximately 640–660 nm, and then with the APC core emission band from 680 nm to 690 nm that rose concomitantly with the decay of the PC emission. Changes in the relative intensities of fluorescence components directly show the energy transfer from PC rod to APC core in PBS.
FIGURE 3: Time-resolved fluorescence spectra of PBS T. 2134 from at 77 K, with excitation at 570 nm. Fluorescence intensity is expressed as a gradation shown in the right side of the figure, and blue indicates a low intensity while red indicates a high intensity.
The changes in fluorescence spectrum were much more clearly observed, as shown in Figure 4. The fluorescence components in the time-resolved spectra were resolved by deconvolution of spectra attributing intensity changes to certain component bands. Gaussian band shape was assumed to be a function of wavenumber. To obtain the best fit, four components were used for simulation, and each spectrum was reasonably fitted only by changes in the relative intensities. The band around 645 nm (green line) is from PC612 emission, the band around 660 nm (blue line) is from PC620 emission, the band around 680 nm (pink line) is from the APC core emission, and the band longer than 700 nm (orange line) might originate from vibrational band of PC rod.
FIGURE 4: (a–h) Deconvolution pattern of time-resolved fluorescence spectra. In each subfigure, black solid line represents the fluorescence spectra data; green, blue, fuscia, and orange lines represent the component bands; the red line represents the sum of component bands. Numbers in the upper righthand corner of each subfigure show the time in picoseconds after the excitation pulse.
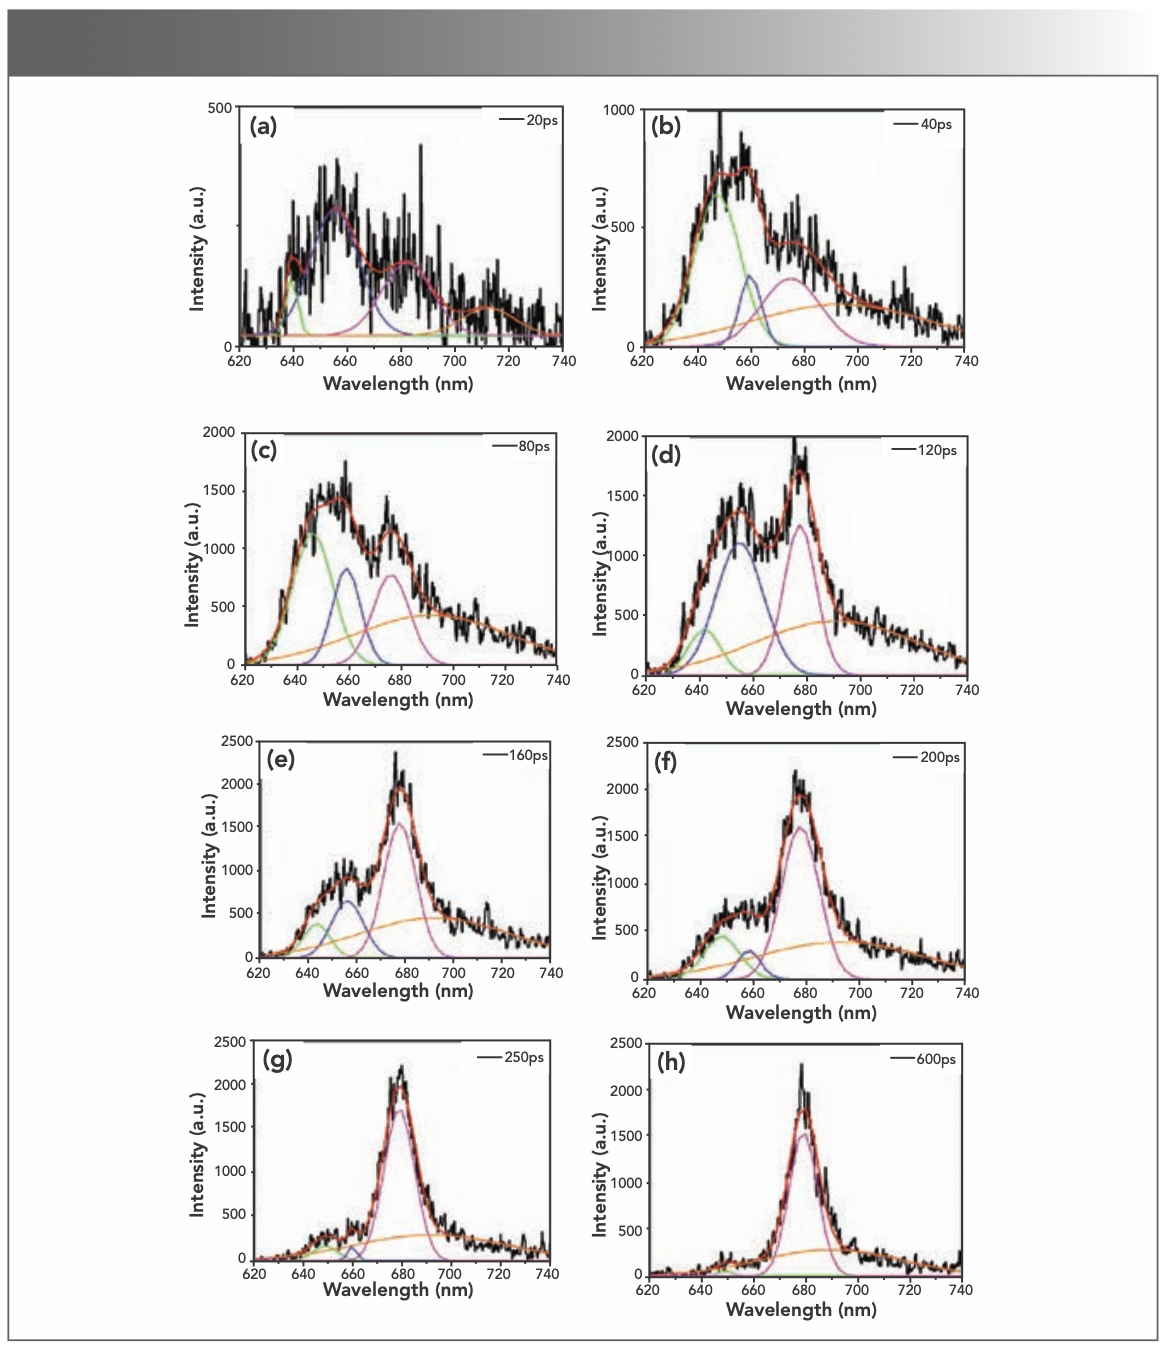
The energy transfer dynamics in PBS can be analyzed in detail through the changes of relative intensity of fluorescence components. The intensity of the PC620 band gave rise to take dominate at 20 ps (Figure 4a), owing to the outermost location of PC620 hexamers in PBS. At the same time, the PC612 and APC emission were evident with its lower intensity, which indicated that the energy was converted to the core within 20 ps. After 40 ps, the intensity of the PC612 emission band quickly increased and became high (Figure 4b). It is obvious that the PC612 trimer is the energy acceptor from PC620 rods and the energy donor to APC core. After 80 ps, the intensity of PC612, PC620, and APC simultaneously increased (Figure 4c). After 120 ps, the PC612 emission decreased, and the decay of PC612 emission corresponded to the rises of PC620 and APC emission (Figure 4d). At this stage, the energy transfer from PC rods to PC612 was saturated because the number of PC612 trimers is much fewer than that of PC620 hexamers, resulting in the growth of PC620 and APC emissions. After 160 ps, the APC core emission continues rising with PC620 emission decay quickly (Figure 4e). The intensity of the PC620 emission kept decreasing and became relatively low when compared to APC emission (Figure 4f), which means most of the rod energy was transferred to the core. Both the PC620 and PC612 emissions kept decreasing after 200 ps (Figure 4g) and almost disappeared after 250 ps (Figure 4h). The energy transfer process in the PBSs is a dynamics process. The absorbed solar light can be transferred from the rods to the core, finally reaching the reaction center. Meanwhile, the rods and the core can also emit fluorescence when the chromophores in the rods and core obtain the energy. Thus, in the energy transfer process, part of the solar energy was transferred to the reaction center, and the rest was used for fluorescence emission via the chromophores. Although we cannot directly observe the energy transfer pathways in the PBSs, we can get the information of dynamic fluorescence emission in different positions of the PBSs by measuring the time-resolved fluorescence spectroscopy, which can help us reveal the energy transfer pathways and the related transfer rate. According to the time-resolved spectroscopy of T. 2134, we can see the revolution and competition of the fluorescence peaks, and the energy can be transferred to the core within 20 ps.
Fluorescence Decay-Associated Spectra
To determine the constants of fluorescence decay in PBS, deconvolution was conducted in a global optimization method. The time-resolved fluorescence decay at different detected wavelengths was resolved by multiexponential deconvolution, and the Monte-Carlo method was adopted to process the experimental data, as shown in Figure S1.
FIGURE S1: The fluorescence intensity decay curves of PBS from T. 2134.
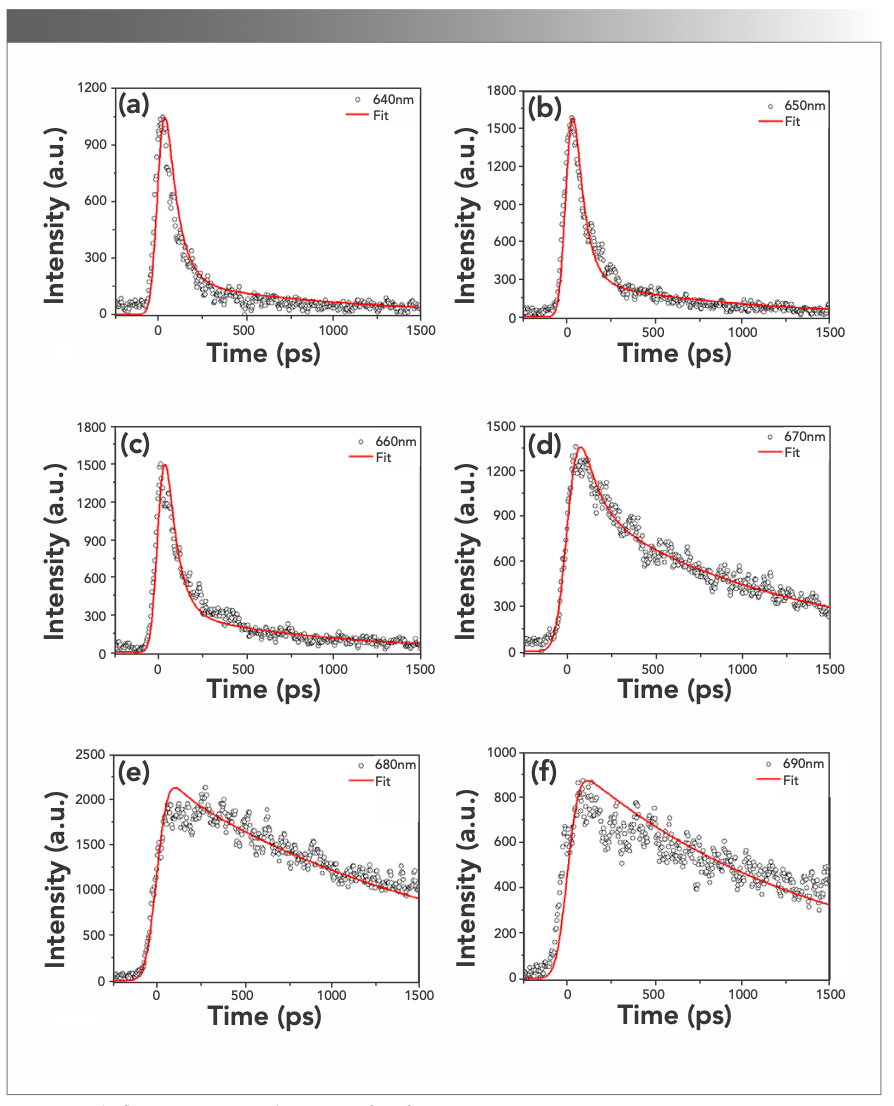
The fluorescence decay of PBS from T. 2134 was well-fitted with three exponentials of 10, 80, and 1250 ps, and the amplitudes of each time component are listed in Table I. All the time constant, except for the longest one of the terminal fluorescent emission, can be considered as a function of the time constant of energy transfer. The component (A%) with a negative amplitude corresponds to the uprising stage of fluorescence, indicative of an energy acceptor, and the component with a positive pre-exponential corresponds to the downturn stage of fluorescence, indicative of an energy donor.
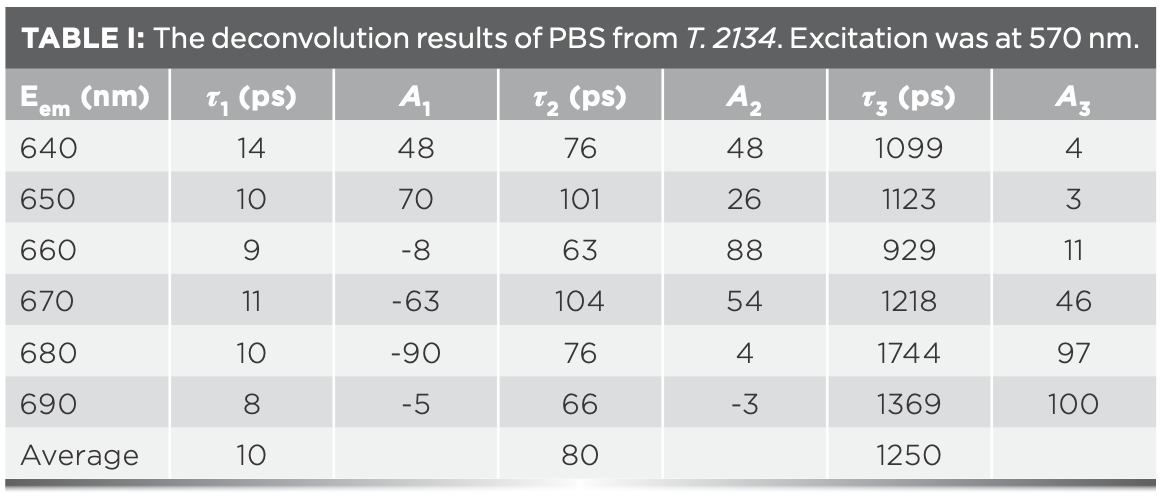
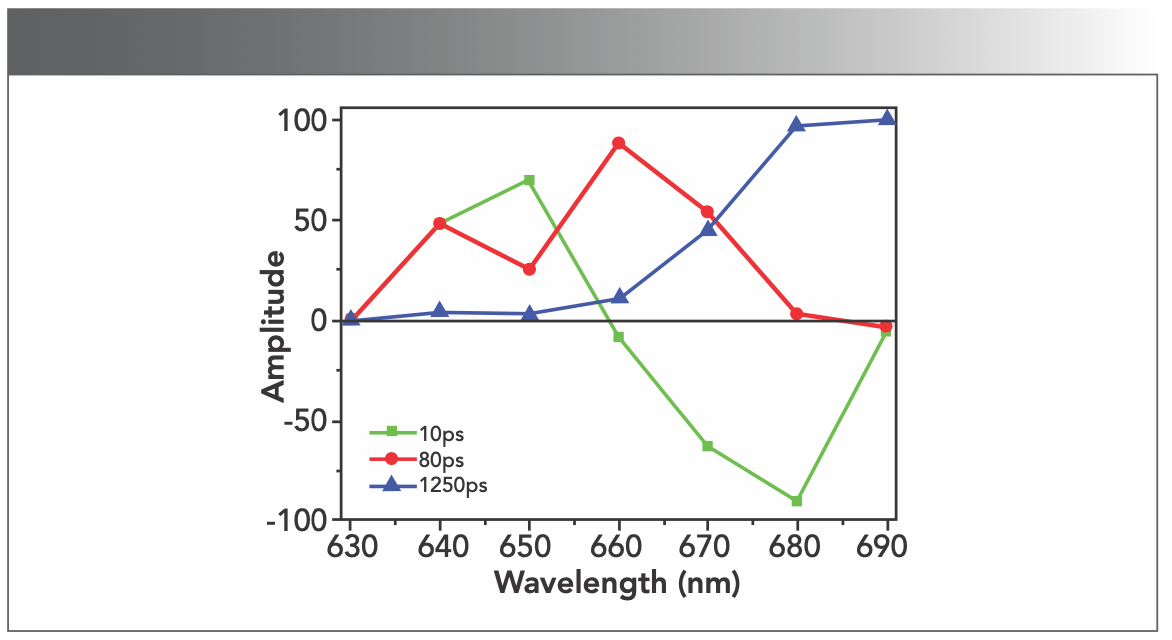
Based on the results of the deconvolution, we obtained the FDAS. The FDAS can reveal the energy transfer dynamics among PBPs in PBSs. In FDAS, the negative and positive factors indicate the kinetic increase and decrease in the populations in the excited state, respectively. The coupling of negative and positive bands was a clear indication of energy transfer from the pigments showing the positive band to those showing the negative band. Figure 5 shows the FDAS from PBS from T. 2134. According to the FDAS results, these decay constants may be assigned as follows: (1) The fluorescence decay constant of 10 ps is because of the energy transfer time from PC612 to APC core, because its amplitude, shown in Figure 5, is positive in the blue side with a maximum around 650 nm and negative at the red side with a minimum around 680 nm. The negative amplitude represents the fluorescence rise term and indicates that energy transfer occurs from a donor to an acceptor. Therefore, from the fluorescence spectra of the PC612 and APC core, it is reasonable to assign decay time of 10 ps to the energy transfer time between PC612 and APC core (2). The fluorescence decay constant of 80 ps is because of the energy transfer time from PC rod to the APC core. because its amplitude, shown in Figure 5, is positive at the red side with a maximum around 660 nm, then quickly decrease and became negative at 690 nm. Holzwarth and others (28) also found the same energy transfer pathway with time of 80–120 ps from PC rod to APC, which is confirmed by our experiment and the analyses (3). The fluorescence decay constant of 1250 ps reflects the fluorescence emission of the APC core.
FIGURE 5: The FDAS of PBS from T. 2134.
Supplementary Materials
Figure S1 shows the fluorescence intensity decay curves of PBS from T. 2134.
Author Contributions
Conceptualization was done by Mingyuan Xie and Wenjun Li. The methodology was created by Mingyuan Xie and Zhanghe Zhen. The investigation was performed by Mingyuan Xie. The original draft was prepared by Mingyuan Xie. The review of the article was done by Fuli Zhao. Supervision was done by Song Qin and Fuli Zhao. All authors have read and agreed to the published version of the manuscript.
Funding
This research was funded by the National Natural Science Foundation of China, (grant number 11274397, 41176144, 41376139, and 41906109) and the Science and Technology Planning Project of Guangdong Province (grant number 2016B090918099).
Acknowledgments
The authors would like to thank the staff at the school of physics, Sun Yat-sen University, for their technical support on femtosecond laser system and streak camera performances.
Conflicts of Interest
The authors declare no conflict of interest.
References
(1) F. Garcia-Pichel, in Cyanobacteria. Encyclopedia of Microbiology, 3rd ed. (Moselio Schaechter, San Diego, 2009), pp. 107–124.
(2) A.N. Glazer, Annu. Rev. Biophys. Biophys. Chem. 14, 47–77 (1985).
(3) J. Zhang, J.F. Ma, D.S. Liu, S. Qin, S. Sun, J.D. Zhao, and S.F. Sui, Nature 551, 57–63 (2017).
(4) J.F. Ma, X. You, S. Sun, X.X. Wang, S. Qin, and S.F. Sui, Nature 579, 146–151 (2020).
(5) W.J. Li, Y. Pu, Z.H. Tang, F.L. Zhao, M.Y. Xie, and S. Qin, Chin. J. Phy. 66, 24–35 (2020).
(6) N. Adir, Photosynth. Res. 85, 15–32 (2005).
(7) E. Gantt, Annu. Rev. Plant Physiol. 32, 327–347 (1981).
(8) L. David, A. Marx, and N. Adir, J. Mol. Biol. 405, 201–213 (2011).
(9) T. Schirmer, W. Bode, R. Huber, W. Sidler, and H. Zuber, J. Mol. Biol. 184, 257–277 (1985).
(10) D.S. Berns and R. MacColl, Chem. Rev. 89, 807–825 (1989).
(11) N. Adir, Y. Dobrovetsky, and N. Lerner, J. Mol. Biol. 313, 71–81 (2001).
(12) K. Brejc, R. Ficner, R. Huber, and S. Steinbacher, J. Mol. Biol. 249, 424–440 (1995).
(13) L. Ying and X. Xie, J. Phys. Chem. B 102, 10399–10409 (1998).
(14) A. McGregor, M. Klartag, L. David, and N. Adir, J. Mol. Biol. 384, 406–421 (2008).
(15) Q. Wang and W.E. Moerner, Proc. Natl. Acad. Sci. 112, 13880–13885 (2015).
(16) K. Sauer and H. Scheer, Biochim. Biophys. Acta. Bioenerg. 936, 157–170 (1988).
(17) M.D. Edington, R.E. Riter, and W.F. Beck, J. Phys. Chem. 99, 15699–15704 (1995).
(18) J.M. Zhang, J.Q. Zhao, L.J. Jiang, X.G. Zheng, F.L. Zhao, and H.Z. Wang, Biochim. Biophys. Acta. Bioener. 1320, 285–296 (1997).
(19) L. David, M. Prado, A.A. Arteni, D.A. Elmlund, R.E. Blankenship, and N. Adir, Biochim. Biophys. Acta. Bioener. 1837, 385–395 (2014).
(20) N. Adir, M. Dines, M. Klartag, and A. McGregor, Microbiol. Monogr. 2, 47–77 (2006).
(21) H.Z. Wang, J.Q. Zhao, and L.J. Jiang, China Ser. B-Chem. 43, 233–239 (2000).
(22) F.L. Zhao, X.G. Zheng, J.M. Zhang, H.Z. Wang, Z. Yu, J.Q. Zhao and L.J. Jiang, J. Photochem. Photobiol. B 45, 144–149 (1998).
(23) A. Sandstrom, T. Gillbro, U. Sandstrom, R. Fischer, H.Ž . Scheer, Biochim. Biophys. Acta 933, 54–64 (1988).
(24) J.M. Zhang, F.L. Zhao, X.G. Zheng, and H.Z. Wang, Chem. Phys. Lett. 304, 357–364 (1999).
(25) J.M. Zhang, J.Q. Zhao, L.J. Jiang, X.G. Zheng, F.L. Zhao and H.Z. Wang, Biochim. Biophys. Acta. Bioener. 1320, 285–296 (1997).
(26) A.D. Xia, X. Zhang, Q. Hong, J. Meng, S. Hou, M. Sudha, P.S. Maruthi and I.B. Jha, Sci. China. Ser. C 35, 811–821 (1992).
(27) F.L. Zhao, J.M. Zhang, X.G. Zheng, and H.Z. Wang, Acta Scientiarum Naturalium Universitatis Sunyatseni 37, 18–23 (1998).
(28) A.R. Holzwarth, J. Wendler, and G.W. Suter, Biophys. J. 51, 1–12 (1987).
Mingyuan Xie is with the School of Physics at the State Key Laboratory of Optoelectronic Materials and Technologies at Sun Yat-sen University, in Guangzhou, China, and the Shenzhen Institute of Advanced Science Facilities in Shenzhen, China. Zhanghe Zhen is with the Yantai Institute of Coastal Zone Research at the Chinese Academy of Sciences, in Yantai, China, and the University of Chinese Academy of Sciences, in Beijing, China. Song Qin and Wenjun Li is with the Yantai Institute of Coastal Zone Research at the Chinese Academy of Sciences, in Yantai, China, and the Center for Ocean Mega-Science at the Chinese Academy of Sciences, in Qingdao, China. Fuli Zhao is with the School of Physics at the State Key Laboratory of Optoelectronic Materials and Technologies at Sun Yat-sen University, in Guangzhou, China. Direct correspondence to: xiemy5@mail.sysu.edu.cn●

New Study Reveals Insights into Phenol’s Behavior in Ice
April 16th 2025A new study published in Spectrochimica Acta Part A by Dominik Heger and colleagues at Masaryk University reveals that phenol's photophysical properties change significantly when frozen, potentially enabling its breakdown by sunlight in icy environments.
Tracking Molecular Transport in Chromatographic Particles with Single-Molecule Fluorescence Imaging
May 18th 2012An interview with Justin Cooper, winner of a 2011 FACSS Innovation Award. Part of a new podcast series presented in collaboration with the Federation of Analytical Chemistry and Spectroscopy Societies (FACSS), in connection with SciX 2012 ? the Great Scientific Exchange, the North American conference (39th Annual) of FACSS.
New Fluorescence Model Enhances Aflatoxin Detection in Vegetable Oils
March 12th 2025A research team from Nanjing University of Finance and Economics has developed a new analytical model using fluorescence spectroscopy and neural networks to improve the detection of aflatoxin B1 (AFB1) in vegetable oils. The model effectively restores AFB1’s intrinsic fluorescence by accounting for absorption and scattering interferences from oil matrices, enhancing the accuracy and efficiency for food safety testing.
Can Fluorescence Spectroscopy Evaluate Soil Dissolved Organic Matter Dynamics?
February 20th 2025A new study published in Chemical Engineering Journal by researchers from Northeast Agricultural University in China reveals that biochar aging, influenced by environmental factors like UV exposure and wet-dry cycles, alters dissolved organic matter composition and affects its effectiveness in remediating cadmium-contaminated soil.
Geographical Traceability of Millet by Mid-Infrared Spectroscopy and Feature Extraction
February 13th 2025The study developed an effective mid-infrared spectroscopic identification model, combining principal component analysis (PCA) and support vector machine (SVM), to accurately determine the geographical origin of five types of millet with a recognition accuracy of up to 99.2% for the training set and 98.3% for the prediction set.