Tracking Bioactive Compounds Produced by Genetically Engineered Yeast Cells Using Raman Imaging
In this study, several strains of yeast cells, both wild-type (WT) and engineered, were analyzed by Raman imaging microscopy. Two biologically active compounds produced within the engineered yeast cells were readily identified by their characteristic Raman spectral peaks. The locales and the relative abundance of those biologically active compounds were visualized from the Raman microscopic images of the individual cells. Raman imaging microscopy further reveals the differences in efficiencies with which the biologically active compounds were produced by different yeast cell strains.
In recent years, bioengineering of yeast cells has made them a “biological cell factory” for producing a range of chemicals, including biologically active compounds through fermentation processes. This “biological cell factory” can efficiently convert starch, sucrose, or lignocellulose-based raw materials into precursor metabolites, which can further be converted into the products of interest (1). Bulk chemical analyses, such as gas chromatography–mass spectrometry (GC–MS) and nuclear magnetic resonance (NMR), can be used for screening fermentation cultures, assessing product yield, and delivering process optimization. These methods, however, are destructive, time-consuming, and insufficient, because they fail to provide specificity at the cellular level (2). Fluorescence microscopy-based imaging is capable of visualizing large or small molecules at the cellular level, but the success of this approach largely hinges on the photostability and brightness of fluorescent labels, their possible perturbations to the biological system, and the methods by which the labels are attached (3). Confocal Raman microscopy-based imaging has emerged as a great alternative (3,4). Raman spectroscopy provides chemical annotations to the constituents within the cell, and the high spatial resolution intrinsic to confocal microscopy provides cellular level information. In contrast to the fluorescence microscopy-based imaging approach, Raman imaging is nondestructive and requires minimal sample preparation.
In this study, wild-type (WT) and several strains of engineered yeast cells were analyzed by Raman imaging. Two biologically active compounds produced within the engineered yeast strains were readily identified. Furthermore, it was revealed that different strains produced the two compounds with different efficiencies. Raman images of the individual cells show the locales as well as the relative abundance of those compounds. The information extracted provides valuable information that helps optimize the fermentation process.
Materials and Methods
Sample Preparation
A 2 μL sample of the WT and each engineered yeast cell strain sample was transferred to an aluminum-coated, 12-positions slide, and then it was air dried prior to the Raman imaging experiments. The two biologically active reference compounds are denoted as “compound 1” and “compound 2”, respectively. Compound 1 is a terpene and compound 2 is a sterol. For the two reference compounds in solid powder form, a small amount of each was transferred to a glass slide, and the Raman spectra were collected.
Raman Spectroscopy and Raman Imaging
The Raman spectra and the Raman area images (for an area containing one or two cells within each sample) were acquired using a Thermo Scientific DXR3xi Raman Imaging Microscope. The key experimental parameters for Raman imaging are listed below:
- Laser: 532 nm
- Laser power at the sample: 2 mW
- Microscope objective: 100x
- Aperture: 25 μm confocal pinhole
- Exposure time: 0.01 second
- Number of scans: 30–40
- Pixel size: 0.2 μm
Raman images were obtained by the correlation profiling option of the OM-NICxi software, using a representative Raman spectrum from within a cell as the reference. The correlation profile shows the correlation between the spectrum at each pixel (sampling point) in the Raman image and the specified reference spectrum. Each color in the rainbow-colored intensity scale represents a degree of correlation with the reference spectrum. The higher the intensity value, the greater similarity to the reference spectrum.
Results
Figure 1 shows the representative Raman spectra of the two biologically active compounds, compound 1 (pink trace, top) and compound 2 (red trace, bottom). Both compounds have prominent features in the C-H stretching region (~2900 cm-1) and C=C stretching region (~1600 cm-1). The two strong peaks attributed to the C=C stretch- ing vibrations are located at 1667 cm-1 and at 1605 cm-1, respectively, for compound 1 and compound 2. The downshift of the C=C stretching peak in compound 2 (1605 cm-1) is because of a ring structure. There are no strong interfering Raman peaks from the cellular matrices in this frequency range. Hence, these peaks are chosen as the Raman markers to distinguish the two biologically active compounds in the yeast cell samples by Raman imaging.
FIGURE 1: Raman spectra of the pure biologically active compounds, (a) compound 1, and (b) compound 2. These two compounds can be clearly distinguished by the presence of strong C=C peaks at 1667 cm-1 and 1605 cm-1, respectively.
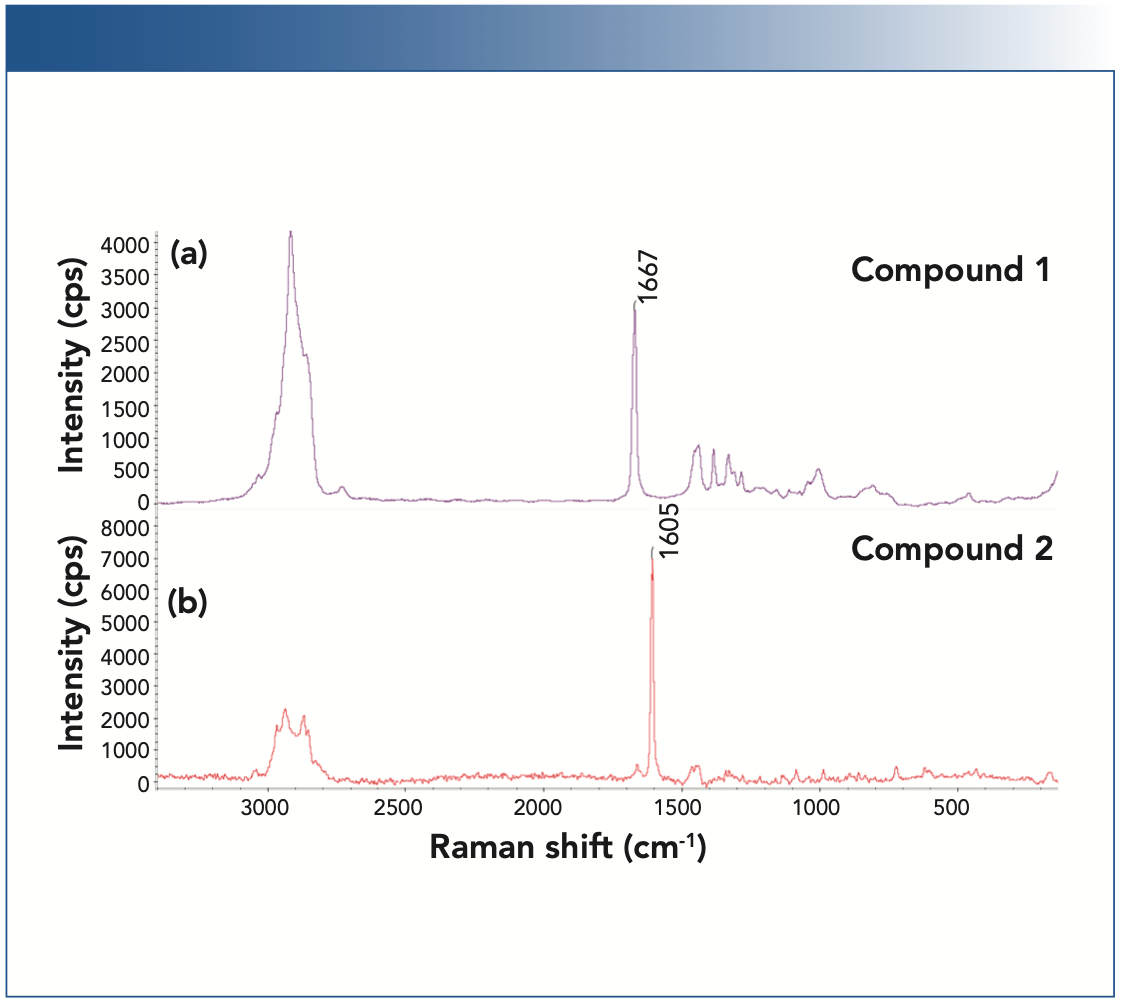
Figure 2 shows the Raman image of a WT yeast cell (Figure 2a), the representative Raman spectra from the different locations of the imaged region (Figure 2b), and the representative Raman spectra of compound 1 and compound 2. As can be seen in Figure 2a, the cells (in red) can be spectroscopically differentiated from the surrounding media (in blue), with a clearly delineated contour in green color. As expected, the cells are devoid of either compound 1 or compound 2 (Figure 2c). Raman image of the strain B yeast cells is shown in Figure 3. Both compound 1 and compound 2 are produced in the cell, as evidenced by Figures 3b and 3c. Interestingly, for the same strain B, there are cell-to-cell variations in the level of produced compounds. Based on the relative peak intensities, the cell in the upper- left corner appears to produce more compound 1 than compound 2, whereas the cell in the center produces similar amounts of compound 1 and compound 2.
FIGURE 2: Raman image of a wild-type (WT) yeast cell. (a) Raman image of a selected region for the WT yeast cells. The Raman image was generated by correlation profiling. (b) Raman spectra from the spots S-1 and S-2 on the Raman image. (c) Raman spectra of S-1 and S-2, as well as compounds 1 and 2 displayed in the 1540–1750 cm-1 region. The Raman spectra for the cells were normalized with respect to the C-H stretching peaks near 3000 cm-1.
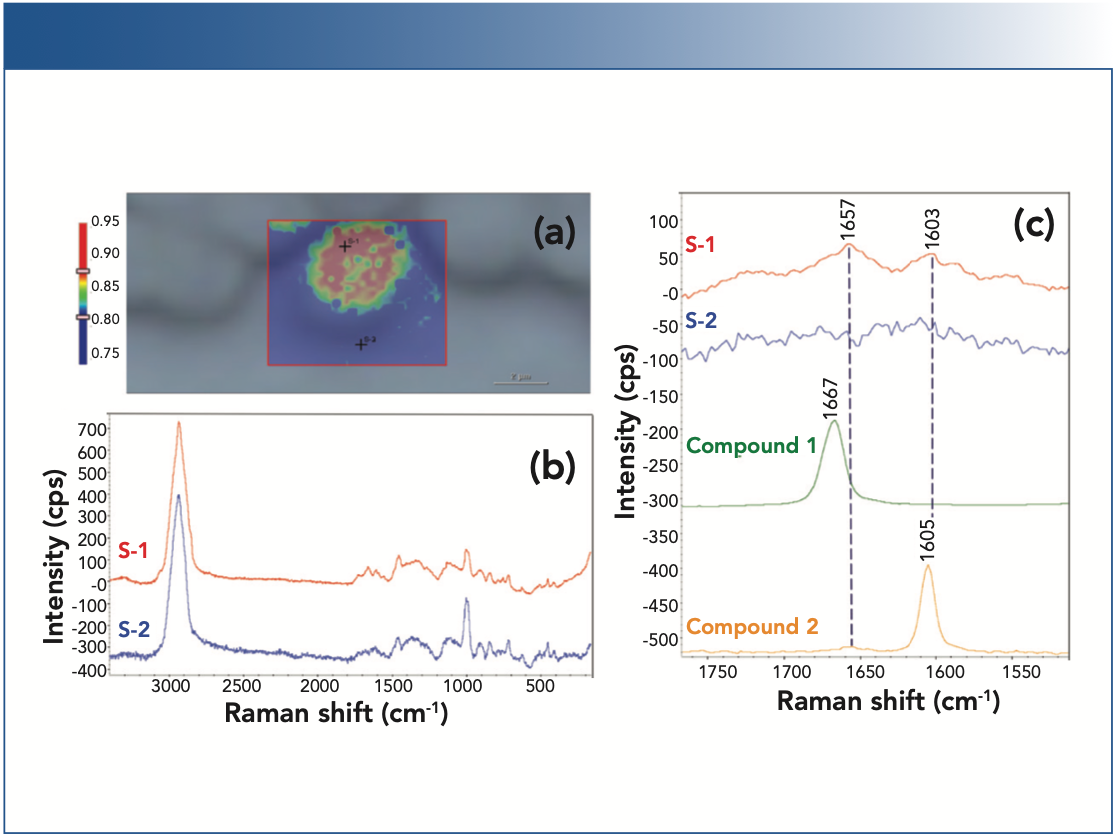
FIGURE 3: Raman image of the strain B yeast cells. (a) Raman image of a selected region for the strain B yeast cells. The Raman image was generated by correlation profiling. (b) Raman spectra from the spots S-1, S-2 and S-3 on the Raman image. (c) Raman spectra of S-1, S-2 and S-3, as well as compounds 1 and 2 displayed in the 1540–1750 cm-1 region. The Raman spectra for the cells are normalized with respect to the C-H stretching peaks near 3000 cm-1.
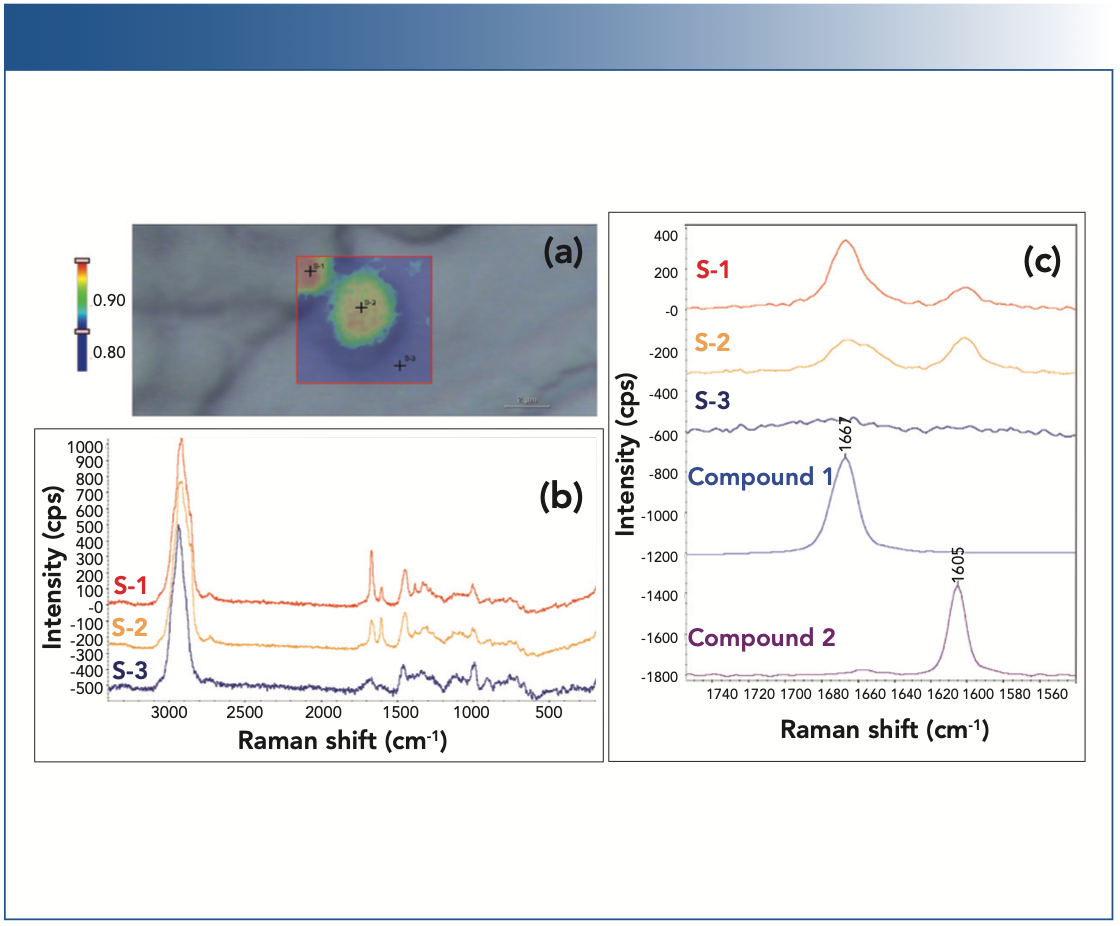
Figure 4 summarizes the Raman imaging analyses of the three different strains of yeast cells—strain A, strain C, and strain D—in terms of their yield in producing compound 1 and compound 2. At a quick glance, strain A appears to be a low producer of compound 1 and does not produce compound 2. Strains C and D, on the other hand, appear to produce both compound 1 and compound 2, but strain D has a higher yield for compound 1 than for compound 2.
FIGURE 4: Raman images of three different strains of yeast cells. (Top row) Raman images from the selected regions for the three different strains: strain A, strain C, and strain D. The Raman images were generated using correlation profiling. (Bottom row) Raman spectra (1540–1750 cm-1 region) from the spots on the top corresponding Raman images. The Raman spectra are normalized with respect to the C-H stretching peaks near 3000 cm-1.
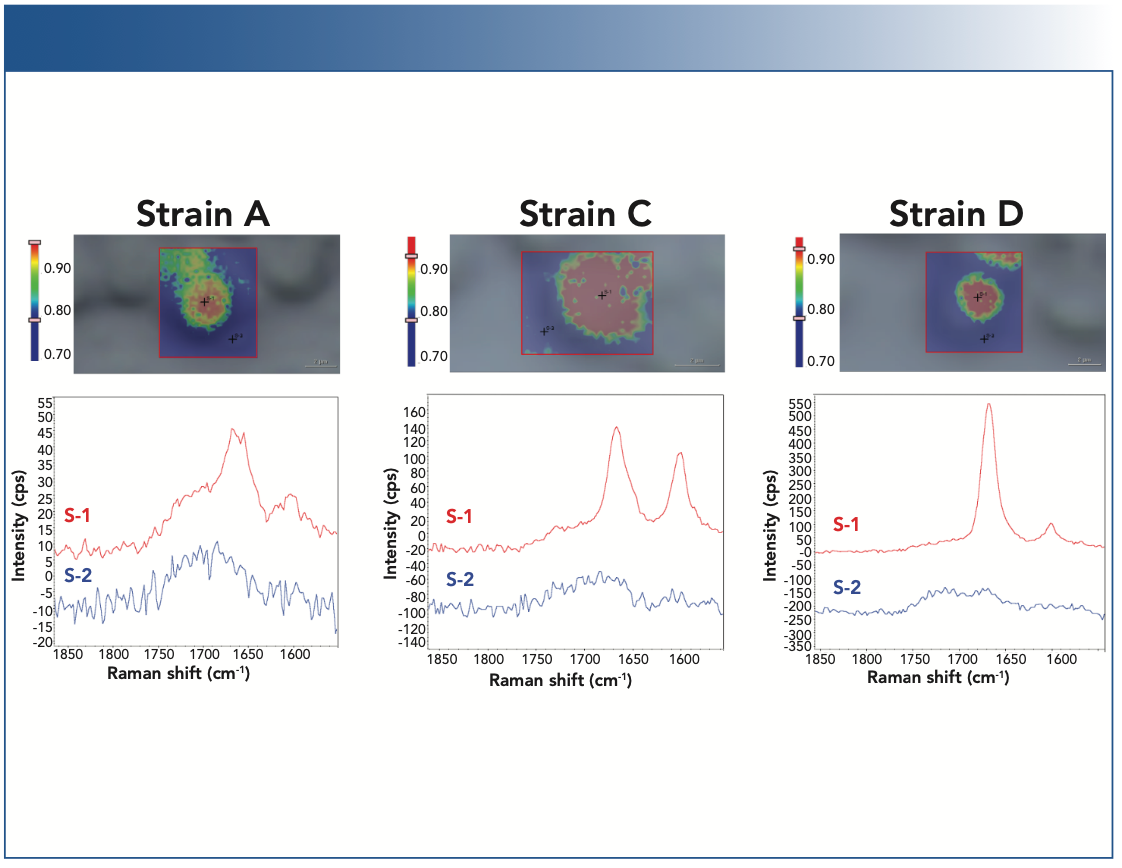
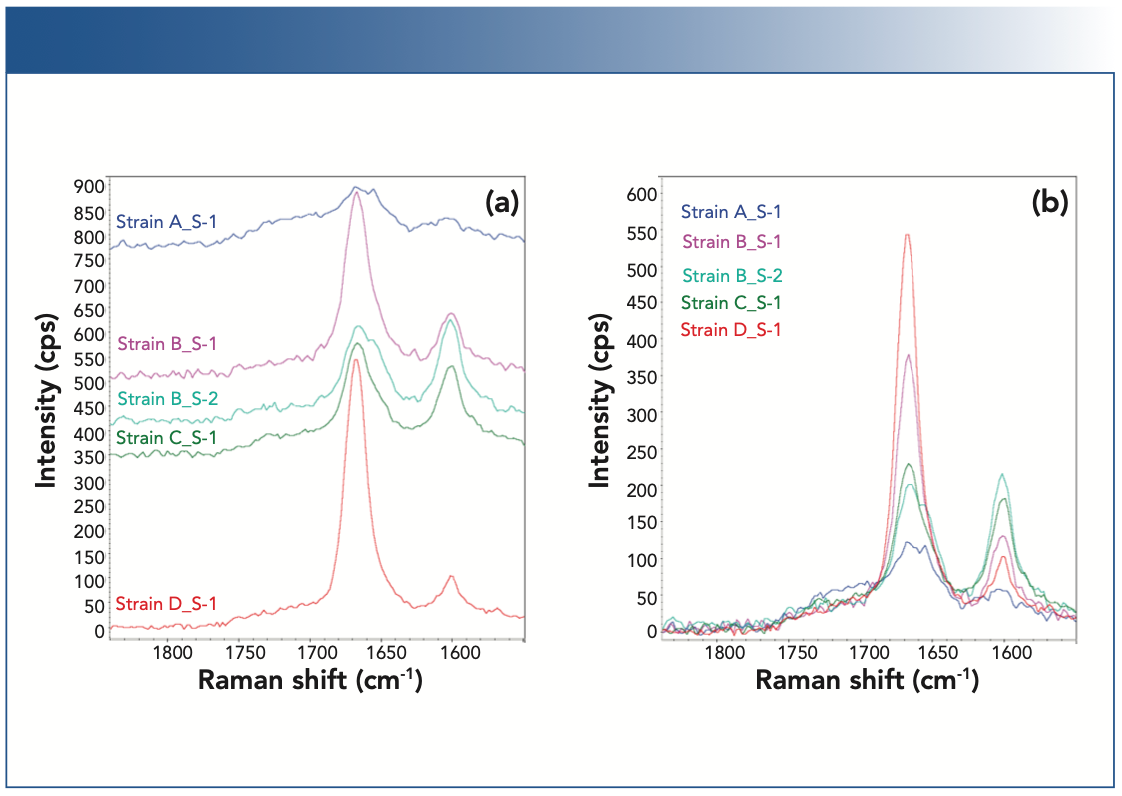
Figure 5 summarizes the yield with which compound 1 and compound 2 are produced by the four different engineered strains of yeast cells (strains A–D). Strain A (blue) appears to be a low producer of compound 1 and does not produce compound 2. Strains B, C, and D all produce both compound 1 and compound 2. Strain B displays nonuniform levels of produced compounds from cell-to-cell, some cells (pink) producing higher level of compound 1 than the others (cyan). Strain C (green) seems to produce higher level of compound 2, and strain D (red) has the highest yield for compound 1. Caution should be exercised when assessing the product yields from the Raman peak intensity. A more rigorous, quantitative analysis requires the respective Raman cross sections for the compounds 1 and 2 be properly accounted for.
FIGURE 5: Raman spectra of the strains A–D of the yeast cells. (a) Raman spectra (1540–1750 cm-1 region) from the cells of the strains A–D, shown in the offset mode, and (b) in the overlayed mode. The Raman spectra are normalized with respect to the C-H stretching peaks near 3000 cm-1.
Conclusion
In this study, Raman imaging was successfully applied to analyze different strains of yeast cells, both WT and engineered. The target bioactive compounds produced by the engineered yeast cells can be readily identified and differentiated by their respective Raman spectra, allowing for assessment of the product yields of different yeast strains by Raman imaging. Raman images of the individual cells from the four engineered yeast cell strains indicate that these strains produce compounds 1 and 2 with different efficiencies. Raman imaging can also be used to estimate the relative yield of the bioactive compounds. A quantitative analysis of product yield, however, requires a more systematic study on the Raman cross-sections of those compounds. The information obtained from the Raman imaging will be beneficial for a deeper understanding of the fermentation process and for optimization of the process for higher product yield.
Acknowledgments
The authors would like to acknowledge Dr. Michael Leavell and his colleagues at Amyris for providing the samples and many insightful discussions.
References
(1) Y. Chen, L. Daviet, M. Schalk, V. Siewers, and J. Nielsen, Metab. Eng. 15, 48–54 (2013).
(2) R. Miyaoka, M. Hosokawa, M. Ando, T. Mori, H.O. Hamaguchi, and H. Takeyama, Mar. Drugs 12, 2827–2839 (2014).
(3) Y. Shen, F. Hu, and W. Min, Annu. Rev. Biophys. 48, 347–369 (2019).
(4) L. Mikoliunaite, R.D. Rodriguez, E. Sheremet, V. Kolchuzhin, J. Mehner, A. Ramanavicius, and D.R.T. Zahn, Sci. Rep. 5, 13150 (2015).
Mohammed Ibrahim and Rui Chen are with Thermo Fisher Scientific in Madison, Wisconsin. Nosa Agbonkonkon was formerly a scientist with Amyris in Emeryville, California, when this work was being conducted. Direct correspondence to: mohammed.ibrahim@thermofisher.com
AI-Powered SERS Spectroscopy Breakthrough Boosts Safety of Medicinal Food Products
April 16th 2025A new deep learning-enhanced spectroscopic platform—SERSome—developed by researchers in China and Finland, identifies medicinal and edible homologs (MEHs) with 98% accuracy. This innovation could revolutionize safety and quality control in the growing MEH market.
New Raman Spectroscopy Method Enhances Real-Time Monitoring Across Fermentation Processes
April 15th 2025Researchers at Delft University of Technology have developed a novel method using single compound spectra to enhance the transferability and accuracy of Raman spectroscopy models for real-time fermentation monitoring.
Nanometer-Scale Studies Using Tip Enhanced Raman Spectroscopy
February 8th 2013Volker Deckert, the winner of the 2013 Charles Mann Award, is advancing the use of tip enhanced Raman spectroscopy (TERS) to push the lateral resolution of vibrational spectroscopy well below the Abbe limit, to achieve single-molecule sensitivity. Because the tip can be moved with sub-nanometer precision, structural information with unmatched spatial resolution can be achieved without the need of specific labels.
