Understanding the Layers of a Laboratory Data Integrity Model
Data integrity is currently the hottest topic in regulated laboratories. Understanding what constitutes data integrity and the interactions between the layers is the challenge to ensure that data are accurate, correct and complete. Are you up to the challenge?
Data integrity is currently the hottest topic in regulated good practice (GxP) laboratories. What constitutes data integrity is presented as a four-layered data integrity model. Understanding the composition and interactions between the layers is imperative to ensure that data are accurate, correct, and complete. Are you up to the challenge?
When it comes to data integrity, the focus tends to be on the lurid tales of daring don’ts that you can read on-line from the United States Food and Drug Administration (FDA) warning letters (1) or the more gentile regulatory findings from European regulators (2), Health Canada Inspection Tracker (3), and the World Health Organization (WHO) (4). The focus is usually on data manipulation or data falsification-for example, altering a sample weight, enhancing standard peaks via manual integration, or simply copying and pasting spectra from a passing batch to a failing one. However, the main cause of data integrity citations is laboratories being lazy or stupid-for example, by failing to verify calculations, losing data, relying on paper printouts rather than the source electronic records as raw data, or failing to back up electronic records on standalone workstations.
However, this focus fails to understand what a holistic approach to data integrity within an organization should consist of. To explain what data integrity is, I developed a four-layer data integrity model to help spectroscopists and analytical scientists understand the extent, scope, and depth of the subject. The aim of this column is to outline the four layers that constitute data integrity within a regulated laboratory. In part, this column expands the data quality triangle that can be seen in United States Pharmacopeia (USP) General Chapter <1058> “Analytical Instrument Qualification” (5), but the data quality triangle only tells part of the data integrity story.
Data Integrity Is More than Just Numbers
In a regulated analytical laboratory, data integrity is not just how a sample is analyzed, the acquired data are interpreted, and a reportable result or results are obtained, although readers could draw that conclusion when reading FDA warning letters. It is important to realize that there are further underlying areas within the laboratory and corporation that must be under control, or the work performed in analysis can be wasted and data integrity compromised in spite of the best efforts of analytical staff.
A Laboratory Data Integrity Model
Although there are guidance documents on the subject of data integrity issued by the UK’s Medicines and Healthcare Products Regulatory Agency (MHRA) (6) and WHO (7), they lack a rigorous holistic structure for a regulated laboratory to fully understand and implement. Typically, these guidance documents do not have figures to explain concepts in simple terms of what regulators want or where there are; these documents are poorly presented and explained (6). Instead the poor reader has to hack through a jungle of words to figure out what is needed-this being the analytical equivalent of an Indiana Jones movie. As the WHO guidance on data integrity shows, the subject is not just numbers, but a subject that involves management leadership, involvement of all the staff in an organization, culture, procedures, and training, among others. However, these guides do not, in my view, go far enough nor are they sufficiently well organized to present the subject in a logical manner.
It is important to understand that laboratory data integrity must be thought of in the context of analysis of samples within an analytical process that is operating under the auspices of a pharmaceutical quality system (8,9). Data integrity does not exist in a vacuum. In formalizing a holistic approach to data integrity within an analytical context, I have chosen to look at four layers consisting of a foundation and three analytical layers above it in a data integrity model.
My interpretation of this model is shown in Figure 1 and consists of four layers that must be present to ensure data integrity within an organization and a laboratory in particular. The layers are as follows:
- Foundation: Right corporate culture and ethos for data integrity
- Level 1: Right instrument or system for the job
- Level 2: Right analytical procedure for the job
- Level 3: Right analysis for the right reportable result
Each layer feeds into the one above it. Similar to building a house, if the foundation is not right, the layers above it will be suspect and liable to collapse, often despite the best efforts of the staff who want to do a good job. The rest of this column explores each layer of the data integrity model in turn beginning with the foundation.
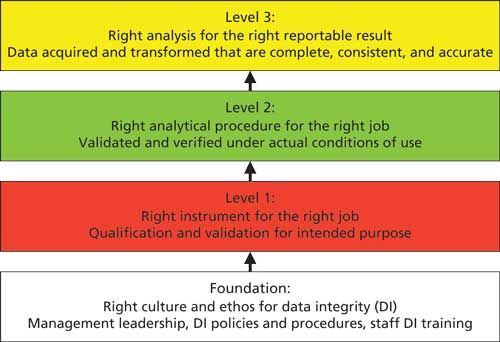
Figure 1: The four layers of the data integrity model for laboratories within a pharmaceutical quality system.
The Model Exists within a Pharmaceutical Quality System
As shown in Figure 1, the data integrity model does not exist in a vacuum, but within an existing pharmaceutical quality system (PQS). This is important as the Medicines and Healthcare Products Regulatory Agency (MHRA) note in their guidance that the data governance system should be integral to the pharmaceutical quality system as described in European Union Good Manufacturing Practice (EU GMP) chapter 1 (9). For US companies, the equivalent situation is described in the FDA guidance for industry on pharmaceutical quality systems (8).
Extending the Data Integrity Model
The data integrity model can also be extended to other areas within a regulated pharmaceutical company, such as production, by modifying the three layers above the foundation. For example, you can replace the analytical instruments and computerized systems in level 1 with manufacturing equipment and systems, production process validation and recipes in level 2, and finally the records produced for each batch of product manufactured in level 3. Thus, with a common foundation the three layers in the data integrity model can be tailored to any situation within a regulated good practice (GxP) organization-even clinical research!
Foundation: Right Corporate Culture and Ethos
The foundation of this data integrity model is the engagement and involvement of executive and senior management within any organization. This foundation ensures that data integrity and data governance is set firmly in place within the context of a pharmaceutical quality system. Therefore, there must be management leadership, corporate data integrity policies that cascade down to laboratory data integrity procedures, and staff who have initial and on-going data integrity training. We discussed data integrity training in a recent “Focus on Quality” column (10).
Engagement of executive and senior management in ensuring that data integrity is in place is essential. The PQS guidance from the FDA and EU GMP chapter 1 (8,9) make it crystal clear that executive management is responsible for quality within an organization and that includes data integrity. Just to ensure regulatory completeness, guess to whom the FDA address their warning letters? Yes, you’ve guessed correctly-the chief executive officer (CEO). Why mess around with the monkey? Give the organ grinder the regulatory grief!
However, both the MHRA (6) and WHO (7) guidance documents talk blithely about the need for data governance, but fail to mention any substantial guidance about how to implement it other than the need for data owners. Two guidance documents that fail to offer guidance? Hmmm. It is a good thing that the WHO guidance is in draft so they have a chance to update the document and expand this section. As for the MHRA document, who knows? We will discuss data governance in more detail in the next “Focus on Quality” column.
Level 1: Right Instrument and System for the Job
There is little point in carrying out an analysis if the analytical instrument is not adequately qualified or the software that controls it or processes the data is not validated. Therefore, at level 1, the analytical instruments and computerized systems used in the laboratory must be qualified for the specified operating range and validated for their intended purpose, respectively. The USP general chapter <1058> (5) and the Good Automated Manufacturing Practice (GAMP) “Good Practice Guide for Validation of Laboratory Computerized Systems” (11) provide guidance on these two interrelated subjects.
In Spectroscopy’s sister publication LCGC Europe, I recently discussed that we need to conduct computerized system validation in a different way (12). Typically, we conduct the project in a top-down manner, looking at the process, improving it, and then configuring the software application to that process as shown in Figure 2. However, this approach has the flaw that the records acquired and interpreted by the software may not be adequately protected, especially if the records are held in directories in the operating system.
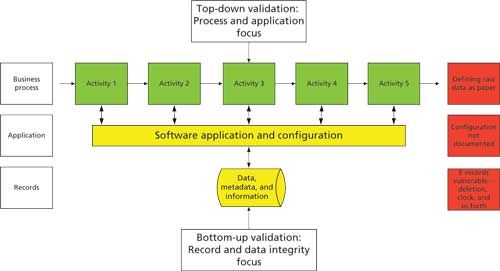
Figure 2: A new approach to computerized system validation.
Therefore, we need to change the way that we conduct our computerized system validation. In addition to the top-down approach, we need to identify the records created during the course of an analysis and determine if they are vulnerable within the data life cycle. By implementing suitable controls to transfer, mitigate, or eliminate the records, these files can be adequately protected. For more information on this approach, please read the original article (12).
Failure to ensure that an analytical instrument is adequately qualified or that a computerized system is adequately validated means that all of the work in the two levels of the data integrity model above is wasted because the quality and integrity of the reportable results are compromised.
Level 2: Right Analytical Procedure for the Job
Using qualified analytical instruments with validated software, the analytical procedure is developed and validated. There are several published references for this from the International Conference on Harmonization (ICH) Q2(R1) (13) and respective chapters in the European Pharmacopoeia (EP) and USP. However, the focus of these publications is on validation of an analytical procedure already developed. Method development, which is far more important because it determines the overall robustness or ruggedness of the procedure, receives scant attention in these publications. However, the analytical world is changing; following the publication in 2012 by Martin and colleagues (14) of a stimulus to the revision process article, there is a different approach to analytical procedures coming to the USP. This revision will mean a move from chapters focused only on validation, verification, or transfer of a method to a life-cycle approach to analytical chapters that encompass development, validation, transfer, and improvement of analytical methods.
A new informational USP general chapter, provisionally numbered <1220>, that will focus on validation best practice is being drafted for launch in the fourth quarter of 2016. This focus on validation best practice means that good scientifically sound method development that ends with the definition of the procedure’s design space now becomes important. Now changes to a validated method within the design space would be deemed as validated per se. There will be a transition period where the old approach is phased out while the new one is phased in. There is also a revision of ICH Q2(R1) planned to begin in 2017 to ensure global harmonization in this area.
Therefore, a properly developed and validated or transferred method is required at level 2 of the data integrity model and is a prerequisite for ensuring data integrity of the reportable results generated in level 3. In addition, there is also a need for the other lower layers of the data integrity model to be in place and fully functioning for the top layer to work correctly and obtain the right analytical results.
Level 3: Right Analysis for the Right Reportable Result
Finally, at level 3 of the data integrity model, the analysis of sample will be undertaken using the right method and right data system, with staff working in an environment that enables data to be generated, interpreted, and the reportable result calculated. Staff should be encouraged to admit any mistakes and there must be a no-blame culture in place. It is also important not to forget the importance of the overall quality management system.
The Big Picture
At this point you may be thinking, “Great theory, Bob, and I really like the nice colorful picture, but what does it mean for me? How does it all fit together?” Enter stage left-the big picture.
Figure 3 shows the four layers of the data integrity model in a column down the left-hand side against the various tasks in an analytical process:
- The foundation shows in outline what is required at the corporate layer with management leadership, culture, ethos, and data integrity policies, procedures, and planning. Above the foundation is an analytical process with the various requirements at the three levels of the data integrity model.
- Level 1 shows qualification of an analytical balance as well as the analytical instrument, such as a spectrometer coupled with the validation of a computerized system that controls it. In addition, we have the regulatory requirements for calibration, maintenance, and use logs.
- Level 2 is represented by the preparation of reference standard solutions, sample preparations, and the development and validation of the analytical procedure.
- Level 3 is expanded and shows the application of a validated analytical procedure from sampling, transporting the sample to the laboratory, sample management, analysis, calculation of the reportable result as well as out of specification investigation, and so forth.
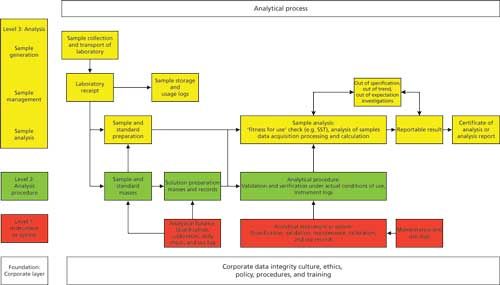
Figure 3: The analytical process and the data integrity model.
This diagram shows how the layers of the laboratory data integrity model interact. Without the foundation, how can the other three levels hope to succeed? Without qualified analytical instruments and validated software how can you be assured of the quality and integrity of the data used to calculate the reportable result and so on. You can also see how the levels of the data integrity model interact because an analytical process is dynamic. The layers are not silos but involve interaction between all: for example, culture and data integrity training from the foundation is a prerequisite for good documentation practices at level 3.
It is less important where an individual activity is placed in the various levels, the primary aim of this model is for analytical scientists to visualize what data integrity actually involves. Reiterating my words at the start of this column: data integrity is not just about numbers. It is much more than that.
Mapping the WHO Draft Guidance to the Model
In a moment of thoughtfulness (or should I say madness), I thought that it would be a useful exercise to map the main contents of the WHO draft guidance document (7) against the laboratory version of the data integrity model illustrated in Figures 1 and 3. The rationale is to see how comprehensive the model is versus the WHO draft guidance and vice versa. Perhaps you can view this process as a circular verification exercise. Out of interest, I was going to map the MHRA guidance (6) against the data integrity model but there was insufficient data to produce a meaningful figure.
The results of the mapping are shown in Figure 4. A note of caution is need before going into the detail though, the mapping of the WHO document only focusses on chapters 5–12 inclusive of the guidance (7), this is a crude level of mapping and does not include any detail within each of the eight sections shown. Similarly, any data integrity requirements contained in the introductory chapters of the guidance such as the section entitled “Principles” have been omitted from this figure.
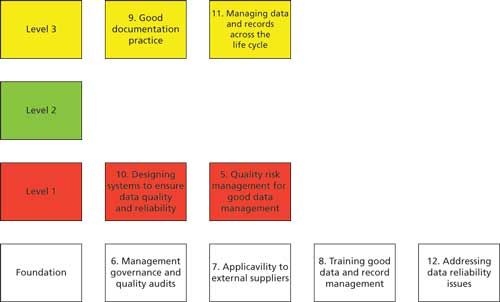
Figure 4: Mapping the contents of the WHO guidance versus the levels of the data integrity model.
Looking at Figure 4, let us assess the distribution of the main chapters:
- The main focus of the WHO guidance is on the foundation layer, which is aimed squarely at management and corporate level efforts at data integrity. Four out of eight chapters are positioned in this layer: management governance, audits, extension to external suppliers, training, and addressing data reliability issues.
- Level 1 focuses on designing computerized systems for data quality and reliability as well as risk management for the protection and management of the records generated by these systems.
- Level 2 is not represented in the WHO draft guidance.
- Level 3 has good documentation practices coupled with managing data across the data life cycle.
Again, reiterating the message earlier, the data integrity model needs to be integrated with the overall pharmaceutical quality system of a regulated organization.
Take Home Message
The rationale for mapping the WHO guidance against the data integrity model is to illustrate that if regulatory authorities are to provide an encompassing perspective and effective guidance on data integrity, then they need to ensure that all aspects of the subject are covered. My perspective, via the data integrity model, is a personal one, but it’s based on a holistic approach to analytical science in the first instance. However, if regulators are to provide effective guidance then they need to consider the big picture and present their requirements in a logical way. From my view point, both the WHO and MHRA guidance documents fail to do this effectively. Nonetheless, the WHO publication is a good step in the right direction, but the gaps need to be filled.
Summary
We have discussed a four-layer data integrity model so that readers can fully understand the overall scope and complexity of the topic. This will enable data integrity programs to be implemented much more effectively to ensure effective regulatory compliance.
The more astute readers may have realized why I have not abbreviated the name of the data integrity model. For the rest of you, “DIM” is not best used in the same sentence as data integrity!
Acknowledgment
I would like to thank Kevin Roberson for the suggestion to place more emphasis on the pharmaceutical quality system in this column installment.
References
- US Food and Drug Administration (FDA), Warning Letters page, http://www.fda.gov/ICECI/EnforcementActions/WarningLetters/default.htm.
- EudraGMP European GMP Regulatory Citations, http://eudragmdp.ema.europa.eu/inspections/gmpc/searchGMPNonCompliance.do.
- Health Canada Inspection Tracker, http://www.hc-sc.gc.ca/dhp-mps/pubs/compli-conform/tracker-suivi-eng.php.
- World Health Organization (WHO), Notices of Concern, http://apps.who.int/prequal/
- General Chapter <1058> “Analytical Instrument Qualification,” in United States Pharmacopeia 35-National Formulary 30 (United States Pharmacopeial Convention, Rockville, Maryland, 2008).
- Medicines and Healthcare Products Regulatory Agency, GMP Data Integrity Definitions and Guidance for Industry, Version 2 (MHRA, March 2015).
- Draft Guidance on Good Data and Record Management Practices (World Health Organization, Geneva, 2015).
- US Food and Drug Administration, Guidance for Industry: Pharmaceutical Quality Systems (FDA, Rockville, Maryland, 2009).
- European Commission Health and Consumers Directorate-General, EudraLex: The Rules Governing Medicinal Products in the European Union. Volume 4, Good Manufacturing Practice Medicinal Products for Human and Veterinary Use (Brussels, Belgium, 2013), chapter 1: Pharmaceutical Quality Systems.
- R.D. McDowall, Spectroscopy30(11), 34–41 (2015).
- ISPE, Good Automated Manufacturing Practice (GAMP) Good Practice Guide: A Risk-Based Approach to GXP Compliant Laboratory Computerized Systems, Second Edition (International Society of Pharmaceutical Engineering, Tampa, Florida, 2012).
- R.D. McDowall, LCGC Europe29(2), 93–96 (2016).
- International Conference on Harmonization, ICH Q2(R1) Validation of Analytical Procedures Text and Methodology (ICH, Geneva, Switzerland, 2005).
- G.P. Martin et al., Pharmacopeial Forum39(5), (2012). Available on-line at www.usp.org.

R.D. McDowall is the Principal of McDowall Consulting and the director of R.D. McDowall Limited, as well as the editor of the “Questions of Quality” column for LCGC Europe, Spectroscopy’s sister magazine. Direct correspondence to: spectroscopyedit@advanstar.com
