An Indole-Based Chemosensor for the Detection of Fluoride Ion and Use In Bioimaging
A new indole-based chemosensor, called FL ((E)-N’-(3-chloro-2-hydroxybenzylidene)-1H-indole- 2-carbohydrazide) capable of recognizing F- ions and exhibiting a turn-on fluorescence response, was synthesized and tested. FL showed a high fluorescence enhancement in the presence of F- ions in a solution of CH3CN-phosphate and buffer solution (PBS) (99:1, v/v) with a significant color change (from colorless to yellow). FL had a good linear relationship with F- from 0 to 11.85 μM and a detection limit up to 3.2 nM. The Job plot indicated that FL formed a compound with F- ions in a 2:1 ratio and the binding constant was calculated to 3.6 × 10⁴ M−2. The proposed bonding mechanism between FL and the F- ion was speculated as hydrogen bonding by O-H∙∙∙F. Results of fluoride ion detection in water samples and cell imaging demonstrated that FL has the potential application to investigate biological processes involving F- ion within living cells.
Fluoride ion, one of the most important nucleophilic anions, has attracted special attention because of its extensive application in oral health and clinical treatment of osteoporosis (1–5). A moderate amount of fluoride ions can help the normal development of bones and teeth (6). It can also improve the resistance of tooth enamel to acid corrosion by bacteria, and it has an obvious effect on preventing dental caries. However, excessive intake of fluoride ions may cause a variety of diseases, such as gastric disease, kidney disease, dental fluorosis, skeletal fluorosis, urolithiasis, and even death, because of its toxicity (7–9). When the fluoride ion content in drinking water exceeds 4 ppm, people are prone to develop skeletal fluorosis, which leads to bone marrow deformity. Therefore, the detection, evaluation, and prevention of excessive fluoride ions is important because of its impact on human health.
There are many methods that have been widely used to detect fluoride ions. These methods include ion selective electrodes (10–16), ion chromatography (17–19), colorimetry (20), and high-performance liquid chromatography (HPLC) (21–22). These common methods can detect fluoride ions quickly and accurately, but they have several shortcomings, which include high cost, poor selectivity, and supplementary sample preparation. With the rapid development of supramolecular chemistry and the deepening of research on anion recognition, chemical sensors based on fluoride ion recognition have become a current research priority (23–25).
One of these chemical sensors is known as the coumarin derivative. Coumarin derivatives are designed as fluoride ion chemical sensors because of their high quantum yield and large stock shift (26,27). Indole, which is a hydrogen bond donor, is favored by researchers as a chemosensor for fluoride ions. In a recent study, Bu’s group synthesized a series of indole-based fluoride ion chemosensors with 2,3-diindol-3-yl diketone (28–30). By connecting 2,3-diindol-3-yl diketone with diaminomaleonitrile, the novel chemosensor displayed a highly selective response to F- in dimethyl sulfoxide, and the color of the solution changed from yellow to red-orange (29). After connecting with 1,2,3,4,5,6-hexaaminobenzene, a visible chemosensor based on photoinduced electron transfer (PET) and intramolecular charge transfer (ICT) mechanisms was formed with a 42 nm red shift of fluorescence emission (30). These chemosensors are characterized using -NH and -OH as hydrogen bond donors to form hydrogen bonds with fluoride ion for identification.
This article discusses how a chemosensor, referred to as “FL”, containing indole and salicylaldehyde moieties (FL) and based on hydrogen bonding for fluoride ion sensing was designed and characterized (Figure 1). FL exhibited a selective and sensitive emission response to the F- ion, and a significant color change (from colorless to yellow) is visible in the presence of the F- ion in a CH3CN:PBS (99:1, v/v) solution. Moreover, its ability to image F- ions in cervical cancer cells (Hela cells) has been demonstrated using confocal microscopy.
FIGURE 1: Synthesis scheme of FL.
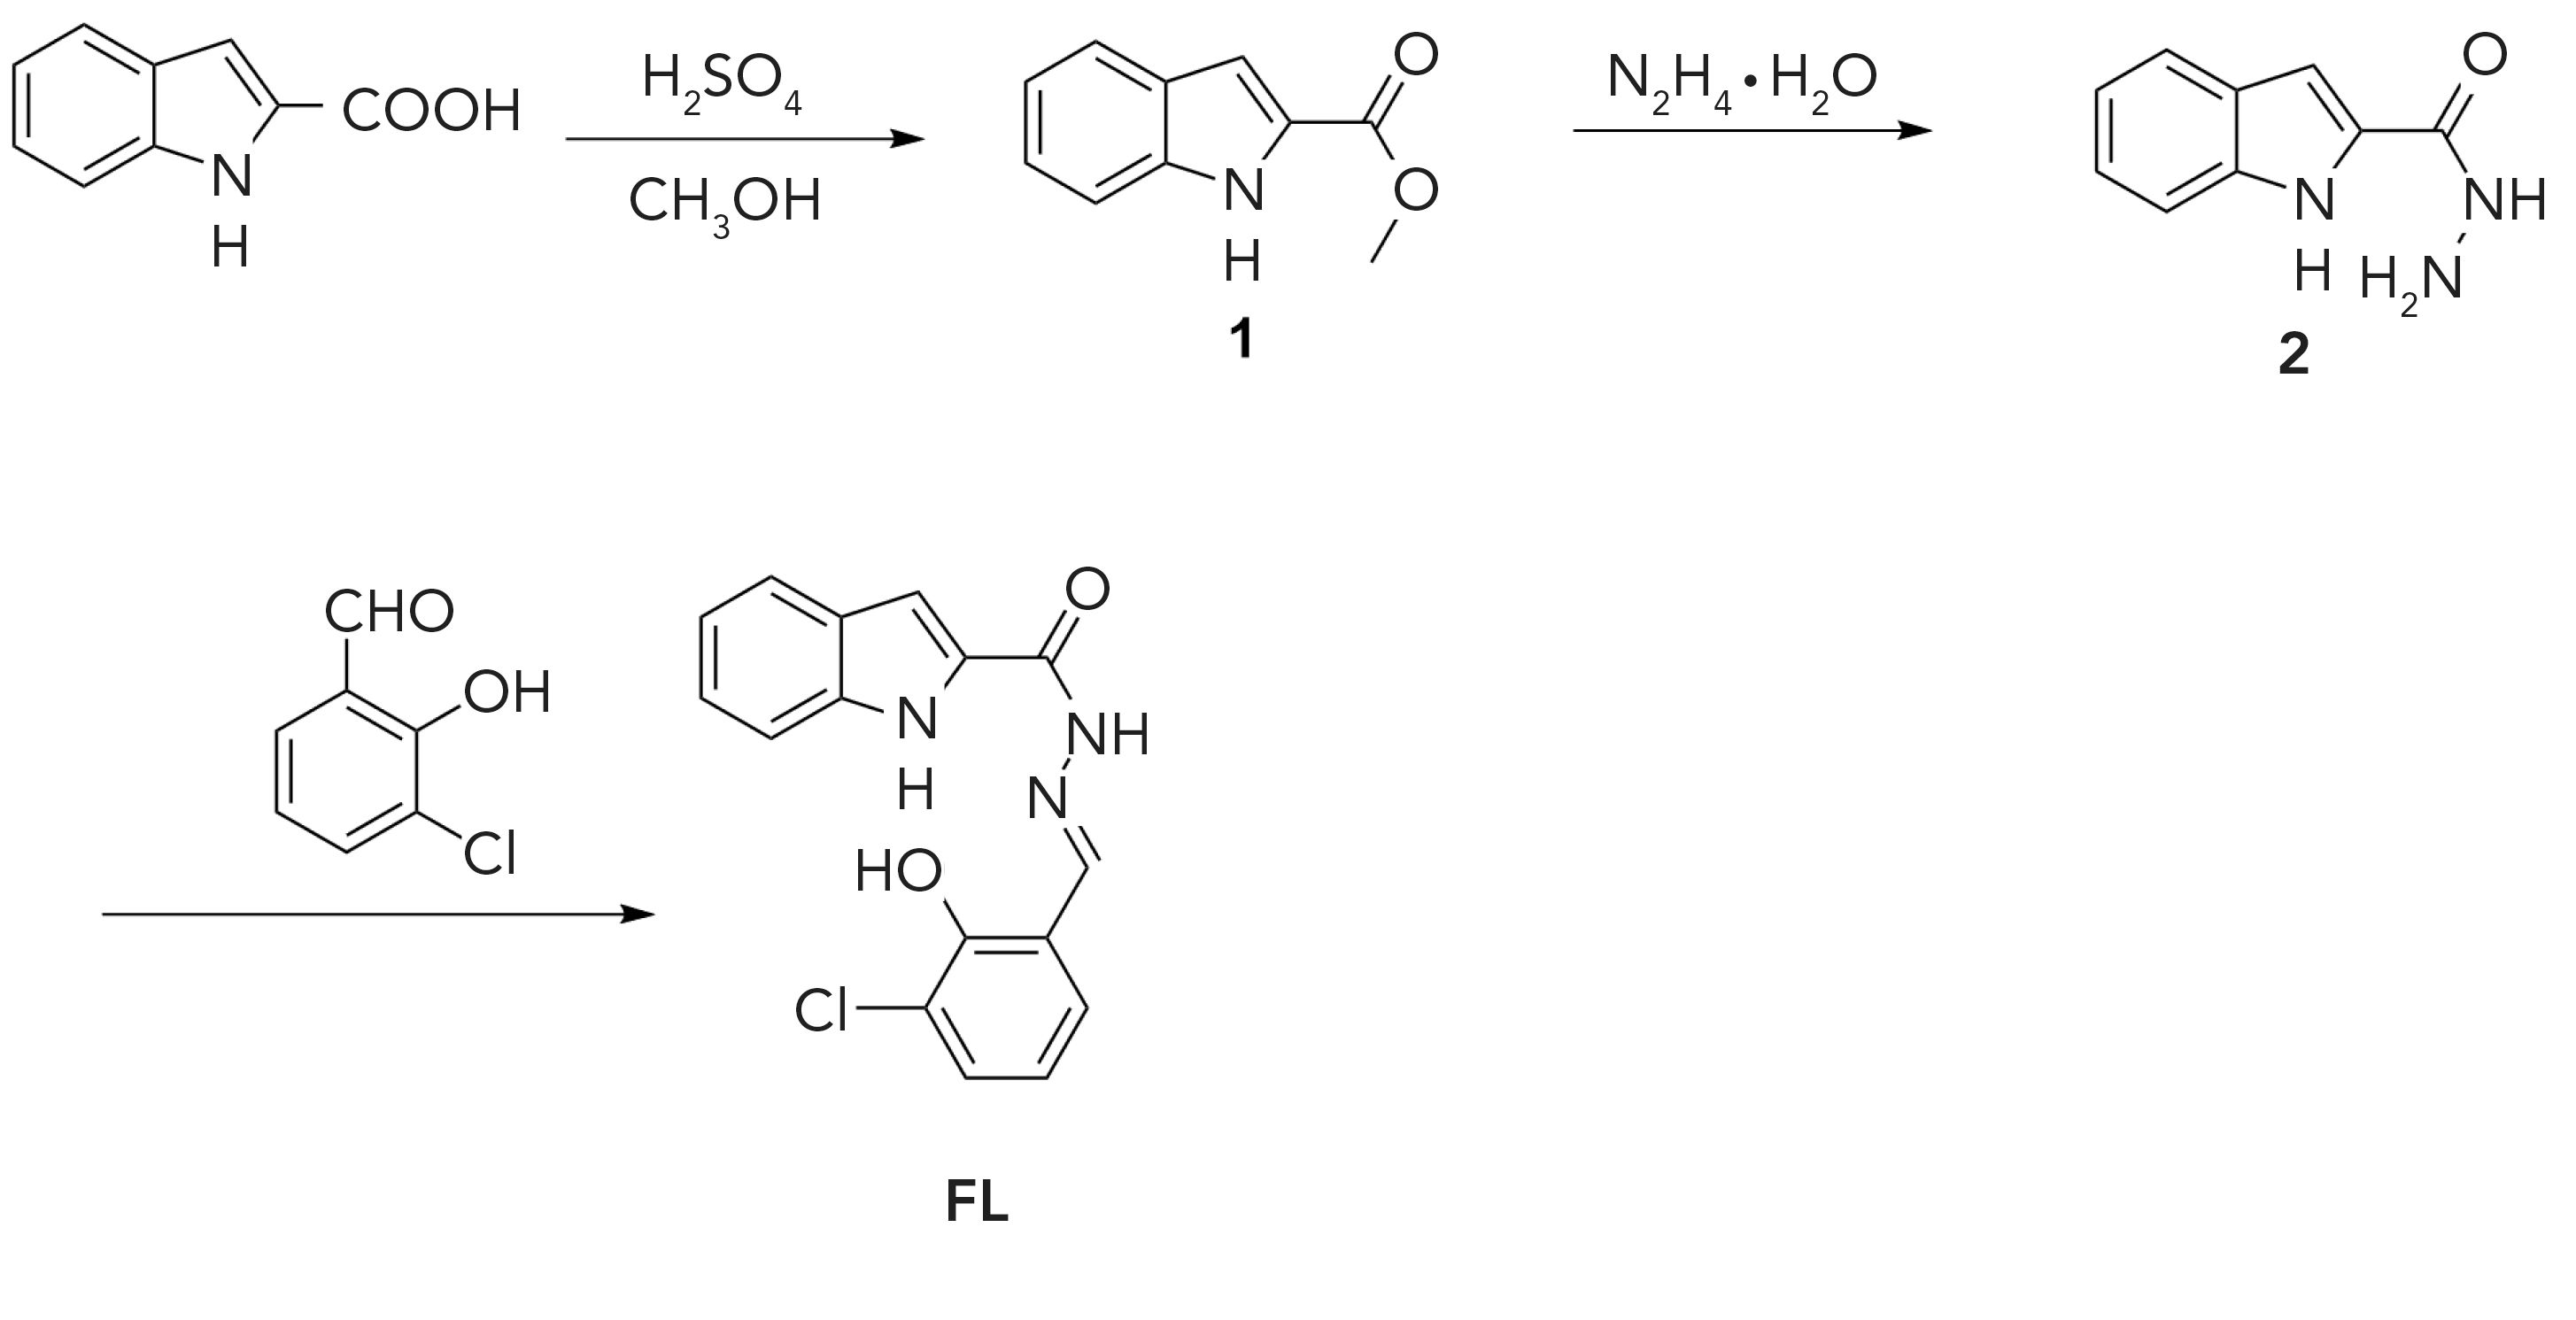
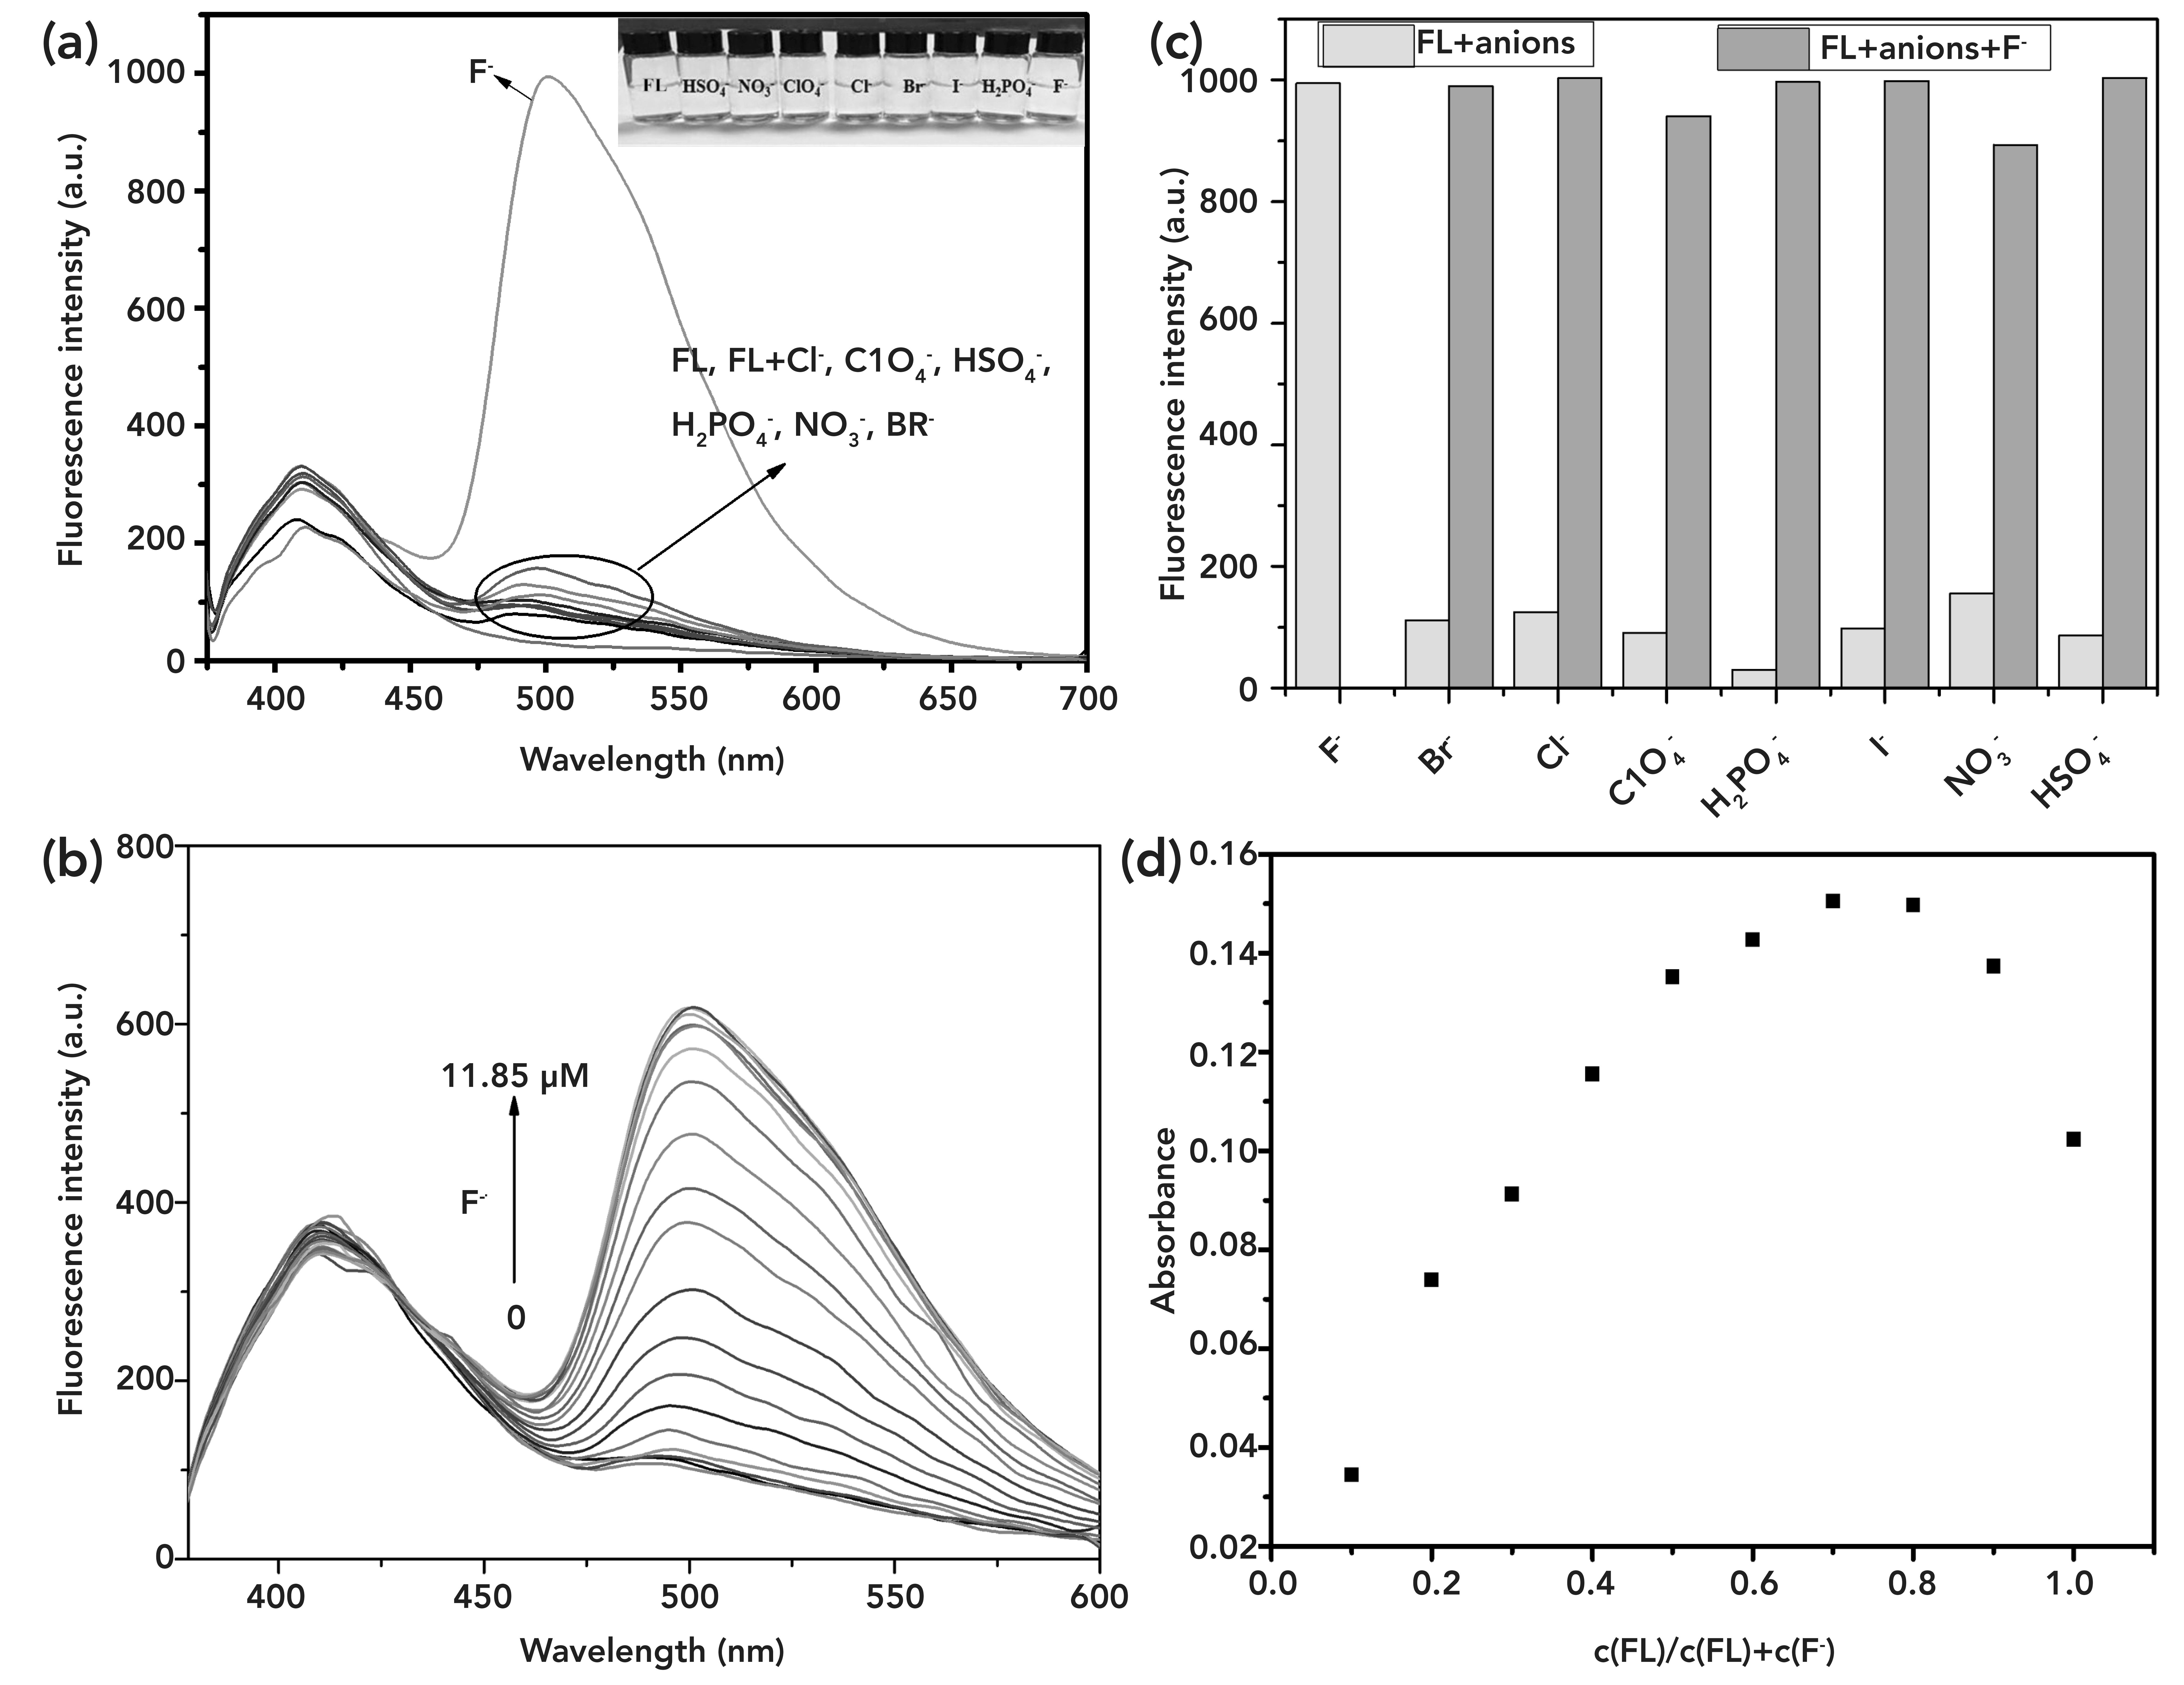
FIGURE 2: (a) Fluorescence spectra of FL in CH3CN:PBS (99:1, v/v) in the absence and presence of various anions (Br-, Cl-, ClO4-, H2PO4-, HSO4-, I- and NO3-); also showing various solutions in vials in upper right hand corner. FL = 1 × 10⁻⁵ mol/L (λex = 362 nm, slit width = 5 nm, 7 nm). (b) Fluorescence titration spectra of FL with different concentration of F- in CH3CN:PBS (99:1, v/v) solution. (c) Competition experiment of FL to various anions. (d) Job plots for FL with F-.
Experimental
Materials and Measurements
All reagents for synthesis were purchased commercially and used directly without any further purification. The water used throughout the experiment was doubly deionized.
The 1H nuclear magnetic resonance (NMR) spectrum of compound 1 was recorded using a 300M NMR spectrometer (Bruker), while the 1H NMR spectra of all other compounds and all 13C NMR spectra were recorded on a Bruker Avance III 600M NMR spectrometer with DMSO-d6 as the solvent. 1H NMR titration experiments used CH3CN-d3 as the solvent. Mass spectra were measured by an LTQ-Orbitrap XL mass spectrometer (Thermo Electron). UV-vis absorption spectra and fluorescence spectra were recorded on a Lambda 950 spectrometer (PerkinElmer) and LS 55 Fluorescence Spectrometer (PerkinElmer), respectively. The final bioimaging application was measured with a Zeiss LSM710 Airyscan confocal laser scanning microscope.
Synthesis of FL
FL was synthesized by the condensation of two compounds, which was readily available from one compound by using the previously reported procedure (31).
Table I shows all NMR data for the three synthesized FL compounds. Synthesis of compound 1, indole-2-carboxylic acid methyl ester, went as thus: Indole-2-carboxylic acid (1.4504 g, 9.0 mmol) was dissolved in 10 mL methanol, and 0.5 mL concentrated sulfuric acid was added. The mixed solution was refluxed for 3 h before being poured into ice water to adjust the pH to 7 by addition of NaHCO3. After stirring in ice water, a white precipitate was formed and filtered. The precipitate was washed with water and dried to obtain a white solid, required to as “white solid #1” (1.5352 g, 97%).
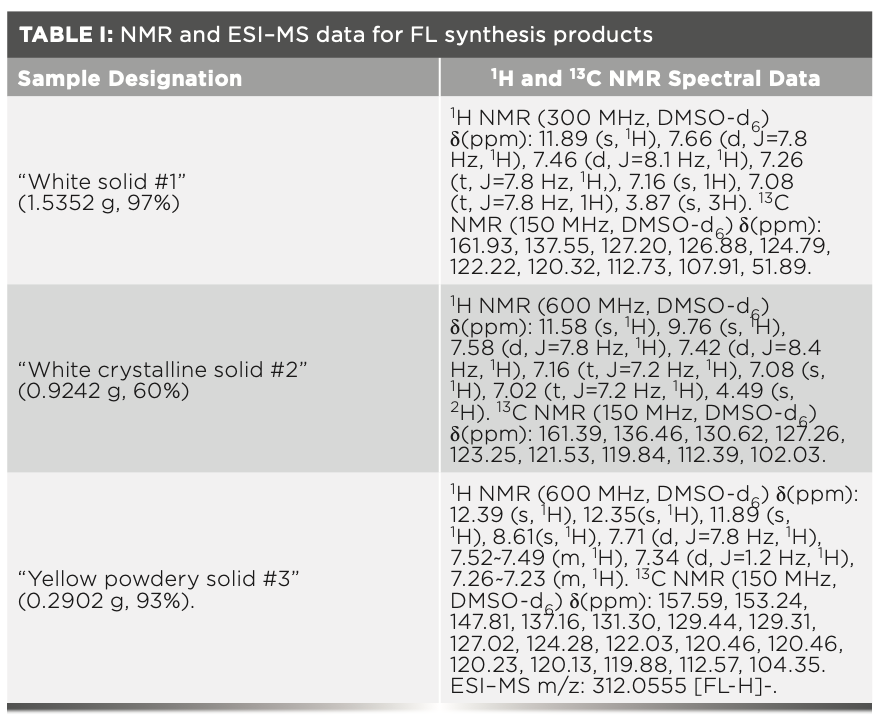
Synthesis of compound 2, indole-2-carboxylic acid methyl ester 1 (1.5352 g, 8.8 mmol, proceeded as follows: Indole-2-carboxylic acid methyl ester 1 (1.5352 g, 8.8 mmol) was dissolved in 50 mL anhydrous ethanol, and hydrazine hydrate (5.26 mL) was added dropwise before being stirred at room temperature. The mixed solution was refluxed for 4 h. After cooling to room temperature, a “white crystalline solid #2” formed (0.9242 g, 60%).
The synthesis of FL proceeded as follows: Indole-2-carbohydrazide 2 (0.1751 g, 1.0 mmol) and 3-chlorosalicylaldehyde (0.1872 g, 1.2 mmol) were dissolved in 15 mL anhydrous ethanol and refluxed for 6 h. After cooling to room temperature slowly, a precipitate formed. The precipitate was washed with portions of ethanol and dried to obtain a “yellow powdery solid #3” (0.2902 g, 93%).
Preparation of Stock Solution of the FL Chemosensor and Anions
The stock solution of the FL chemosensor (1.0 mM) was dissolved in CH3CN. Salt solutions of anions (1.0 mM) (Br-, Cl-, ClO4-,H2PO4-,HSO4, I-, and NO3-) were all prepared by n-Bu4N+ salts in deionized water. Fluorescence spectra measurements were performed with a concentration of 10.0 μM of FL (CH3CN:PBS (99:1, v/v), λex = 362 nm, slit width = 5 nm, 7 nm), while UV-vis spectra measurements were performed with a FL solution with a concentration of 20.0 μM (CH3CN:PBS (99:1, v/v)). In fluorescence titration experiments, 3 mL of sensor solution in a quartz optical cell was titrated with F- prepared in advance. To guarantee the reproducibility of the experimental phenomena, all experiments were repeated two or three times.
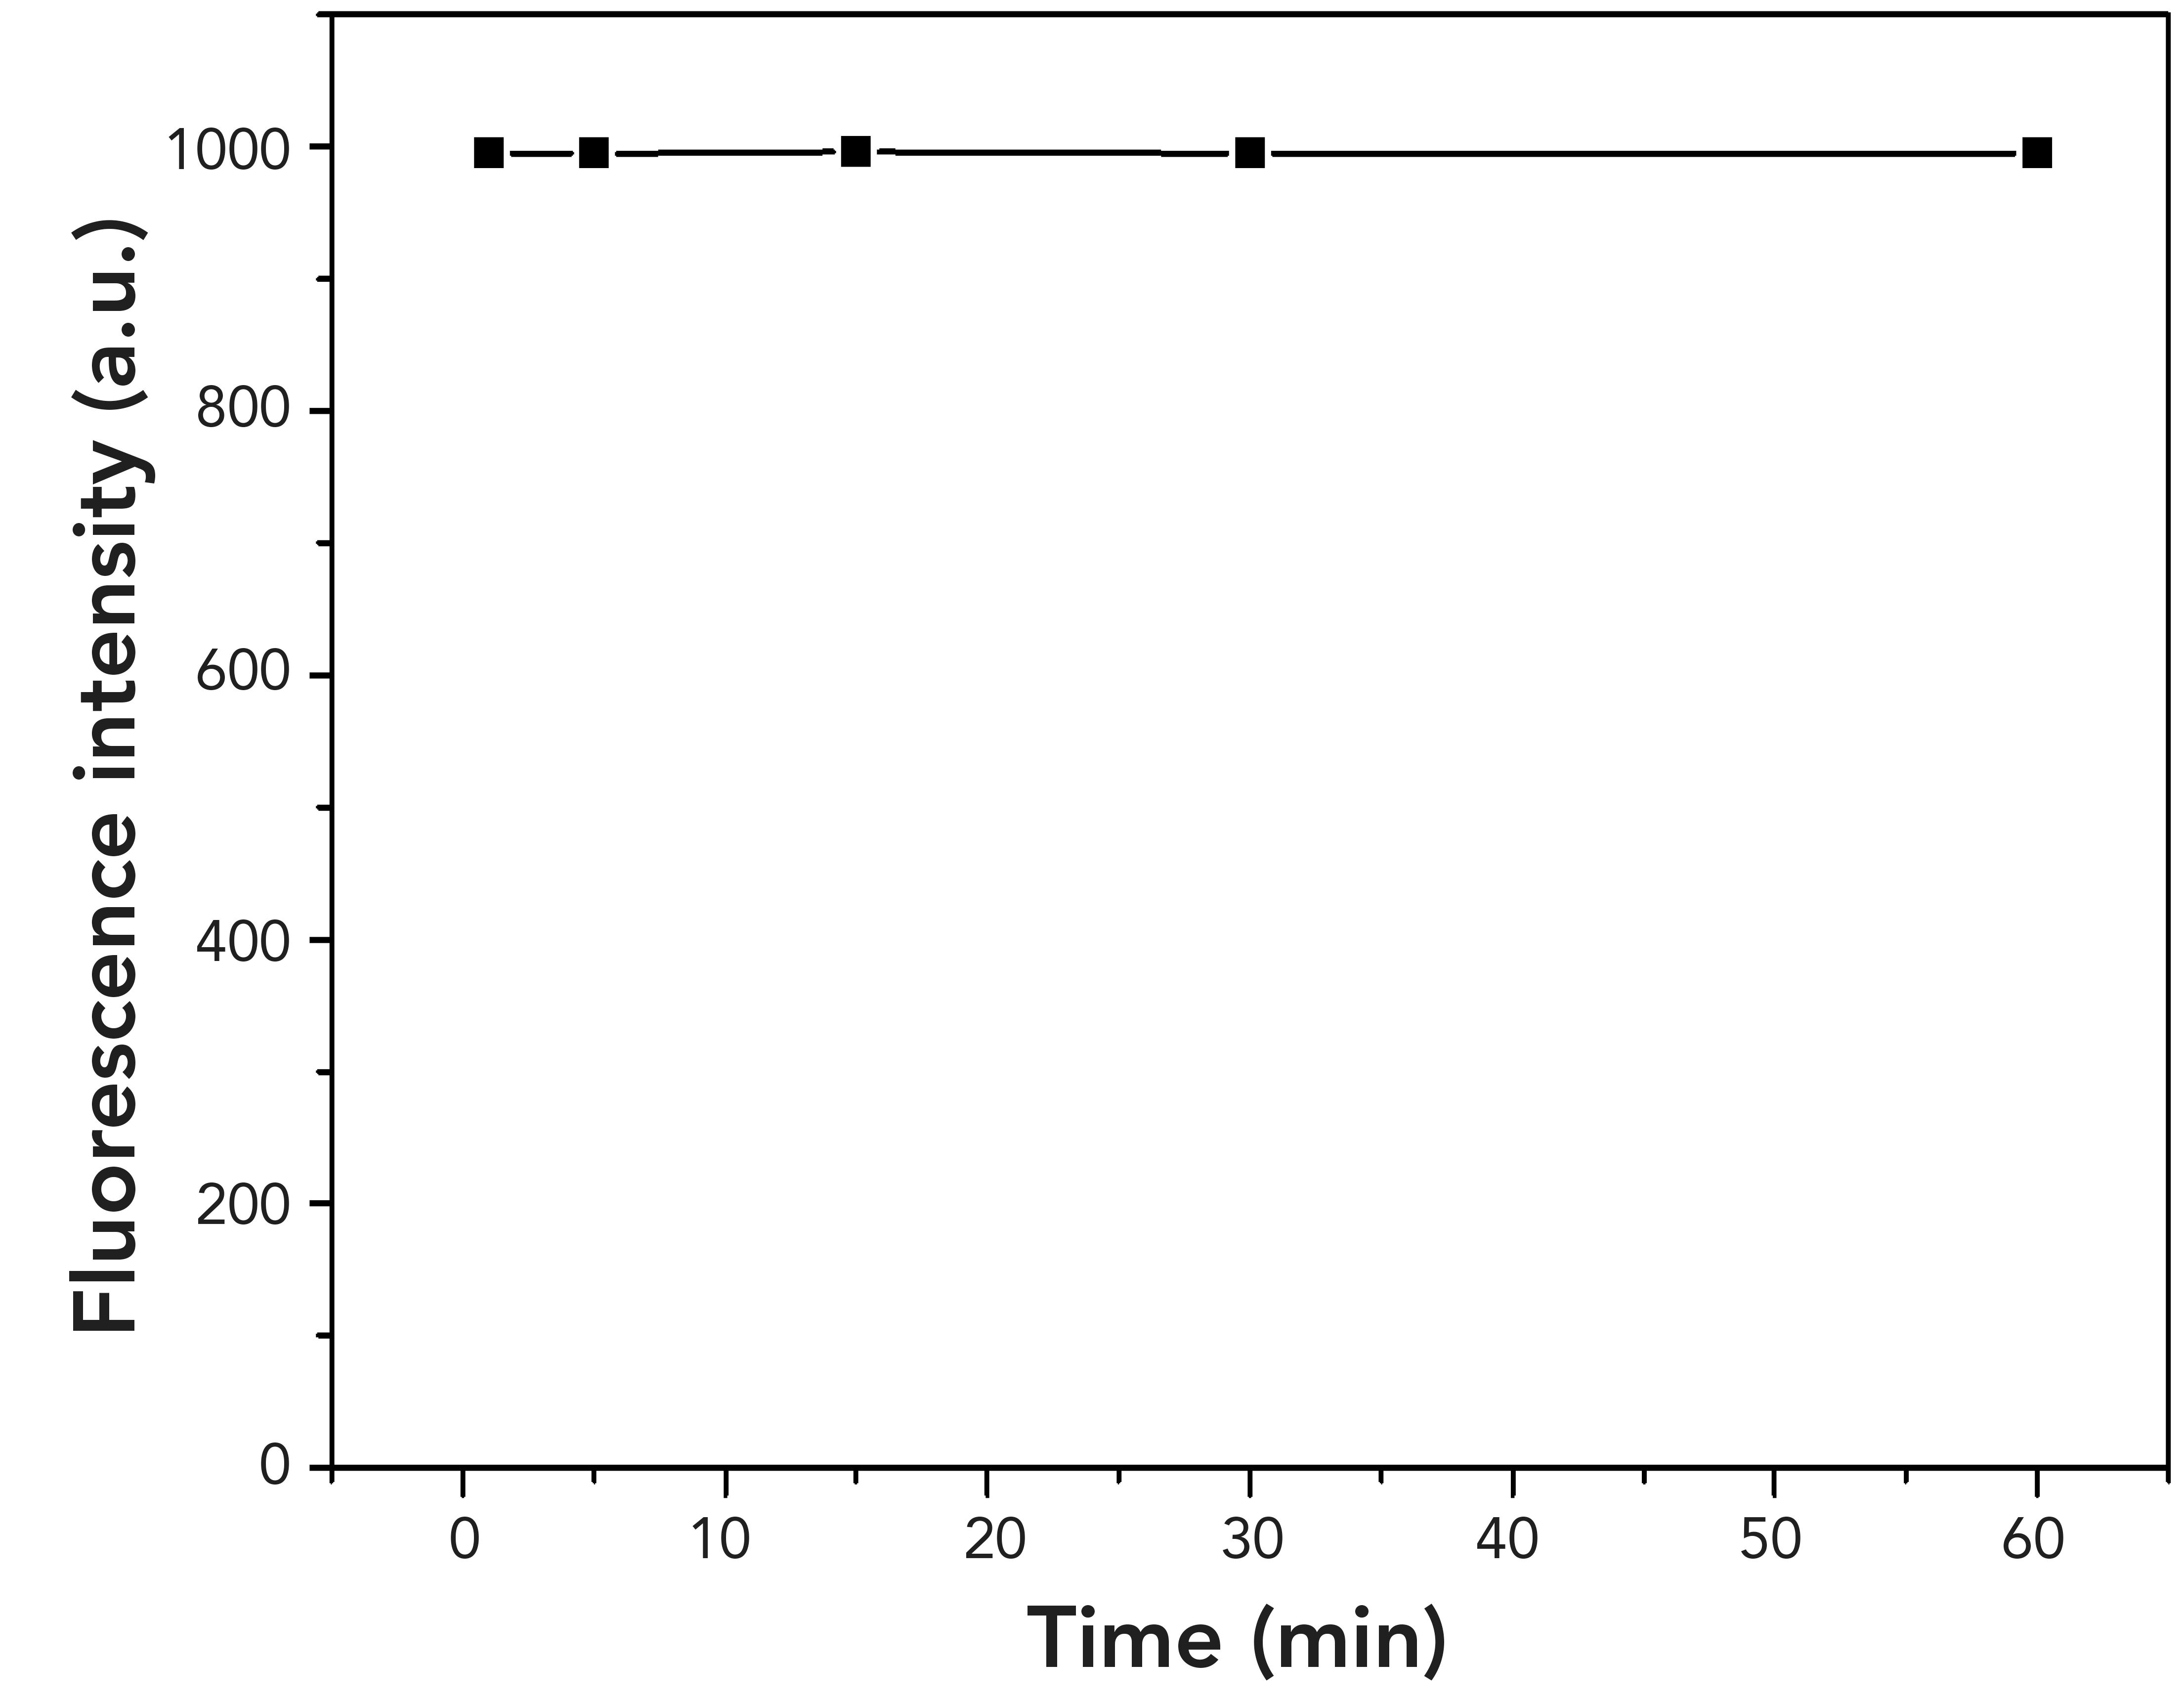
FIGURE 3: Time-dependent fluorescence intensity of FL (10 μM) for F– (1 equivalent) in CH3CN:PBS (99:1, v/v) solution.
Limit of Detection (LOD)
The limit of detection (LOD) was calculated based on fluorescence titration. A plot of the measured fluorescence intensity at the 500 nm emission band versus concentration of F- ion added allowed calculation of the limit of detection from the equation LOD = 3σ/k, where σ is the standard deviation of the emission of a blank solution, which was measured 20 times, and k is the slope of the calibration curve (32,33).
Detection of F- Ion in Water Samples
Water samples used in this work were ultrapure water and tap water from the Nanjing Forestry University. Different concentrations of F- were added to the water samples to test the accuracy of the FL chemosensor and each sample was tested three times.
Cell Culture and Fluorescence Imaging
Hela cells were used for cell imaging. The medium contained 10% fetal bovine serum (FBS) and a 5% penicillin-streptomycin solution. The samples were incubated at 37 °C in 5% CO2. Hela cells were inoculated into six well plates with cover slips at 1.5 × 10⁴ cells per well. After 24 h, the medium was removed and the cells were washed three times with PBS (pH = 7.2). Then, the FL chemosensor (1 × 10⁻⁵ M) was added to the cells followed by incubation for 12 h. At the end of the process, the medium was removed and the cells were washed three times with PBS. Finally, a 5 × 10⁻⁵ M F- solution was added and incubated for 1 h. The cover glass was washed three times with PBS and double-steamed water. The fluorescence of the cells was observed by confocal laser scanning fluorescence microscopy.
Results and Discussion
Selectivity of FL to F- Ion
To evaluate the selectivity of FL, different anions, prepared in advance, were tested in CH3CN:PBS (99:1, v/v) solution by fluorescence spectrometry. Figure 1a shows the fluorescence spectrum of FL after adding Br-, Cl-, ClO4-, F-, H2PO4-, HSO4-, I-, and NO3- ions (λ = 362 nm, slit width = 5 nm, 7 nm). The addition of F- ion induced a significant increase in the emission intensity at 500 nm, while other anions had almost no influence on the fluorescence spectra of FL. This result indicated that FL had a selective recognition of fluoride ion.

Consistent with these fluorescence spectroscopy results, a noticeable color change was observed, with visible light when the equivalent of five F- ions were added to the solution of FL (from colorless to yellow for FL, as shown in Figure 1a), whereas the addition of other anions did not result in a color change. The result indicated that FL could be used as a colorimetric receptor for the visual detection of F-.
The experiment of F- titration against FL was also tested by fluorescence spectroscopy (Figure 1b). A significant increase in fluorescence intensity is observed with the increasing concentration of F- (from 0 to 11.85 μM). FL exhibited a good linear relationship and the correlation coefficient was R2 = 0.99. The solution changes from colorless to yellow and reached saturation thereafter. Thus, FL can be used for quantitative analysis of F-. According to the experiments data from the fluorescence titration experiments, the detection limit of FL with F- can reach 3.2 nM, which was calculated on the basis of LOD = 3σ/k, where σ is the deviation of the blank signal and k is the slope of the calibration curve. By comparison, the detection limit reported in this work is lower than that shown for many other reported chemosensors (Table II).
The possible interference of coexisting anions on the detection of F- was also studied, but by mixing F- in a FL solution with other anions. The competitive experiments were done to further confirm the selectivity of FL for F- ion. Before adding F- ion, the fluorescence intensity of all samples except F- ion was relatively weak, but the fluorescence intensity increased significantly after adding the same equivalent concentration of F- ion (Figure 2c), and the fluorescence intensity was consistent with the solution containing only F- ion. The above experiment indicated that the detection of F- ion does not cause interference with the presence of other anions.
Proposed Sensing Mechanism
To estimate the binding ratio between F- ion and FL, a Job plots (37) experiment was carried out (Figure 2d). The total concentration of FL and F- ion was maintained at 20 μM and the molar ratio of FL was sequentially increased from 0.1 to 1.0 to measure the absorbance. The maximum absorption value of FL/F- was calculated at 0.69, which reveals that the combined chemometrics ratio of FL to F- was 2:1. The binding constant Ka of FL and F- was calculated to be 3.6×10⁴ M-2.
Moreover, the reaction time and stability for FL recognition of F- were studied. When the F- was added to the solution containing FL, the color of the mixture solution turned yellow immediately. The fluorescence spectra were recorded as soon as possible, and the result showed that the reaction time was instantaneous. As a result, the reaction between FL and F- can be considered as expeditious. In addition to the quick reaction time, the fluorescence intensity was stable for 1 h, indicating the excellent stability for recognition of F- by FL (Figure 3).
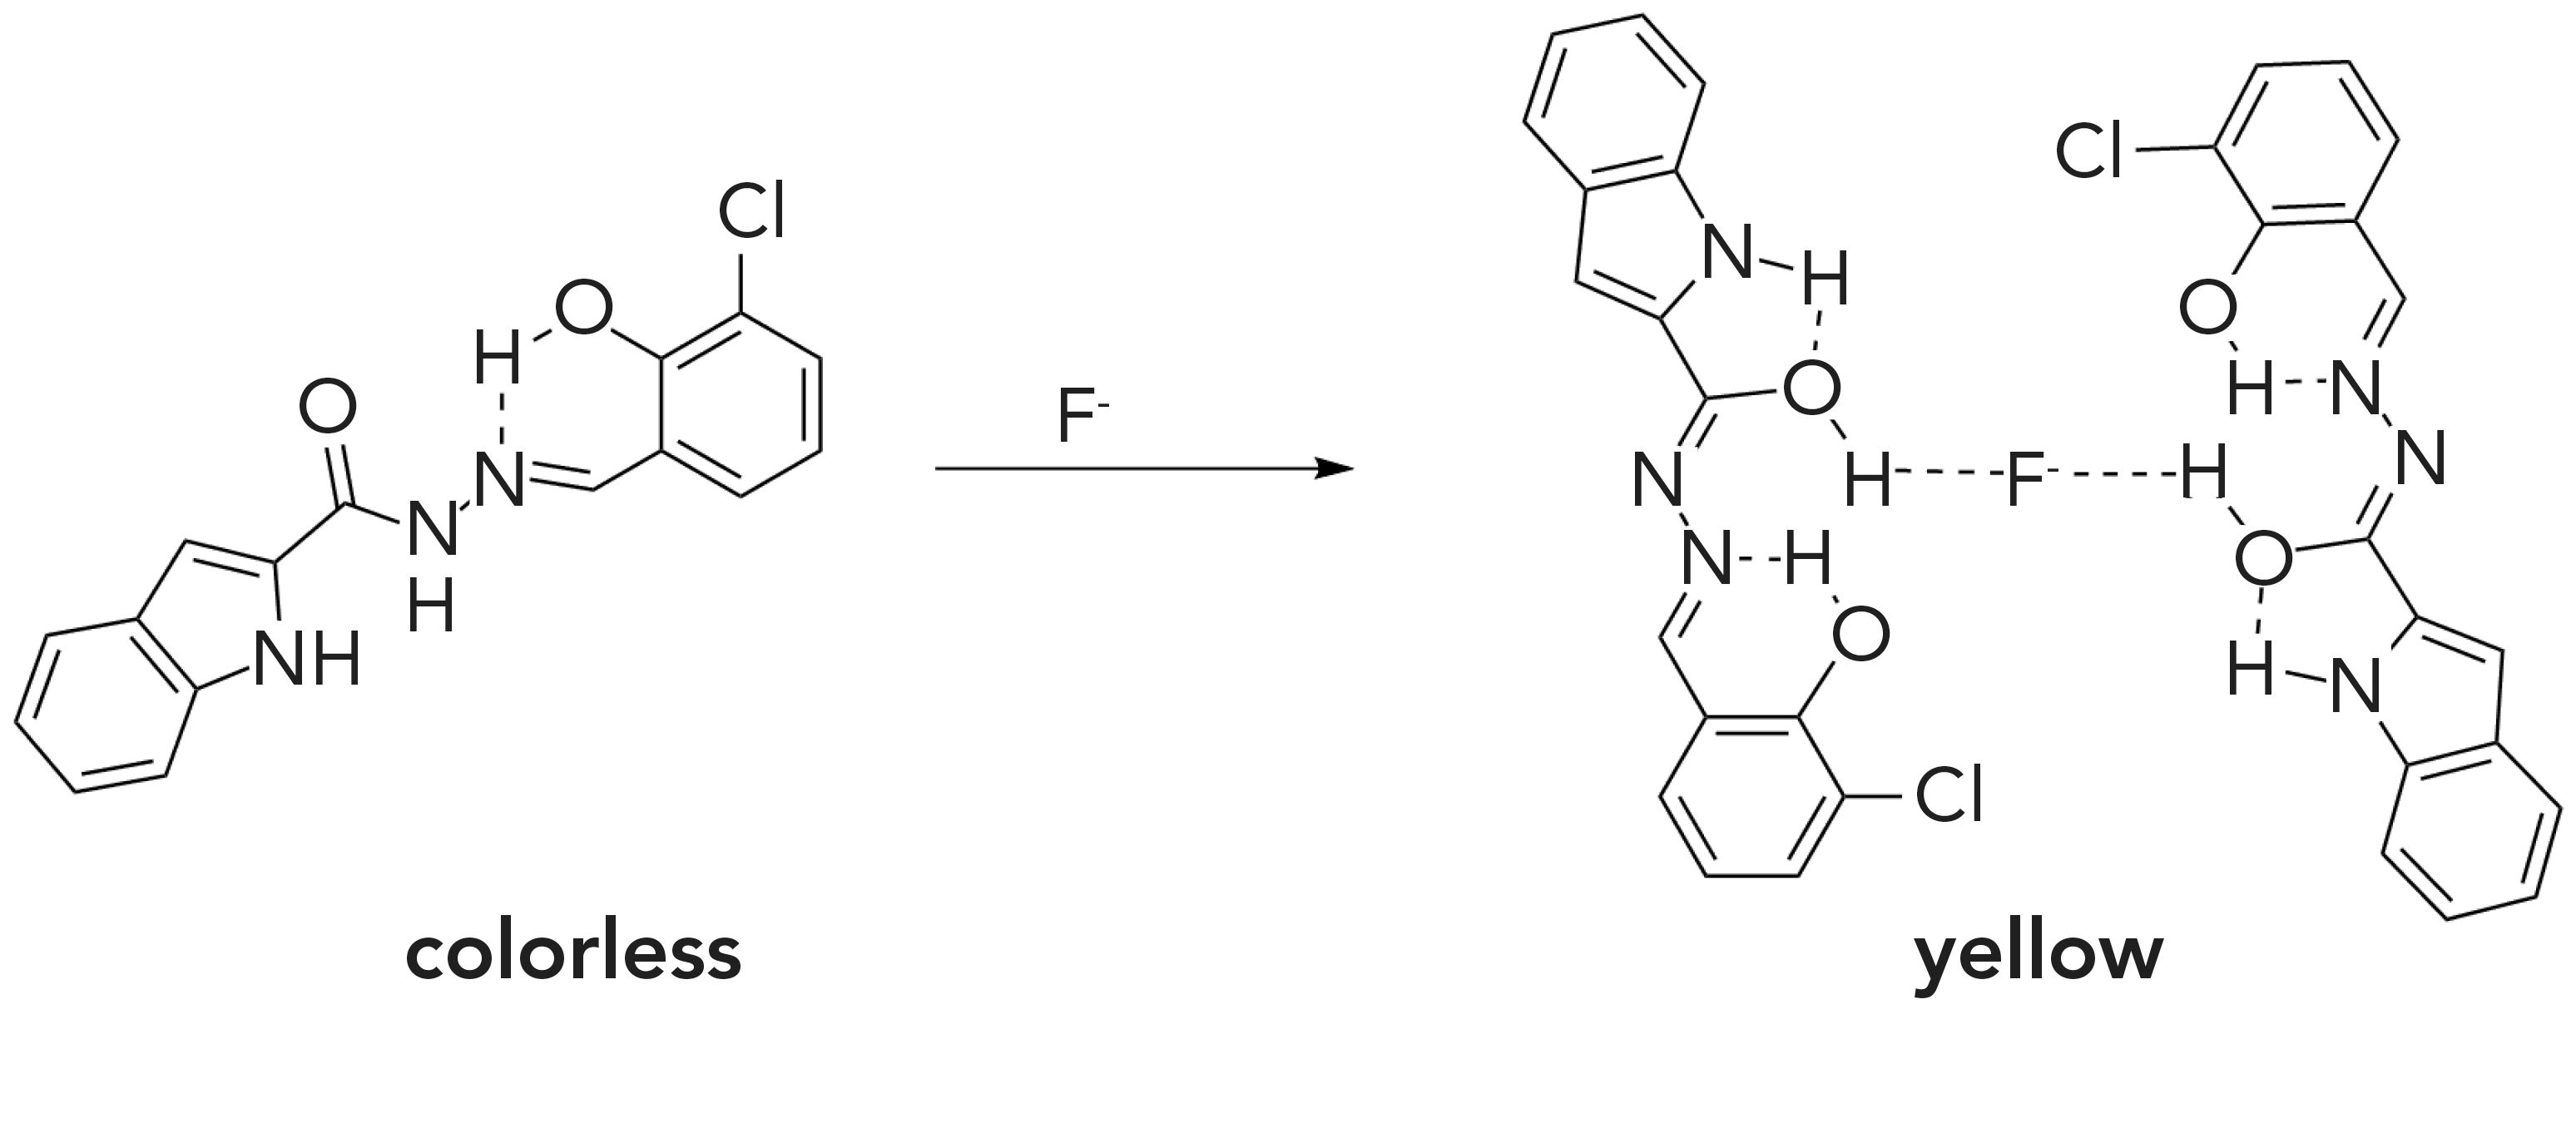
In addition, 1H NMR titration experiments were carried out in CH3CN-d3 to explore the proposed binding mechanism between FL and F- ion. As shown in Figure 4, signals of indole-NH (12.33 ppm), amide-NH (10.67 ppm) and -OH (10.11 ppm) disappeared after F (0.125, 0.25, 0.375) was added to the solution of FL, indicating that a weak hydrogen bond was formed between these protons and F- ions (28). The proton peak of the FHF- ion was not observed in these titration processes, which further proved that the probable mechanism for detection of F- was hydrogen bonding rather than deprotonation (as seen in Figure 5) (28–30). The proposed mechanism is shown in Figure 5. The structure of FL didn’t conjugate well at first, leading to the low fluorescence. After binding with F-, enol tautomerism of the amide bond occurred, which enhanced the conjugation of the structure and increased fluorescence. When the carbon-oxygen double bond changed to hydroxyl, F- formed hydrogen bonds with FL in a ratio of 1:2 by O-H∙∙∙F.
FIGURE 4: 1H NMR spectra of FL with addition of F- in CH3CN-d3: (1) FL only; (2) FL and 0.125 equivalent F-, (3) FL and 0.25 equivalent F-, (4) FL and 0.375 equivalent F-.
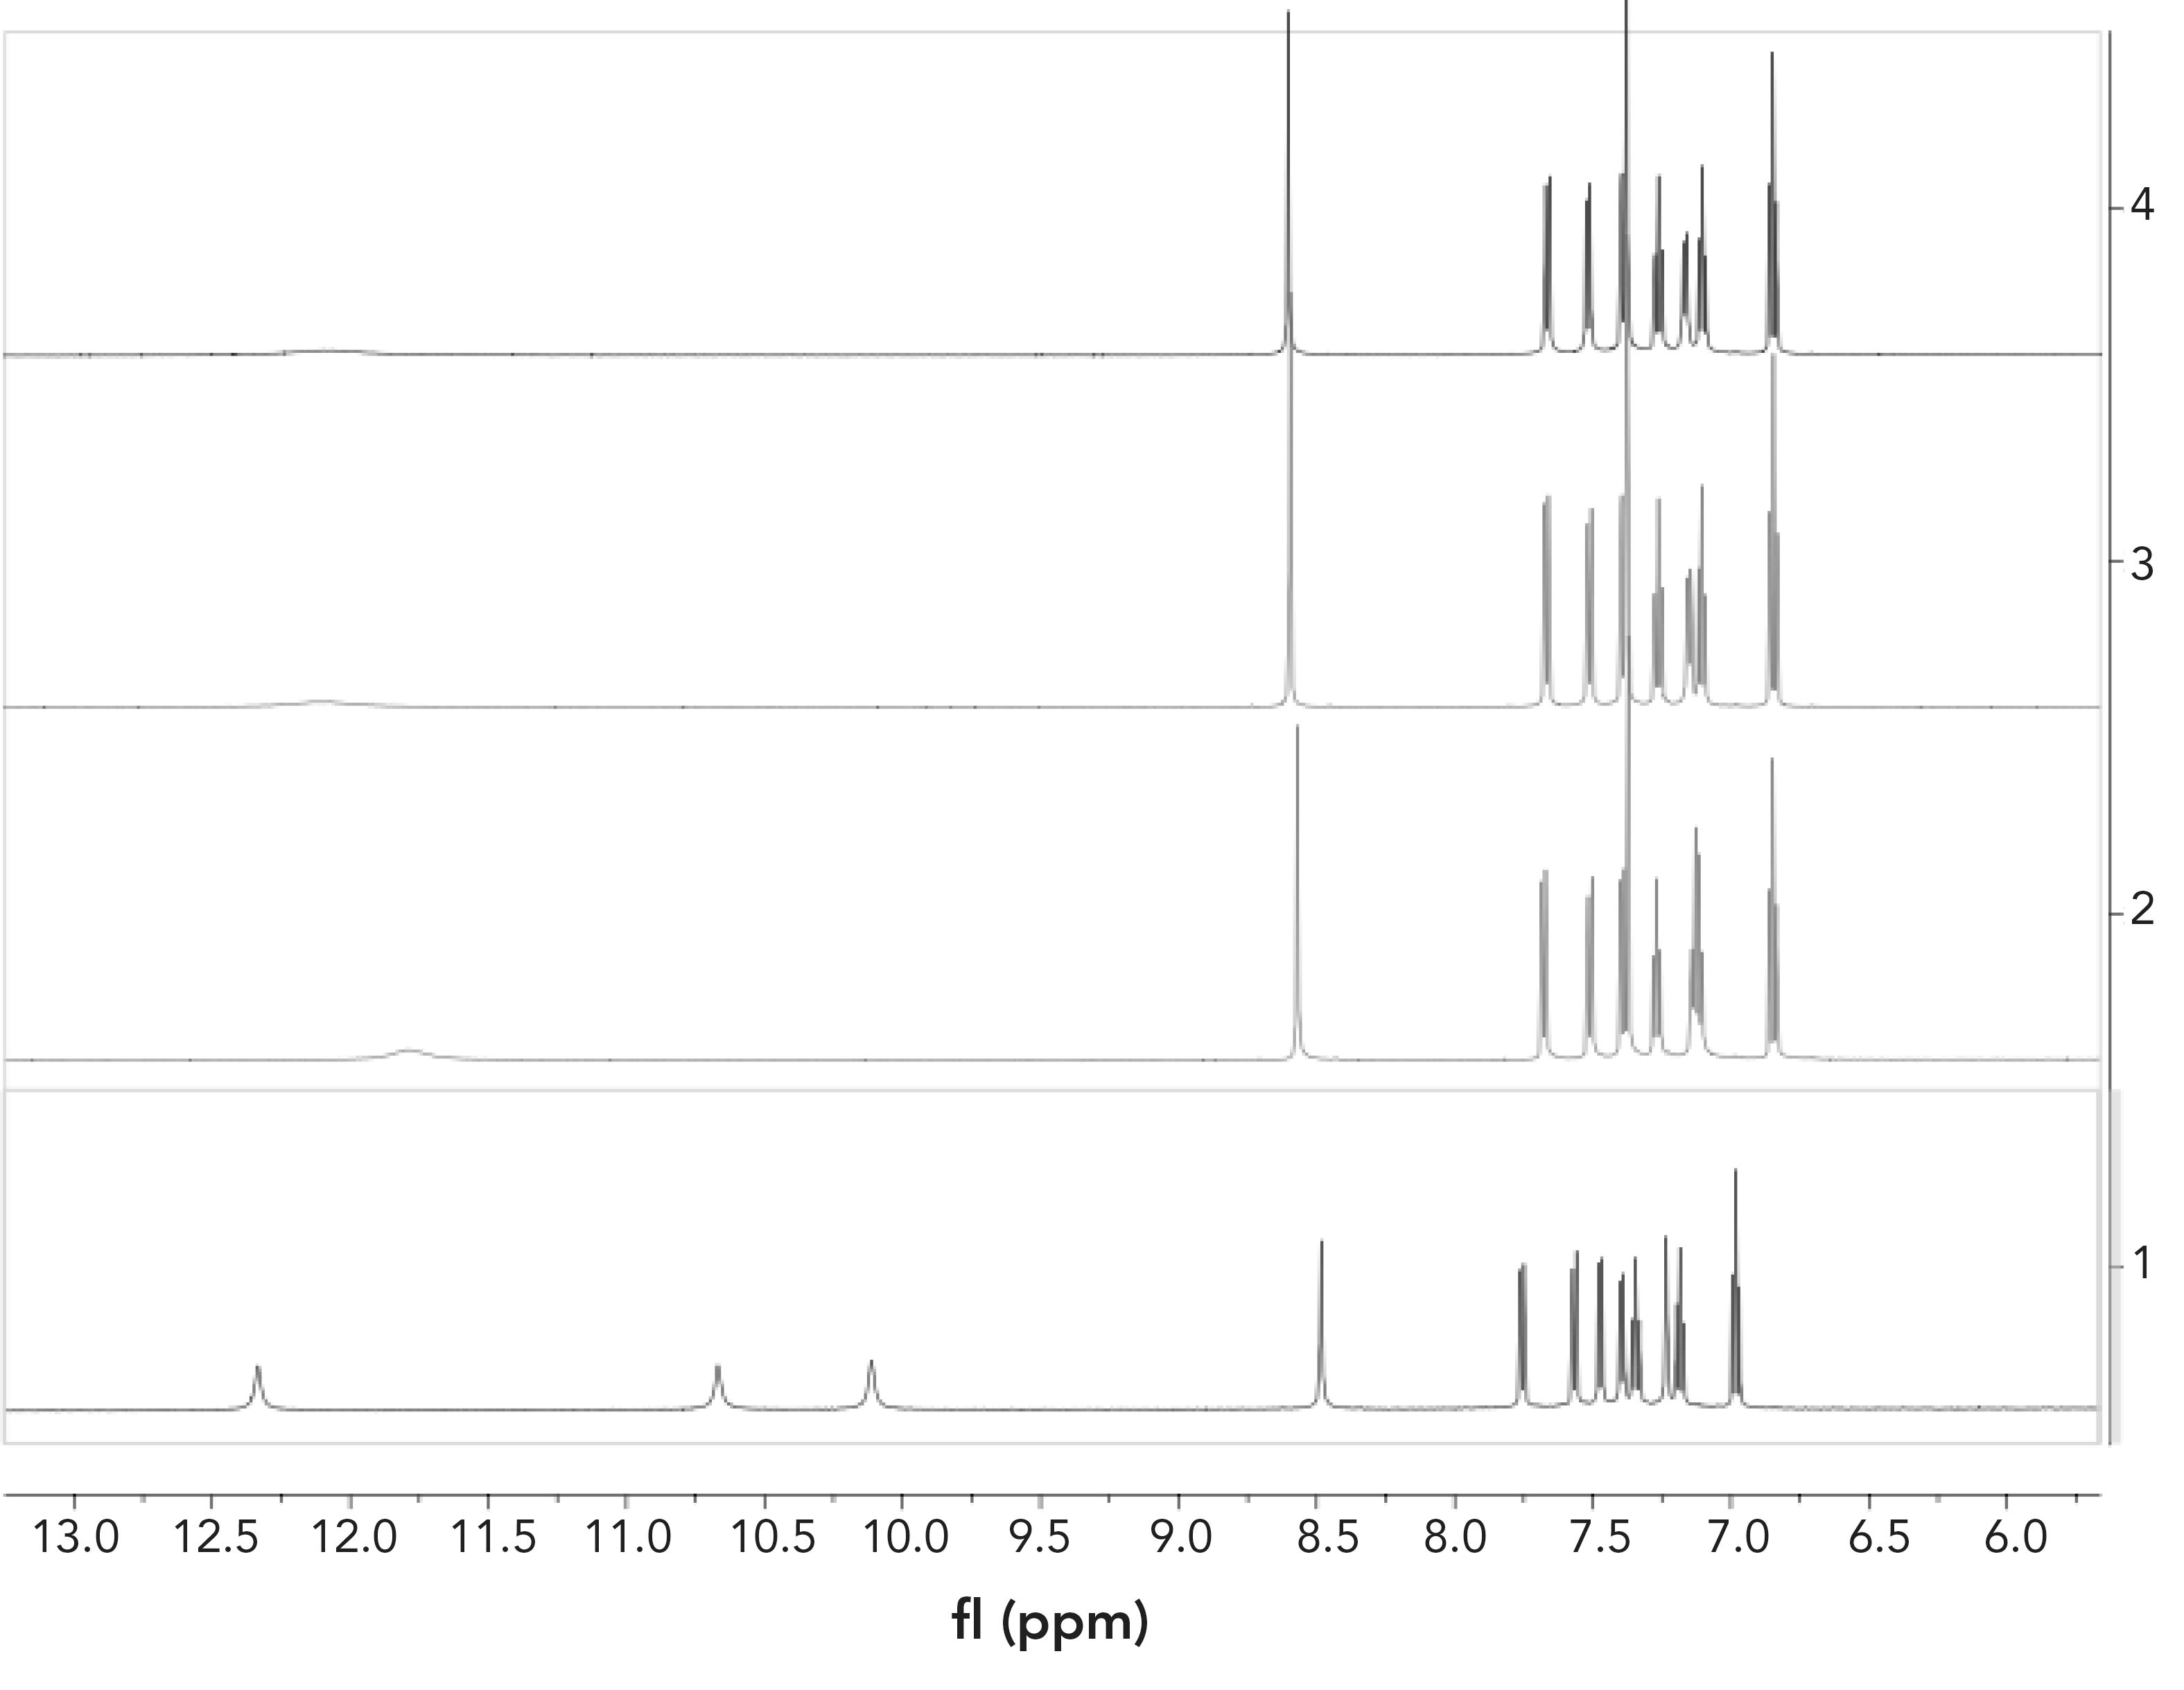
FIGURE 5: Proposed mechanism for detection of F- by FL.
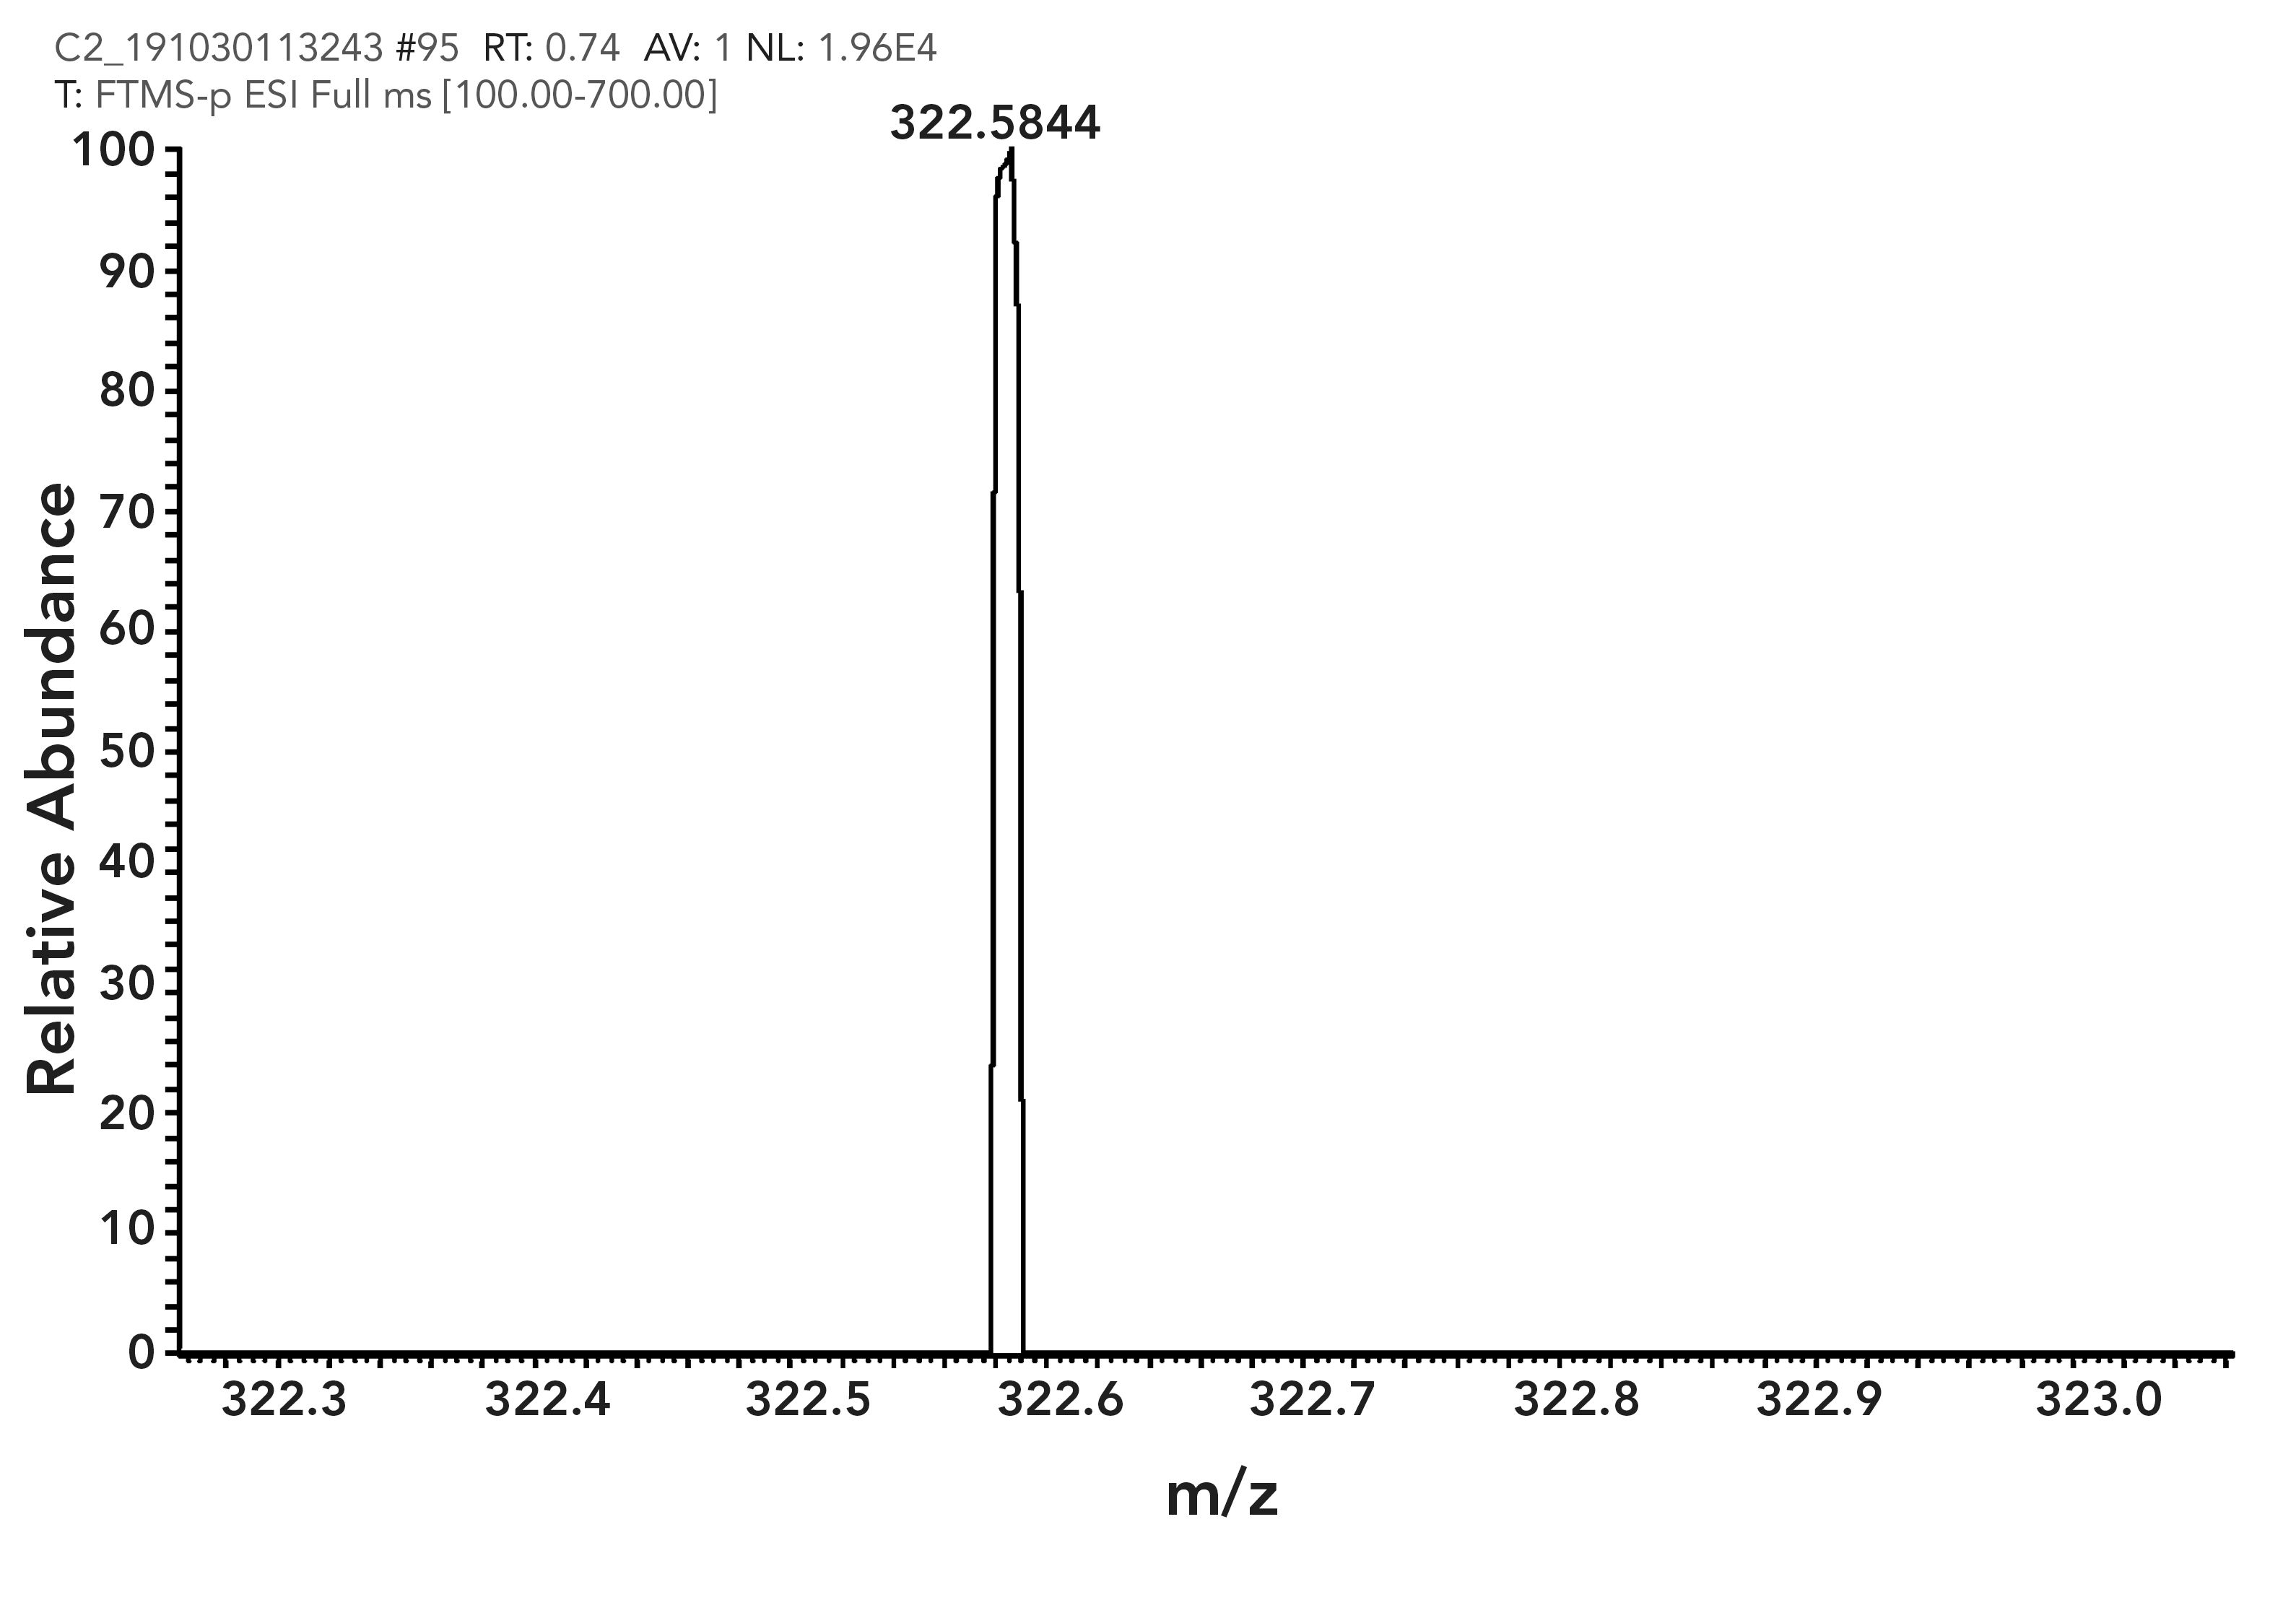
The stoichiometric complexation of FL with F- in a 2:1 stoichiometric ratio was further confirmed by electrospray ionization–mass spectrometry (ESI–MS) mass analysis of the FL–F- complex (Figure 6). The expected [FL + F--H]- was observed at 322.5855 m/z, which is consistent to the theoretical value (322.0574). There- fore, it was confirmed that FL formed a 2:1 complex with fluoride ion.
FIGURE 6: ESI-MS spectrum of FL + F- complex.
Performance in Water Samples
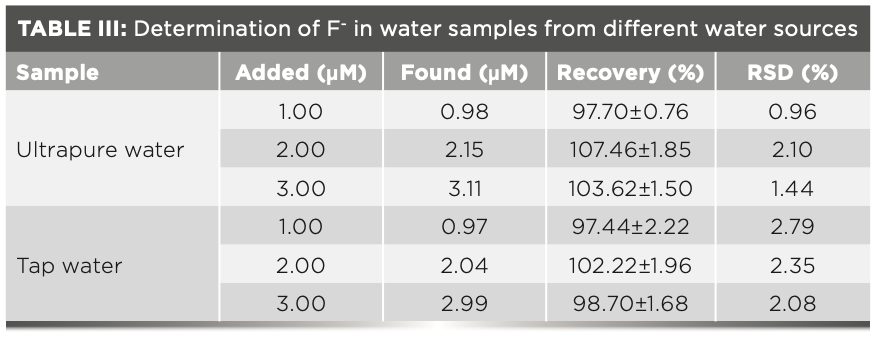
Ultrapure and tap water samples were collected to explore the performance of FL in detecting F- ion in real water samples. In the linear range of the F- ion, ultrapure water was spiked with the standard F- ion at different concentration levels to check the accuracy of determination. The results show that FL has reasonable recoveries and relative standard deviation (RSD) values for the samples, indicating that FL could be used for monitoring F- ion in environmental samples (Table III).
Cell Imaging
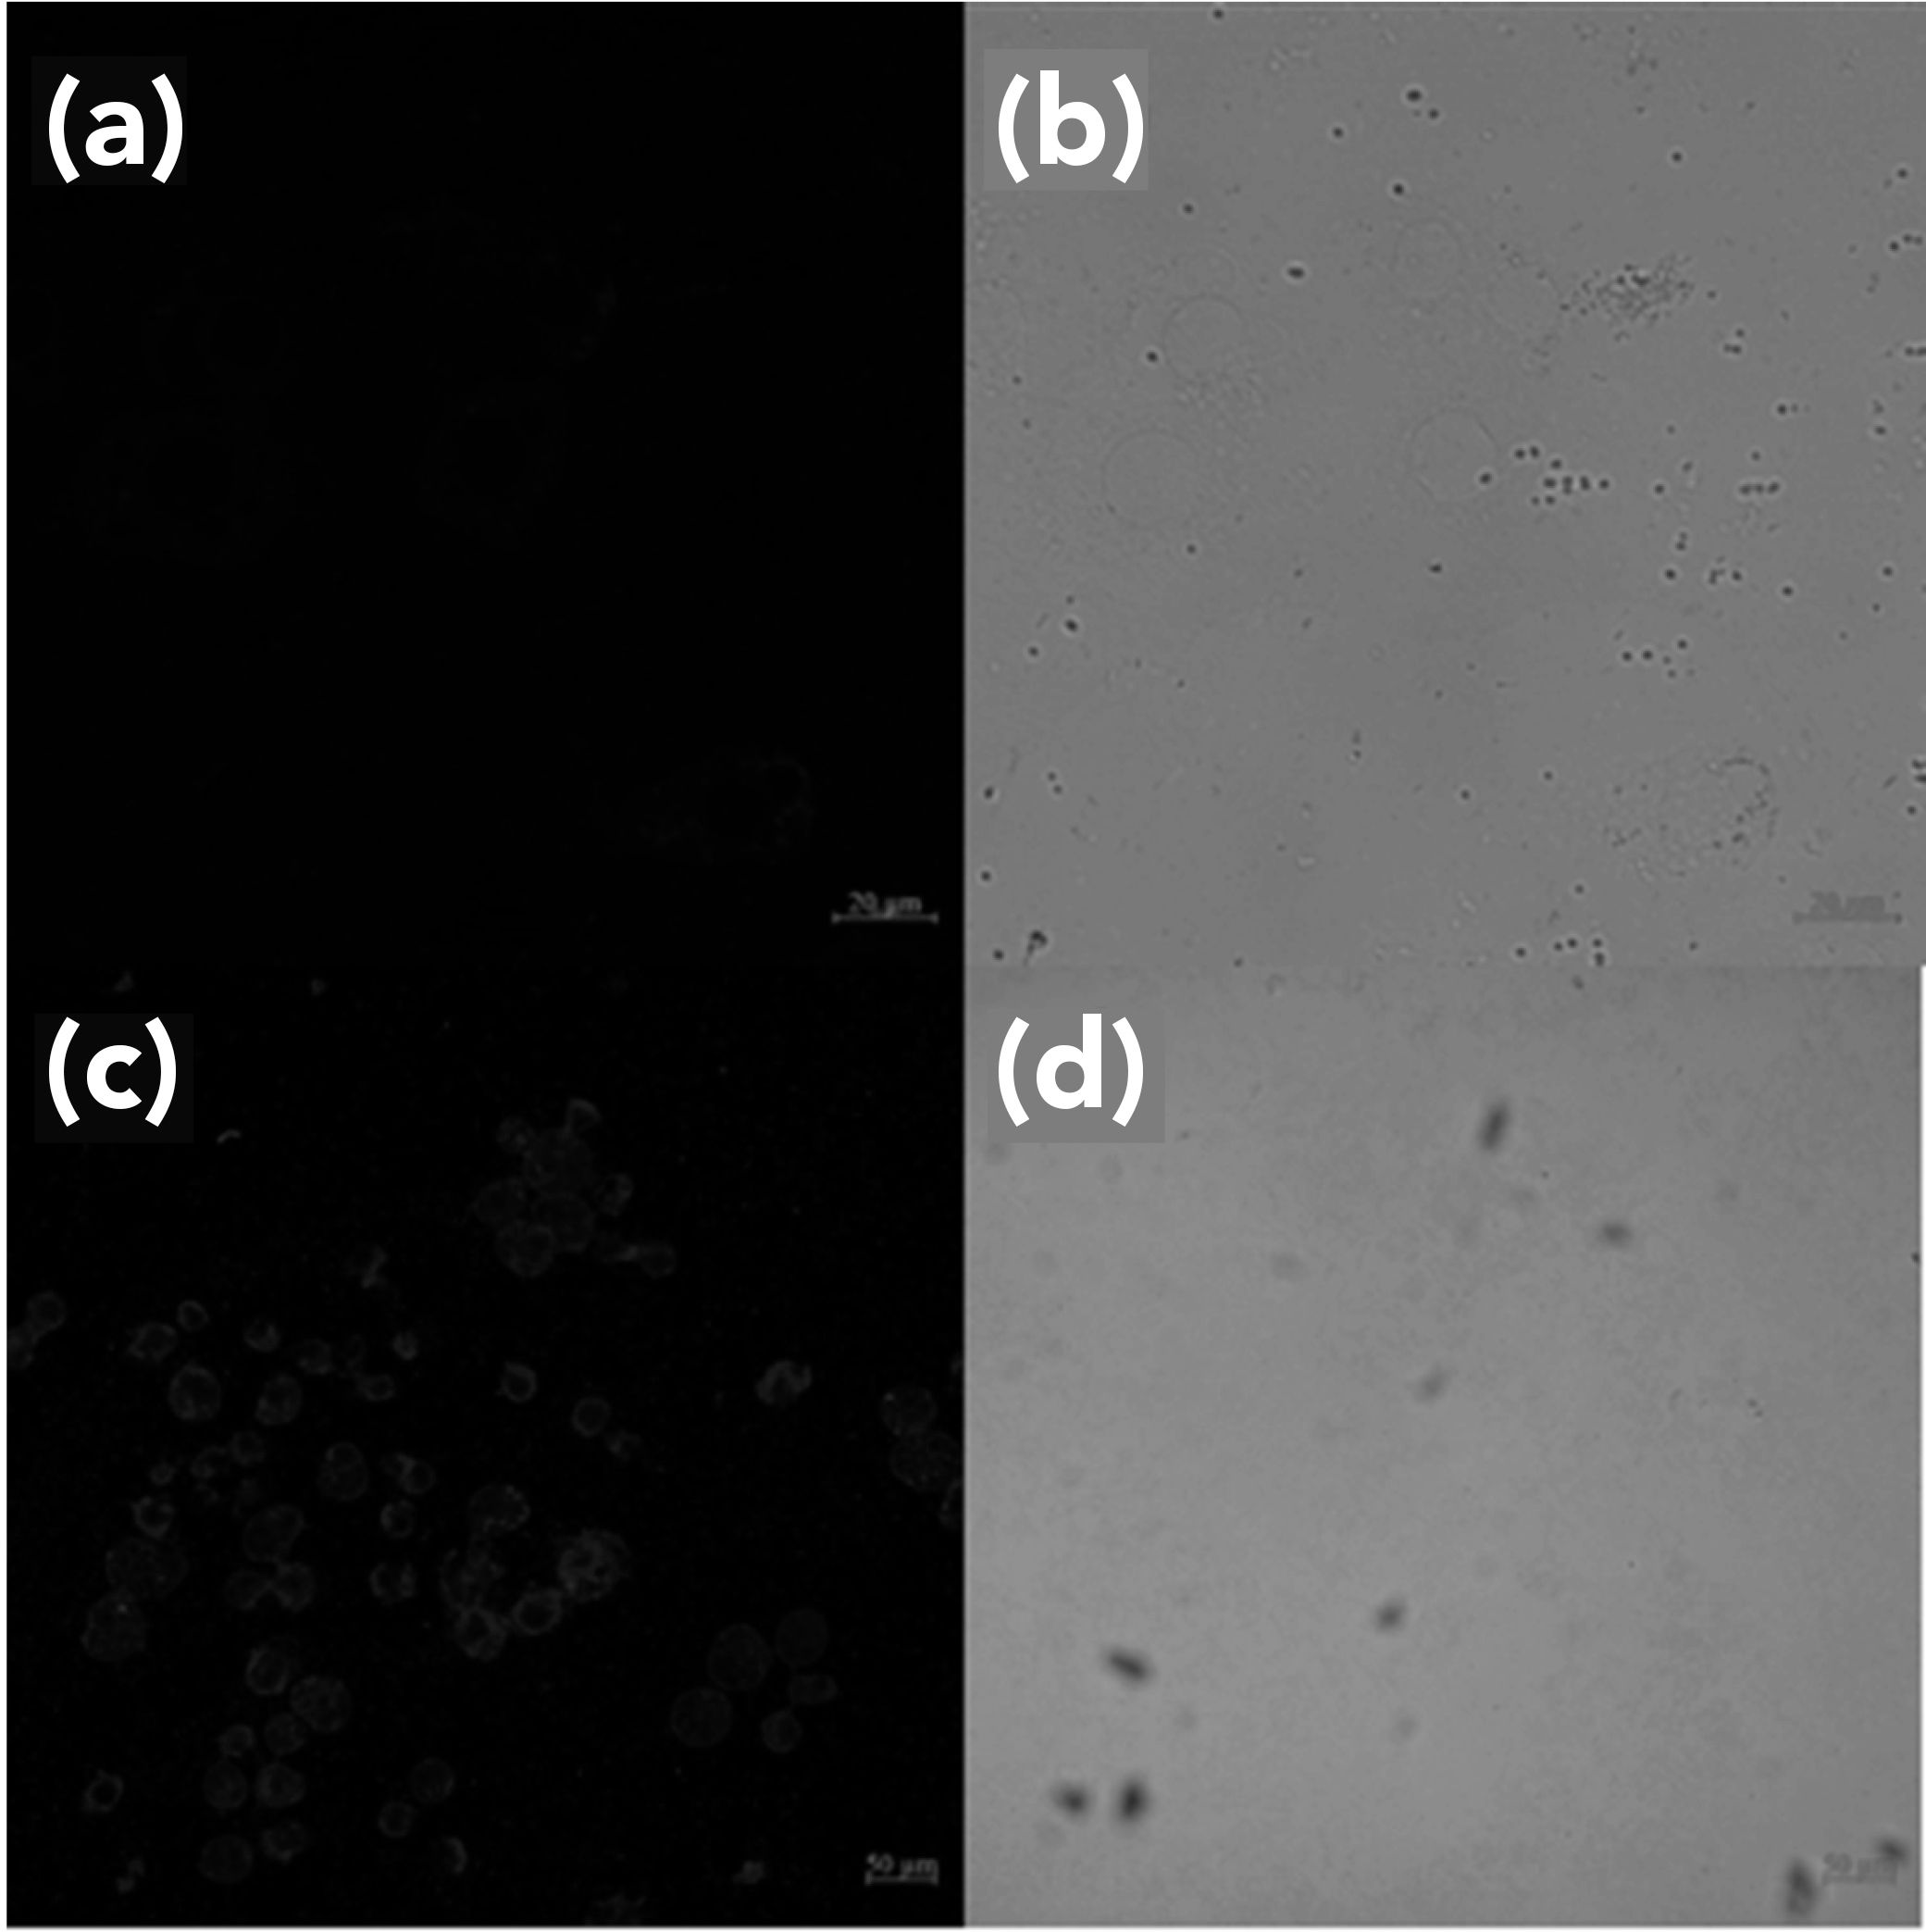
To explore the ability of FL to detect fluoride ion in living cells, Hela cells were chosen. As seen in Figure 7, Hela cells did not exhibit fluorescence without FL, but a weak blue fluorescence was observed after culturing with FL (10 μM) for 12 h (shown in Figure 7a and 7b). Noticeable blue fluorescence was observed in FL medium after 50 μM F- was added (Figure 7c and 7d). This indicated that the cell membrane exhibited high permeability for FL, which once internalized in the cell can detect exogenous F- ion.
Conclusion
In conclusion, the FL chemosensor, based on indole moieties, was successfully synthesized and characterized. The compound displayed a highly selective response to F- ions in a CH3CN:PBS (99:1, 3 v/v) medium with clear color change from colorless to yellow and fluorescence changes. In addition, from fluorescence titration, FL showed a good linear relationship with F- ion from 0 to 11.85 μM. The detection limit and binding constant were calculated at 3.2 nM and 3.6 × 10⁴ M-2, respectively. The proposed binding mechanism between FL and F- ion was hydrogen bonding, as determined by 1H NMR spectra. A Job plot and mass spectrum confirmed the binding ratio to be 2:1. Therefore, FL can be employed as an efficient chemosensor for detecting F- ion in living cells and water samples.
FIGURE 7: Fluorescence images of Hela cells incubated with FL (a) (10 μM), (b) further incubated with F- (5 equivalents); Also showing the corresponding bright field images (b), and (d), respectively.
Acknowledgment
This work was supported by the National Key Research and Development Program of China (2017YFD060070602), Innovation Fund for Young Scholars of Nanjing Forestry University (CX2017017, CX2017004), and the priority academic program development of Jiangsu higher education institutions.
References
(1) H. Miyaji, W. Sato, and J.L. Sesslar, Angew. Chem. Int. 39, 1777–1780 (2000).
(2) A.G. Philip, E.G. Sergio, and G. Joachim, Chem. Soc. Rev. 37, 151–190 (2007).
(3) S.K. Kim and J.L. Sessler, Chem. Soc. Rev. 39, 3784–3809 (2010).
(4) T.W. Hudnall and F.P. Gabba, J. Am. Chem. Soc. 129, 11978–11986 (2007).
(5) J. Aaseth, M. Shimshi, J.L. Gabrilove, and G.S. Birketvedt, J. Trace Elem. Exp. Med. 17, 83–92 (2010).
(6) Y.M. Li, X.L. Zhang, B.C. Zhu, J.L. Yan, and W.P. Xu, Anal. Sci. 26, 1077–1080 (2010).
(7) S. Jagtap, M.K.N. Yenkie, N. Lsbhsetwar, and S. Rayalu, Chem. Rev. 112, 2454–2466 (2012).
(8) J. Ren, Z. Wu, Y. Zhou, Y. Li, and Z.X. Xu, Dyes Pigments 91, 442–445 (2011).
(9) J.M. You, H. Jeong, H. Seo, and S. Jeon, Sensor. Actuat. B. Chem. 146, 160–164 (2010).
(10) M.M.M. Raposo, B. Garcia-Acosta, T. Abalos, P. Calero, R. Martinez-Manez, J. Ros-Lis, and J. Soto, J. Org. Chem. 75, 2922–2933 (2010).
(11) T.C. Paul, J. Fluorine Chem. 126, 1448– 1456 (2005).
(12) L. Jia and X.J. Fan, Food Sci. Tech. 9, 250– 253 (2006).
(13) Y.C. Hao, X.D. Sun, T. Xu, and S.H. Xi, Chin. J. Ctrl. Endem. Dis. 25, 412–415 (2010).
(14) V. Capka, C.P. Bowers, J.N. Narvesen, and R.E. Rossi. Talanta 64, 869–878 (2004).
(15) A. Ruiz-Payan, M. Ortiz, and M. Duarte-Gardea, Microchem. J. 1, 19–22 (2005).
(16) J.P. Hutchinson, C.J. Evenhuis, C. Johns, A.A. Kazarian, M.C. Breadmore, M. Macka, E.F. Hilder, R.M. Guijt, G.W. Dicinoski, and P.R. Haddad, Anal. Chem. 79, 7005–7013 (2007).
(17) H.B. Li and X.R. Xu, Talanta 48, 57–62 (1999).
(18) D.G. Themelis and P.D. Tzanavaras, Anal. Chim. Acta. 429, 111–116 (2001).
(19) W.P. Shi and J. N. Zong, Strait. J. Prev. Med. 8, 54–55 (2002).
(20) X.Z. Wang, Y.Q. Wang, L.Q. Gong, and L.M. Fan, Chin. J. Prev. Med. 37, 48–49 (2003).
(21) J. Nishimoto, T. Yamada, and M. Tabata, Anal. Chim. Acta. 428, 201–208 (2001).
(22) M. Garrido, A.G. Lista, M. Palomeque, and B.S.F. Band, Talanta 58, 849–853 (2002).
(23) X.M. Yuan, M.Z. Li, T. Meng, J. Mack, R. Soy, T. Nyokong, W.H. Zhu, H.J. Xu, and X. Liang, Dyes Pigments 158, 188–194 (2018).
(24) K. Kavallieratos, J.M. Rosenberg, W.Z. Chen, and T. Ren, J. Am. Chem. Soc. 127, 6514–6515 (2005).
(25) E. Ranyuk, C.M. Douaihy, A. Bessmertnykh, F. Denat, A. Averin, I. Beletskaya, and R. Guuilard, Org. Lett. 11, 987–990 (2009).
(26) S. Biawas, M. Gangopadhyay, S. Barman, J. Sarkar, and N.D.P. Singh, Sensor. Actuat. B. Chem. 222, 823–828 (2016).
(27) L. Zhao, G. Liu, and B. Zhang, Spectrochim. Acta. A. 169, 45–49 (2016).
(28) X.M. Liu, Y.P. Li, W.C. Song, Q. Zhao, and X.H. Bu, Talanta 97, 111–117 (2012).
(29) X.M. Liu, Q. Zhao, Y. Li, W.C. Song, Y.P. Li, Z. Chang, and X.H. Bu, Chinese Chem. Lett. 24, 962–966 (2013).
(30) X.M. Liu, Q. Zhao, W.C. Song, and X.H. Bu, Chem-Eur. J. 18, 2806–2811 (2012).
(31) Y.R. Suo, Y. Ye, and F. Yang, China, 201510038452.3[P]. 2015.04.08
(32) S. Goswami, S. Das, K. Aich, D. Sarkar, T.K. Mondal, C.K. Quah, and H.K. Fun, Dalton T. 42, 15113–15119 (2013).
(33) A. Hakonen, Anal. Chem. 81, 4555–4559 (2009).
(34) S.Y. Chen, H. Yu, C. Zhao, R. Hu, J. Zhu, and X. Li, Sensor. Actuat. B. Chem. 250, 591–600 (2017).
(35) D. Lee, C. Lee, E.J. Jun, M. Lee, S. Park, and J. Yoon, Chemistry Open 6, 476–479 (2017).
(36) J.J. Shao, L. Wang, and Y.F. Hu, Anal. Methods 11, 2585–2590 (2019).
(37) A. Facchiano and R. Ragone, Anal. Biochem. 313, 170–172 (2003).
Wen Lu, Jichao Chen, Jiuzhou Shi, and Li Xu are in the College of Science at Nanjing Forestry University, in Nanjing, China. Rui Hu is with the College of Chemical Engineering at Nanjing Forestry University, in Nanjing, China. Buhong Gao and Shilong Yang are with Nanjing Forestry University in the Advanced Analysis and Testing Center in Nanjing, China. Direct correspondence to: 2016qlsz@njfu.edu.cn.
New Study Reveals Insights into Phenol’s Behavior in Ice
April 16th 2025A new study published in Spectrochimica Acta Part A by Dominik Heger and colleagues at Masaryk University reveals that phenol's photophysical properties change significantly when frozen, potentially enabling its breakdown by sunlight in icy environments.
Tracking Molecular Transport in Chromatographic Particles with Single-Molecule Fluorescence Imaging
May 18th 2012An interview with Justin Cooper, winner of a 2011 FACSS Innovation Award. Part of a new podcast series presented in collaboration with the Federation of Analytical Chemistry and Spectroscopy Societies (FACSS), in connection with SciX 2012 ? the Great Scientific Exchange, the North American conference (39th Annual) of FACSS.
Can Fluorescence Spectroscopy Evaluate Soil Dissolved Organic Matter Dynamics?
February 20th 2025A new study published in Chemical Engineering Journal by researchers from Northeast Agricultural University in China reveals that biochar aging, influenced by environmental factors like UV exposure and wet-dry cycles, alters dissolved organic matter composition and affects its effectiveness in remediating cadmium-contaminated soil.
New Fluorescent Raman Technique Enhances Detection of Microplastics in Seawater
November 19th 2024A novel method using fluorescence labeling and differential Raman spectroscopy claims to offer a more efficient, accurate approach to detect microplastics in seawater. Developed by researchers at the Ocean University of China, this method improves both the speed and precision of microplastic identification, addressing a key environmental issue affecting marine ecosystems.